About the delights of switching to the panel and not only

As is obvious from the title, we will talk about the Panel library, which allows you to convert Jupyter notebooks into safe web applications, where the filling is hidden from non-technical users, but there remains the freedom to manipulate internal parameters, that is, not only rebuild the data, but also make requests to the kernel. TL; DR Shiny for Python.
One of the main problems of business analytics is that no matter how cool it is,
it often does not reach the user who makes decisions based on it. IBM CTO of AI and data science says that only 13% of projects in the field of data science go to production and one of the main reasons is the difficult cooperation of all those involved in the projects. By narrowing the gap between the datasatanist, the programmer deploying the project and the subject analyst, you can significantly increase the overall exhaust, reduce the time and make the final product more thoughtful.
This problem is solved by several products currently available in this niche.
For a good, scalable deployment, there is Dash . In my last post I did a little
illustration on the example of used car market analysis. For the advantages of Dasha, you need to pay a price in the form of a separate app that needs to be written separately, Plotly is supported from graphics, you need to design the interface, tweak some CSS / HTML, and when updating the analysis model, if it is in notebooks, you need to support two codes, in general not very convenient while the project is under development.
From the other end, Voila and Panel solve the problem (Voila needs to be dashingly, in D'Artagnanowski's voice, to say: “Voila!”). Voila comes from a notepad and supports Jupyter interactive widgets with which it can communicate with a kernel from a web application, regardless of its language (the creators talk about language independence, but for R it is not relevant for them to have Shiny, and there is no business analytics on Julia ) Voila allows you to make an interactive app in two clicks (not counting the implementation, for example, ipywidgets, there you need to clicks decently). Panel is a purely python solution and goes to the same problem from the other side - from the server, while notepad and Jupyter are optional. The model can be saved in a regular python file and the server will not require the entire Jupyter ecosystem. Panel is not tailored for a specific library for graphics ( examples are given on matplotlib, bokeh, altair and plotly).
Both options - Panel and Voila are not optimal for use as loaded applications, but they are not intended for this, the idea is to do an analysis, file a dashboard with the results, throw a link to the analyst / manager, let them play with the parameters and requests, fix the intermediate result. If you suddenly need to file a long-lived application for a wide range of people - you can transfer to Dash and cast in bronze.
Next, a small illustration of how the process looks. Let's make a simple dashboard based on data on the used car market in France and Germany (just because it’s at hand, you can get acquainted with the details of the dataset in another post ). From the functional, it will be possible to calculate the average prices depending on age and their standard deviation based on statistics on proposals for models, and to build price distributions smoothed out from noise during the year.
First, make a dashboard in Panel, then use Voila. Notepads along with data can be downloaded from the repository , or browse through nbviewer ( panel , voila ).
Actions that do not differ from just analysis in a notebook I will leave without details, they can be seen in notebooks by links, there is nothing new there.
To start, we import the libraries and data. I will use Bokeh for graphics, because I have it standard and there are blanks for copy paste.
Next, we will prepare several functions:
wm and std to use them when grouping data in pandas
default_graph and default_bar_plot - create empty chart blanks
color_picker - to distribute selected objects in the color palette
In the main part, we declare the used widgets
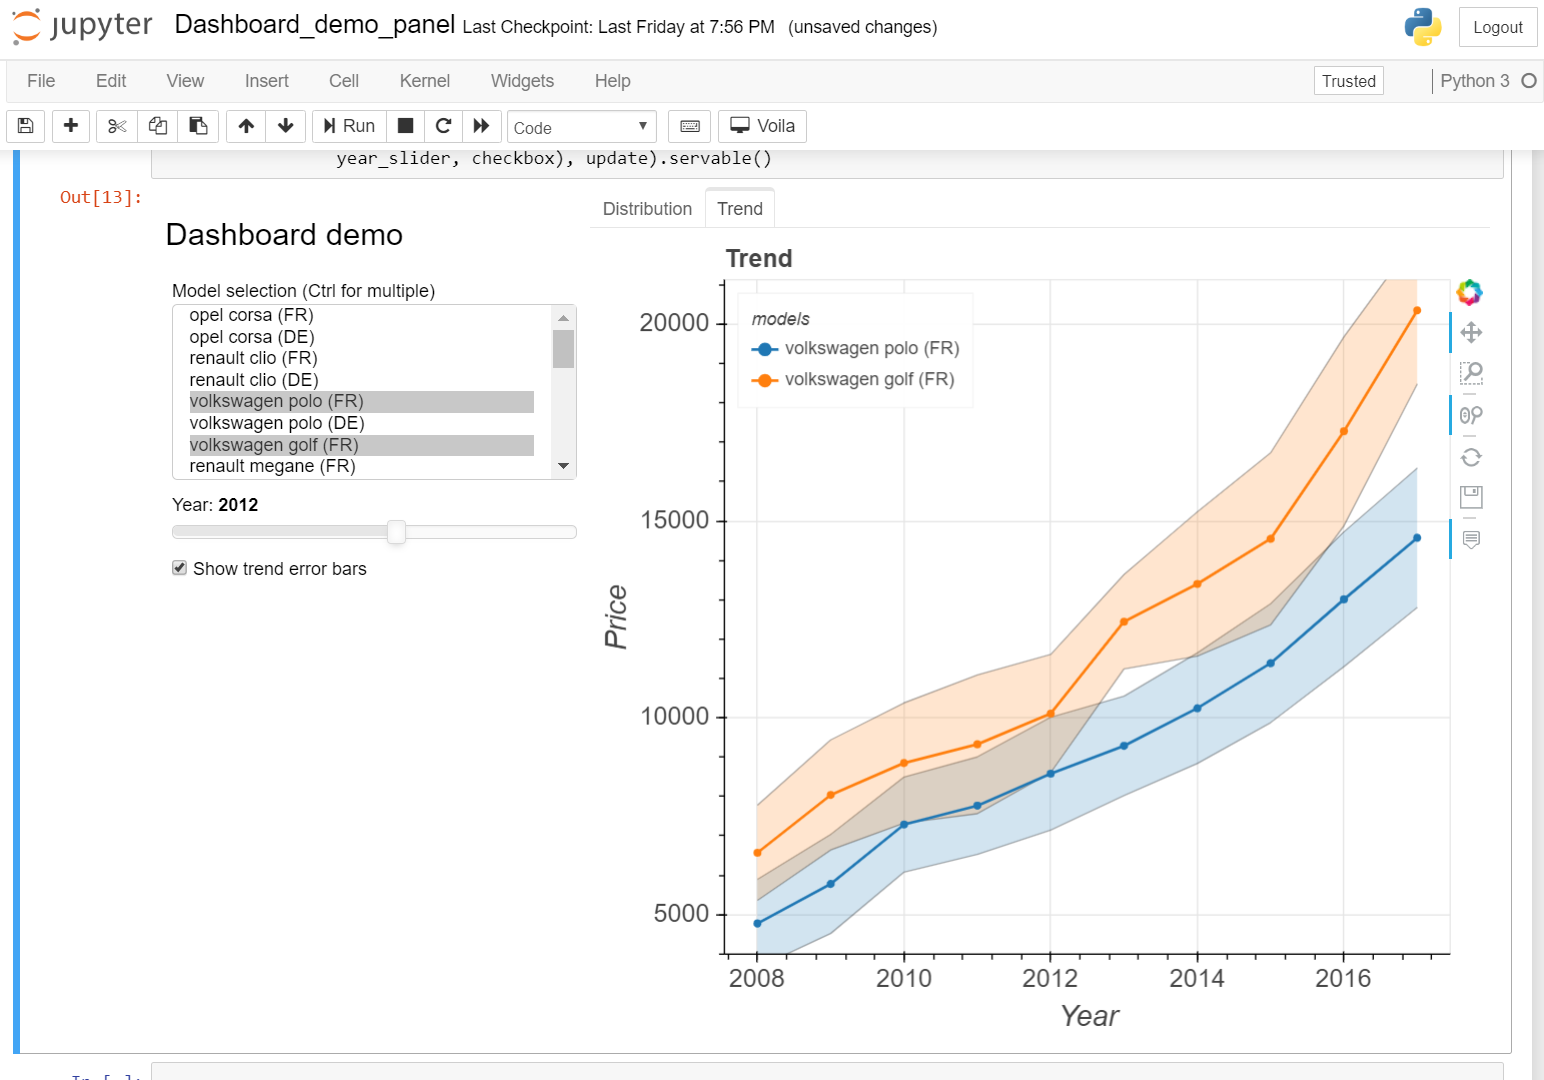
# declare panel widgets multi_select = pn.widgets.MultiSelect(name='Model selection (Ctrl for multiple)', value=['opel corsa (FR)', 'citroen c3 (FR)'], options=list(raw_data['model'].unique()), size=8) year_slider = pn.widgets.IntSlider( name='Year', start=2007, end=2016, step=1, value=2012) checkbox = pn.widgets.Checkbox(name='Show trend error bars')
Next, we create a function that describes the interaction using the decorator.
@pn.depends(multi_select.param.value, year_slider.param.value, checkbox.param.value) def update(models, year, checkbox_status):
Widgets allow you to select a list of models, select a year to view the distribution of offers by price, and also show / hide the standard deviation of the price from the average for the year on a trend chart.
Inside the interaction, we create our chart blanks, then for all selected elements we make statistics, create graph elements (lines, markers, error statistics),
put everything together and return the graphs as two tabs for compact display.
return pn.Tabs(('Distribution', bokehdist), ('Trend', bokehfig))
Next, we create our layout by placing widgets and tabs with graphs in it.
The process pleases with its oak simplicity and flexibility, due to a simple tabular presentation.
pn.Row(pn.Column('### Dashboard demo', multi_select, year_slider, checkbox), update).servable()
The servable () method makes our dashboard available for the panel server to run
independently from the command line changing server settings. If we continue to work with notepad, then all interactive functionality is available to us in it. To test how the application will look like for an external user, add the show () method. On this, all our additional efforts are over, and they are not significantly different from just building graphs.
This is what a dashboard looks like in a notebook.
If we want to make the dashboard accessible from outside the localhost, we must be allowed to serve requests from the outside, with careful whitelisting or with a wide gesture like
panel serve Dashboard_demo_panel.ipynb --allow-websocket-origin=*
The application that the analyst will see is no different from that in the notebook
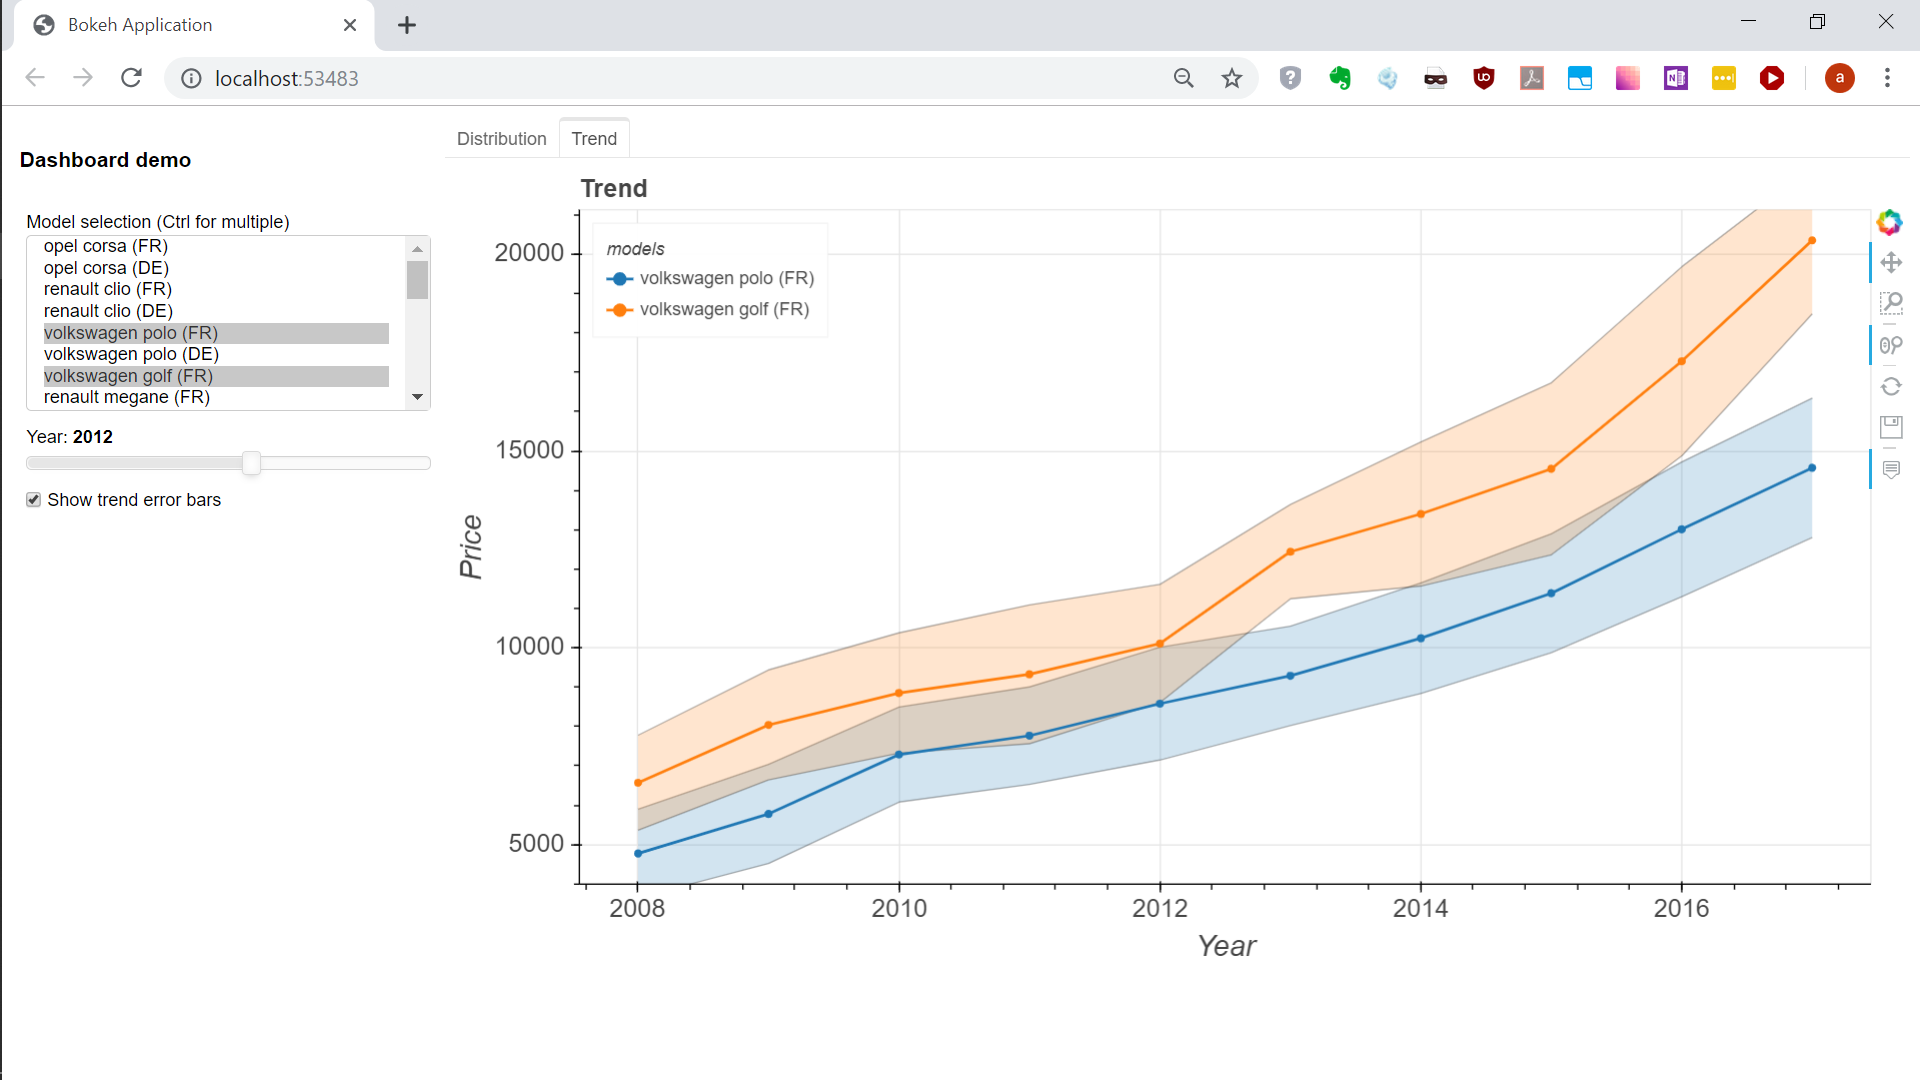
The authors say that it will not allow third-party code to be executed, but the degree of protection at a recent webinar was said to be somewhat evasive. To share with analysts - that's enough, there is no need for such things collected on the knee to stick out.
Finally, we compare how to do the same using Voila.
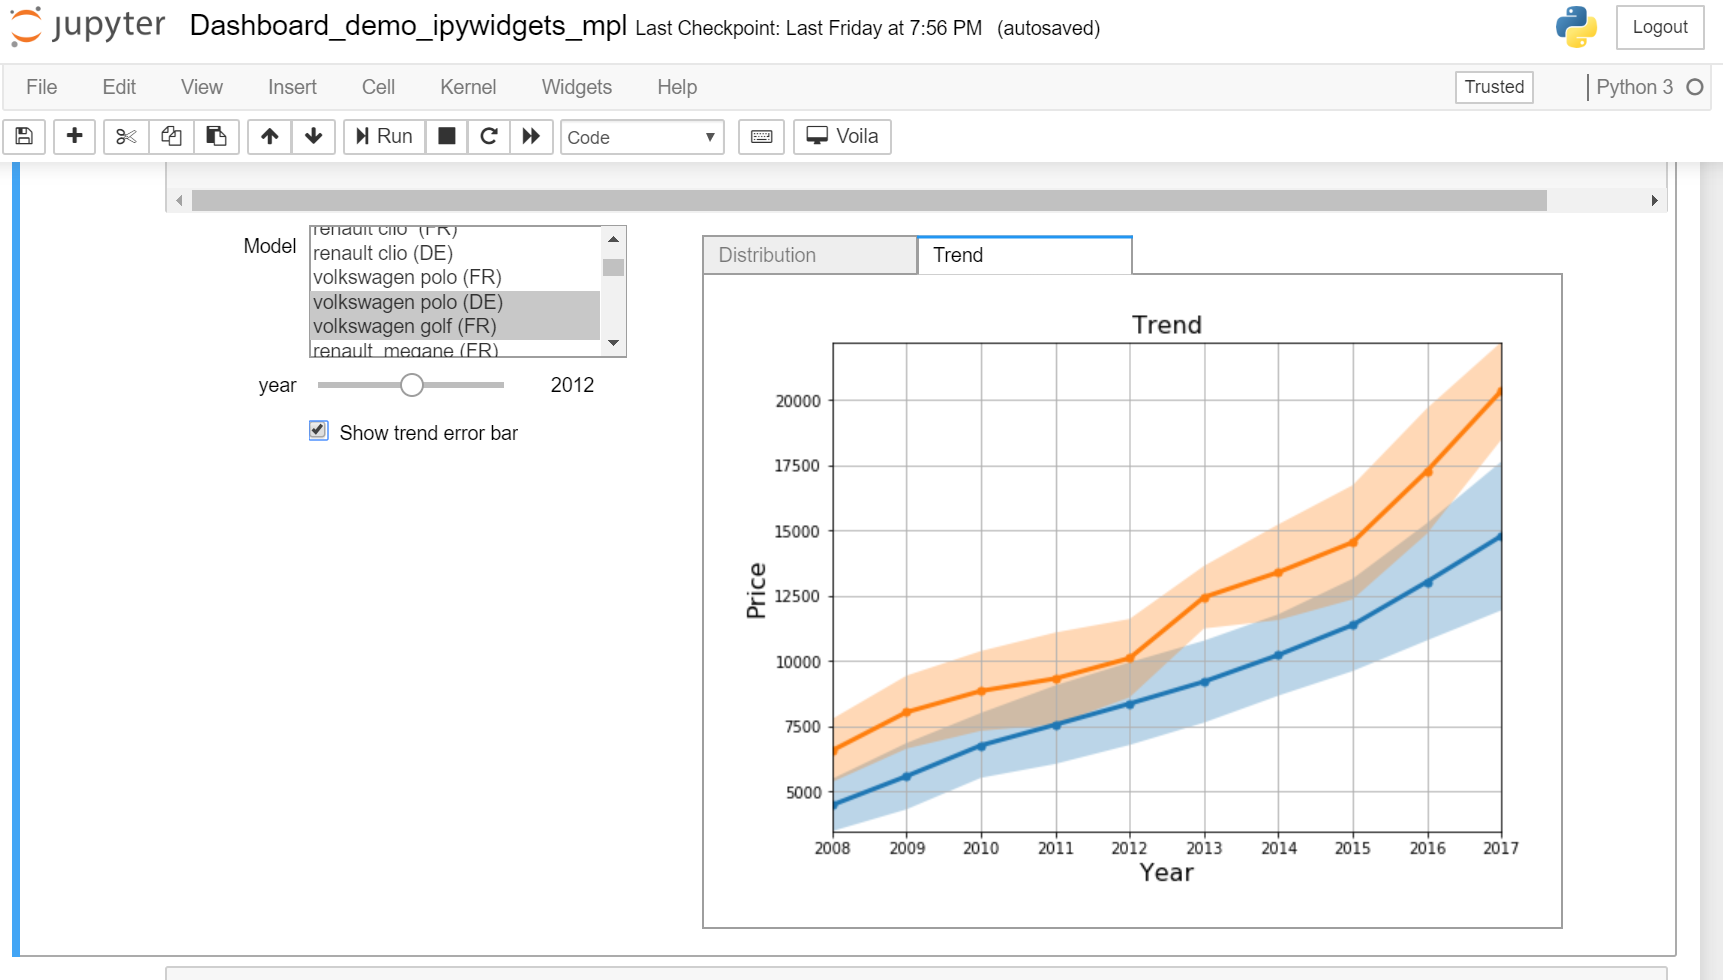
The version with ipywidgets and bokeh did not take off, cursing at javascript in the output.
Therefore, I saw it into matplotlib static charts.
To compile the same interface from ipywidgets with a drop-down list, a slider, a checkbox and two tabs required some effort and crutches, lacked the same table flexibility. The body of the main function had to be sawn off in order to pull the graphs across tabs, that is, the notebook had to be adjusted much more than in the first case.
To start the web application with the extension installed for Jupyter, one click is enough. The picture is quite similar. From the difference in functionality - the used Interactive widget does not calculate the function by default, therefore the graphs appear only after the first interaction with the user.
Personally, according to my feelings - Panel clearly won in terms of usability. The same result was obtained for a much smaller number of actions and additional efforts to add it to the notebook are minimal. So everything is friendly and joyfully moving to the panel!
All Articles