10 little-known features of the Chrome Developer Tools
The author of the post we are translating uses the Chrome developer tools almost every day. Here he wants to talk about the little-known features of these tools. He says that if he knew about them before, they would definitely be useful to him.

Chrome developer tools allow you to get a link to any element under investigation in the console. To do this, working in the
panel, right-click on an element and select
from the drop-down menu.
A simple way to get a link to any element under investigation
In the developer’s tools, you can create interactive expressions attached to the top of the console, the values of which are constantly kept up to date. The procedure for creating such expressions is shown in the following figure. If you know that certain elements on the page should be updated, this feature can be very useful for observing them.
Interactive Expressions in Chrome
The
tab of the Chrome Developer Tools allows you to simulate a browser connection to various networks. This feature can be extremely useful in order to evaluate the behavior of a page in a situation where it takes several seconds to load.
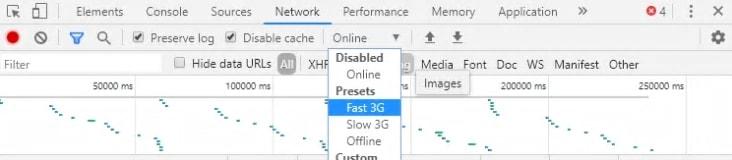
Exploring a page simulating various ways to connect to the Internet
I had to face many problems that, as it turned out, were not mistakes. Their cause was incorrect loading of cached code. In order to get rid of such troubles, you can completely disable caching using the capabilities of the
tab. This is a
checkbox. Please note that the cache does not work only when the developer toolbar is open.
Saving logs is another useful feature due to which the console is not cleared when the page under investigation is reloaded. Enables this feature by checking the
checkbox on the
tab.

Disabling the cache and saving logs
Chrome Developer Tools includes a built-in screenshot tool. In order to use it, you need, with the tool window open, apply the key combination
, and then enter the keyword
in the field that appears and select the desired method of creating a screenshot.
Creating a screenshot from the developer toolbar
Everyone uses the
command to log debugging data. However, this command does not exhaust logging capabilities. In particular, the
and
commands are at the disposal of the developer.
These commands display messages of different levels of logging to the console - these are, respectively, warnings and error messages. They are highlighted in different colors and icons. Messages displayed in the console by different commands can be filtered.
Console.warn () and console.error ()
You can use the
command to display some structured data conveniently formatted in a table format.
Command console.table ()
The possibilities for working with the console are not limited to these commands. For example, there are such commands as
and
. Here you can find a detailed story about such teams.
The
construct can be used to return the value of a previous operation performed in the console.

Using the $ _ construct
You can use the
command in the console to quickly select an item. The features of jQuery here, by the way, are not applied, although at first glance it might seem that this is not so.
Similarly, the
command is a shorthand for
.

Using $ ()
If during the study of an element it is necessary to study its behavior in the
state, this can be a daunting task, since in order to translate an element into this state, it would be necessary to have a mouse pointer over it. The solution to this problem can be facilitated by using the capabilities of the
panel. Here you can force elements to be transferred to states such as
or
.
Force item to state
Have you ever needed to know where a CSS rule is described? This task is very easy to solve by pressing the
key and clicking on the rule of interest to you. MacOS uses
instead of
.
Ctrl + click - search for CSS rule definition location
Dear readers! What would you add to the list of little-known features of the Chrome developer tools here?


1. A simple way to get a link to any element under study
Chrome developer tools allow you to get a link to any element under investigation in the console. To do this, working in the
Elements
panel, right-click on an element and select
Store as global variable
from the drop-down menu.
A simple way to get a link to any element under investigation
2. Creating interactive expressions attached to the console
In the developer’s tools, you can create interactive expressions attached to the top of the console, the values of which are constantly kept up to date. The procedure for creating such expressions is shown in the following figure. If you know that certain elements on the page should be updated, this feature can be very useful for observing them.
Interactive Expressions in Chrome
3. Simulate slow internet connections
The
Network
tab of the Chrome Developer Tools allows you to simulate a browser connection to various networks. This feature can be extremely useful in order to evaluate the behavior of a page in a situation where it takes several seconds to load.
Exploring a page simulating various ways to connect to the Internet
4. Disabling the cache, saving logs when switching between pages
I had to face many problems that, as it turned out, were not mistakes. Their cause was incorrect loading of cached code. In order to get rid of such troubles, you can completely disable caching using the capabilities of the
Network
tab. This is a
Disable cache
checkbox. Please note that the cache does not work only when the developer toolbar is open.
Saving logs is another useful feature due to which the console is not cleared when the page under investigation is reloaded. Enables this feature by checking the
Preserve log
checkbox on the
Network
tab.
Disabling the cache and saving logs
5. Making screenshots
Chrome Developer Tools includes a built-in screenshot tool. In order to use it, you need, with the tool window open, apply the key combination
Ctrl+Shift+P
, and then enter the keyword
screenshot
in the field that appears and select the desired method of creating a screenshot.
Creating a screenshot from the developer toolbar
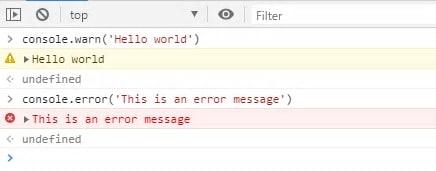
6. The console.log () command is far from the only way to log something to the console
Everyone uses the
console.log()
command to log debugging data. However, this command does not exhaust logging capabilities. In particular, the
console.warn()
and
console.error()
commands are at the disposal of the developer.
These commands display messages of different levels of logging to the console - these are, respectively, warnings and error messages. They are highlighted in different colors and icons. Messages displayed in the console by different commands can be filtered.
Console.warn () and console.error ()
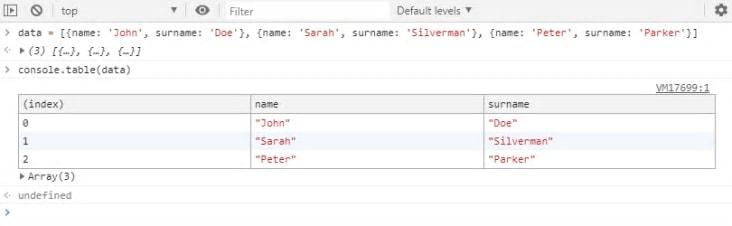
You can use the
console.table()
command to display some structured data conveniently formatted in a table format.
Command console.table ()
The possibilities for working with the console are not limited to these commands. For example, there are such commands as
console.assert()
and
console.group()
. Here you can find a detailed story about such teams.
7. The $ _ construct returns the most recent computed expression
The
$_
construct can be used to return the value of a previous operation performed in the console.
Using the $ _ construct
8. The $ () command is a shorthand for document.querySelector ()
You can use the
$()
command in the console to quickly select an item. The features of jQuery here, by the way, are not applied, although at first glance it might seem that this is not so.
Similarly, the
$$()
command is a shorthand for
document.querySelectorAll()
.
Using $ ()
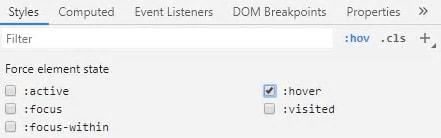
9. Enabling element states, such as hover or focus, in the Styles panel
If during the study of an element it is necessary to study its behavior in the
hover
state, this can be a daunting task, since in order to translate an element into this state, it would be necessary to have a mouse pointer over it. The solution to this problem can be facilitated by using the capabilities of the
Styles
panel. Here you can force elements to be transferred to states such as
hover
or
focus
.
Force item to state
10. The combination of pressing the Ctrl key and clicking the mouse helps to find the definition of the CSS rule
Have you ever needed to know where a CSS rule is described? This task is very easy to solve by pressing the
Ctrl
key and clicking on the rule of interest to you. MacOS uses
Cmd
instead of
Ctrl
.
Ctrl + click - search for CSS rule definition location
Dear readers! What would you add to the list of little-known features of the Chrome developer tools here?
All Articles