How to collect metrics not distorted by time reference with Prometheus

Many network applications consist of a web server that processes real-time traffic and an additional handler that runs in the background asynchronously. There are many great tips for checking the status of traffic, and the community does not stop developing tools like Prometheus that help in evaluating. But handlers are sometimes no less - and even more - important. They also need attention and evaluation, but there is little guidance on how to do this while avoiding common pitfalls.
This article is devoted to the traps that are most common in the process of evaluating asynchronous handlers, using an example of an incident in a production environment where, even with metrics, it was impossible to determine exactly what the handlers were doing. The use of metrics has shifted the focus so much that the metrics themselves openly lied, they say, your handlers to hell.
We will see how to use metrics in such a way as to provide an accurate estimate, and in the end we will show the reference implementation of the open source prometheus-client-tracer , which you can use in your applications.
Incident
Alerts arrived at a machine-gun speed: the number of HTTP errors increased sharply, and the control panels confirmed that the request queues were growing, and the response time was running out. About 2 minutes later, the queues were cleared, and everything returned to normal.
Upon closer inspection, it turned out that our API servers stood up, waiting for a DB response, which caused it to stall and suddenly get up all the activity. And when you consider that the heaviest load falls more often on the level of asynchronous processors, they have become the main suspects. The logical question was: what are they doing there at all ?!
The Prometheus metric shows what the process takes time, here it is:
# HELP job_worked_seconds_total Sum of the time spent processing each job class # TYPE job_worked_seconds_total counter job_worked_seconds_total{job}
By tracking the total execution time of each task and the frequency with which the metric changes, we will find out how much work time has been spent. If for a period of 15 seconds. the number increased by 15, this implies 1 busy handler (one second for each past second), while an increase of 30 means 2 handlers, etc.
The work schedule during the incident will show what we are faced with. The results are disappointing; the time of the incident (16: 02–16: 04) is marked by the alarming red line:

Handler activity during the incident: a noticeable gap is visible.
As a person who debugged after this nightmare, it hurt me to see that the activity curve was at the very bottom just during the incident. This is the time for working with web hooks, in which we have 20 dedicated handlers. From the logs, I know that they were all in business, and I expected the curve to be at about 20 seconds, and I saw an almost straight line. Moreover, see this big blue peak at 16:05? Judging by the schedule, 20 single-threaded processors took 45 seconds. for every second of activity, but is this possible ?!
Where and what went wrong?
The schedule of the incident is lying: it hides the working activity and at the same time shows the superfluous - depending on where to measure. To find out why this happens, you need to take into account the implementation of metrics tracking and how it interacts with Prometheus collecting metrics.
Starting with how handlers collect metrics, you can sketch out an approximate workflow implementation scheme (see below). Note: handlers only update metrics upon completion of a task .
class Worker JobWorkedSecondsTotal = Prometheus::Client::Counter.new(...) def work job = acquire_job start = Time.monotonic_now job.run ensure # run after our main method block duration = Time.monotonic_now - start JobWorkedSecondsTotal.increment(by: duration, labels: { job: job.class }) end end
Prometheus (with its philosophy of extracting metrics) sends a GET request to each handler every 15 seconds, recording the values of the metrics at the time of the request. Handlers constantly update the metrics of completed tasks, and over time we can graphically display the dynamics of changes in values.
The problem with under- and revaluation begins to appear whenever the time it takes to complete a task exceeds the waiting time for a request that arrives every 15 seconds. For example, a task starts 5 seconds before the request and ends 1 second after. Entirely and generally, it lasts 6 seconds, but this time is visible only when estimating the time costs made after the request, while 5 of these 6 seconds are spent before the request.
The indicators lie even more godless if the tasks take longer than the reporting period (15 seconds). During the execution of the task for 1 minute, Prometheus will have time to send 4 requests to the processors, but the metric will be updated only after the fourth.
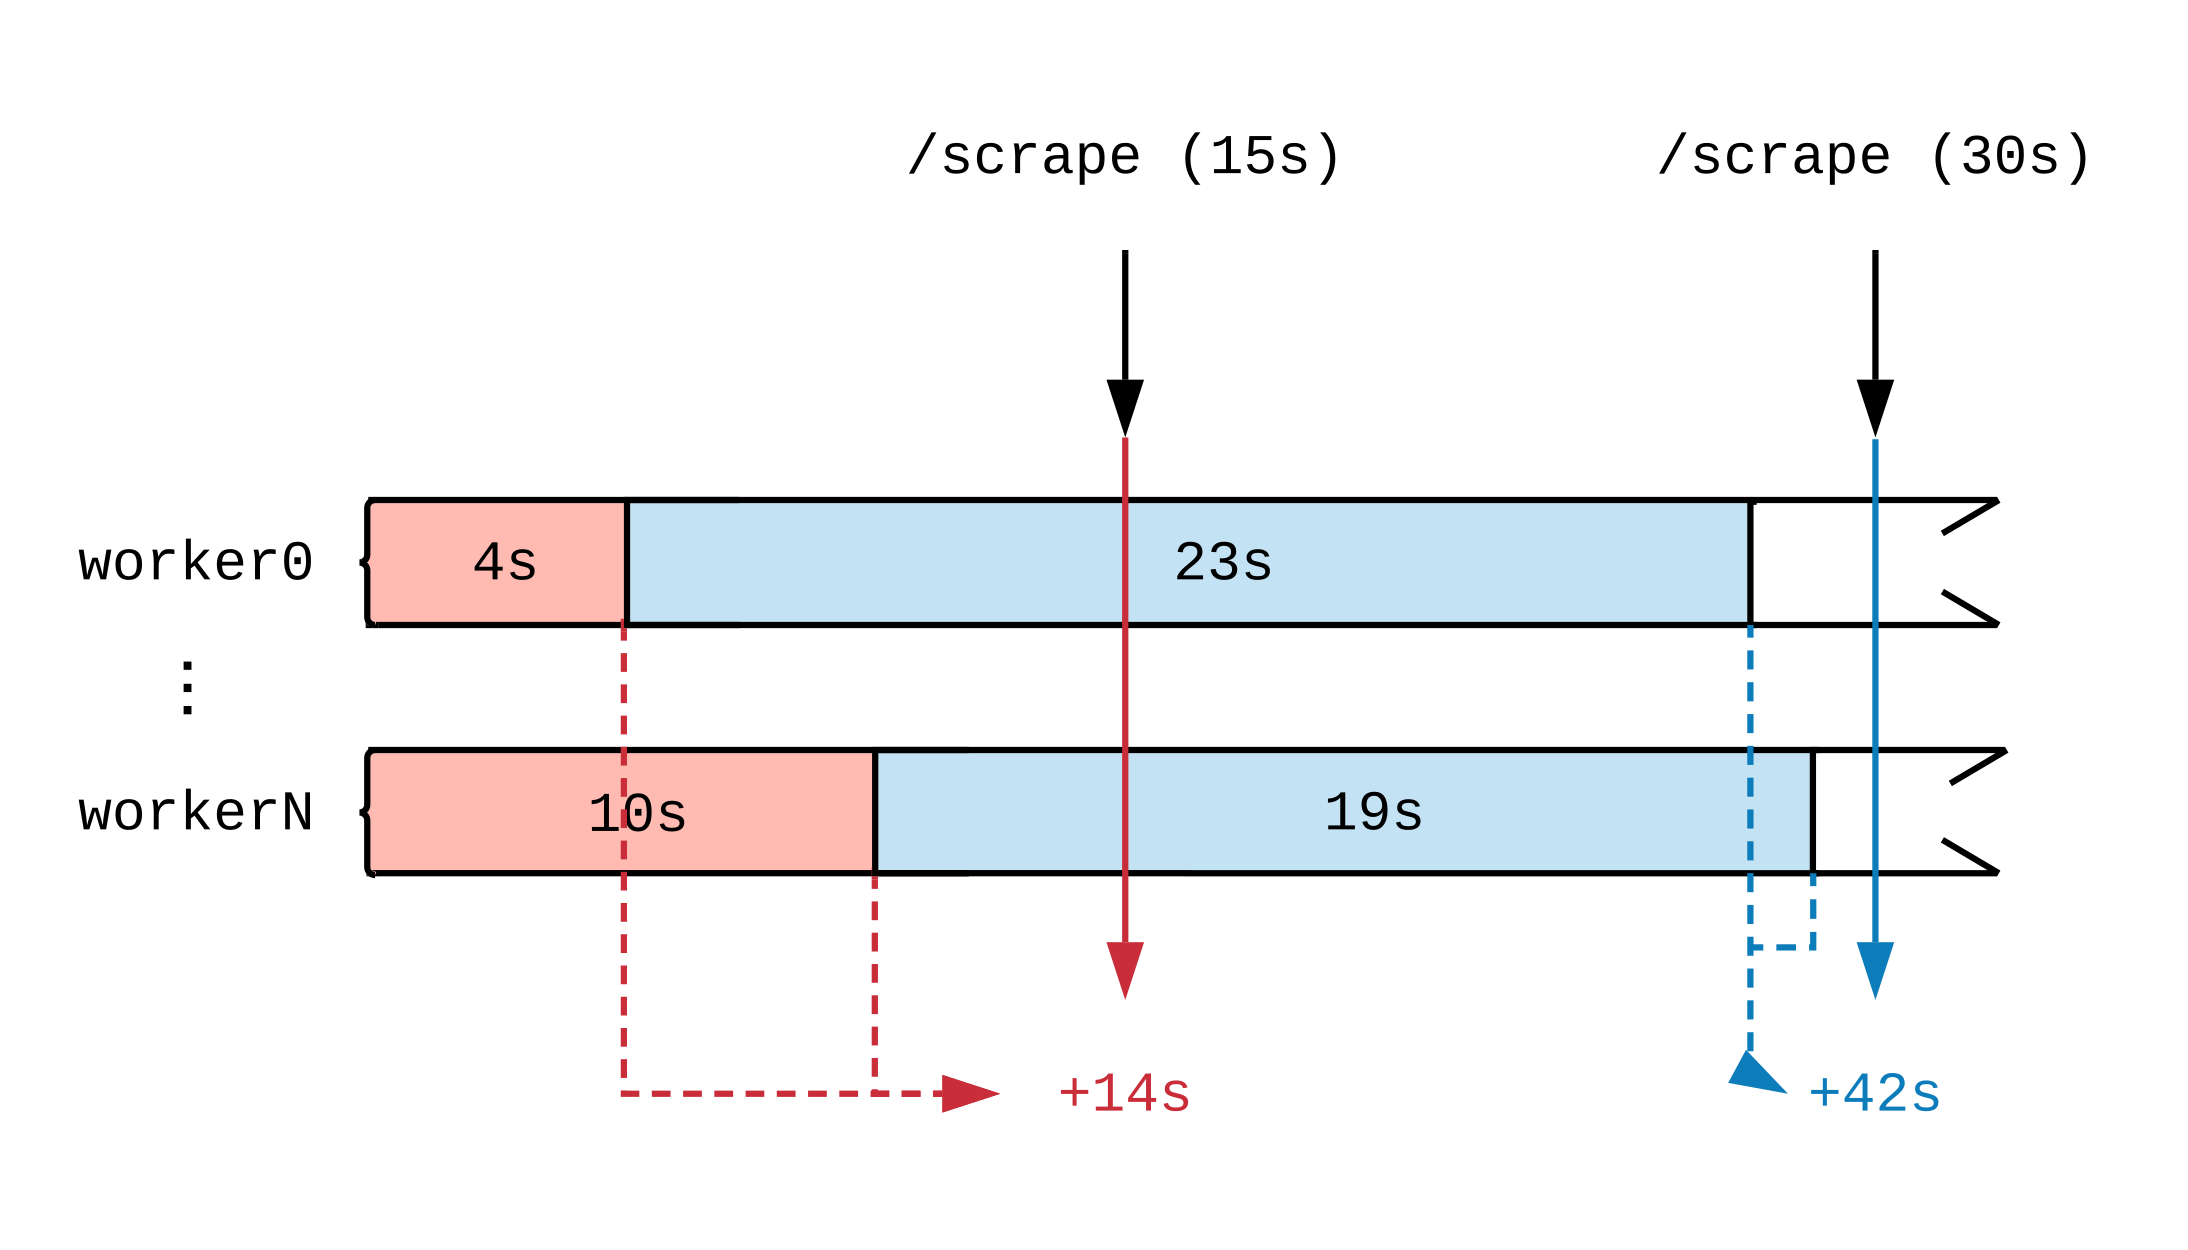
Having drawn a timeline of working activity, we will see how the moment the metric is updated affects what Prometheus sees. In the diagram below, we break the timeline of two handlers into several segments that display tasks of different durations. Red (15 seconds) and blue (30 seconds) tags indicate 2 Prometheus data samples; The tasks that served as the data source for the assessment are highlighted accordingly.

Regardless of what the handlers are doing at full load, they will do 30 seconds of work every 15-second interval. Since Prometheus does not see the work until it is completed, judging by the metrics, 14 seconds of work were completed in the first time interval and 42 seconds in the second. If each handler takes up a voluminous task, then even after a few hours, until the very end, we will not see reports that the work is going on.
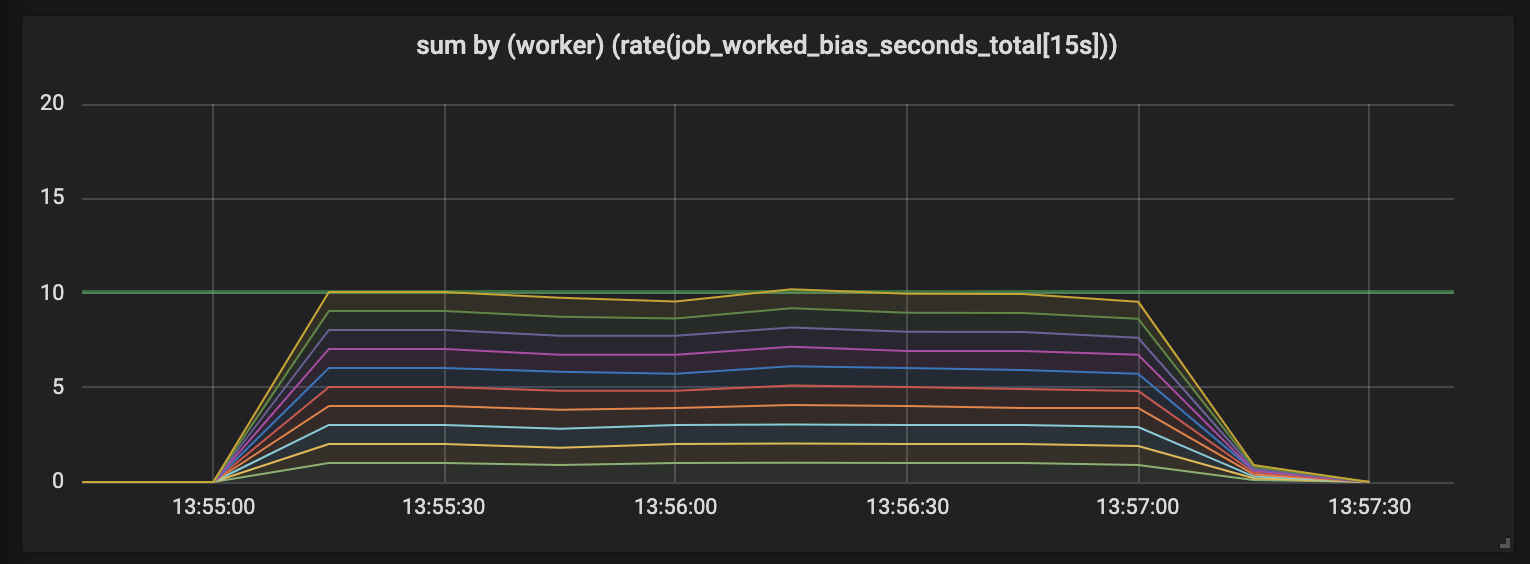
To demonstrate this effect, I conducted an experiment with ten handlers engaged in tasks whose length is different and semi-normal distributed between 0.1 seconds and a slightly higher value (see random tasks ). Below are 3 graphs depicting working activity; length in time is shown in increasing order.

Tasks lasting up to 1 second.
The first graph shows that each handler fulfills about 1 second of work in every second of time - this is visible on flat lines, and the total amount of work is equal to our capabilities (10 handlers give out a second of work per second of time). Actually, this, regardless of the length of the task, we are expecting: just so much on short and long tasks, processors with constant load should give out.

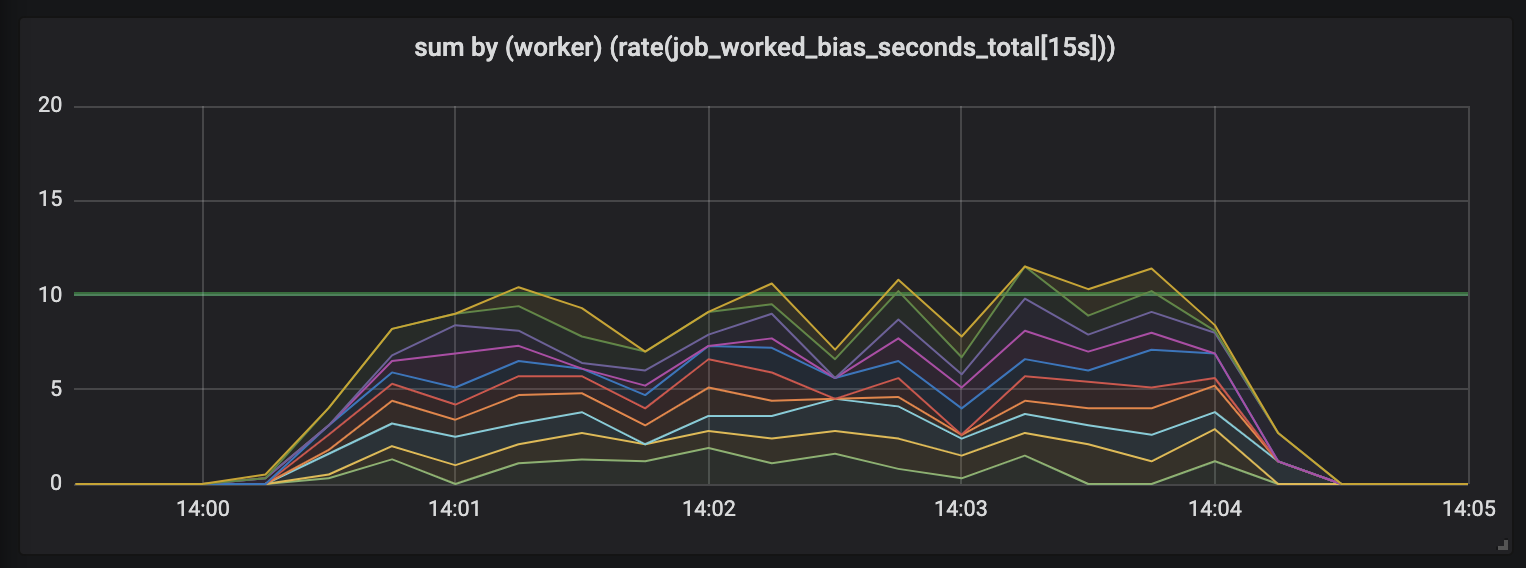
Tasks lasting up to 15 seconds.
The duration of the tasks grows, and a mess appears in the schedule: we still have 10 processors, all of them are fully occupied, but the total amount of work skips - either lower or higher than the useful capacity border (10 seconds).

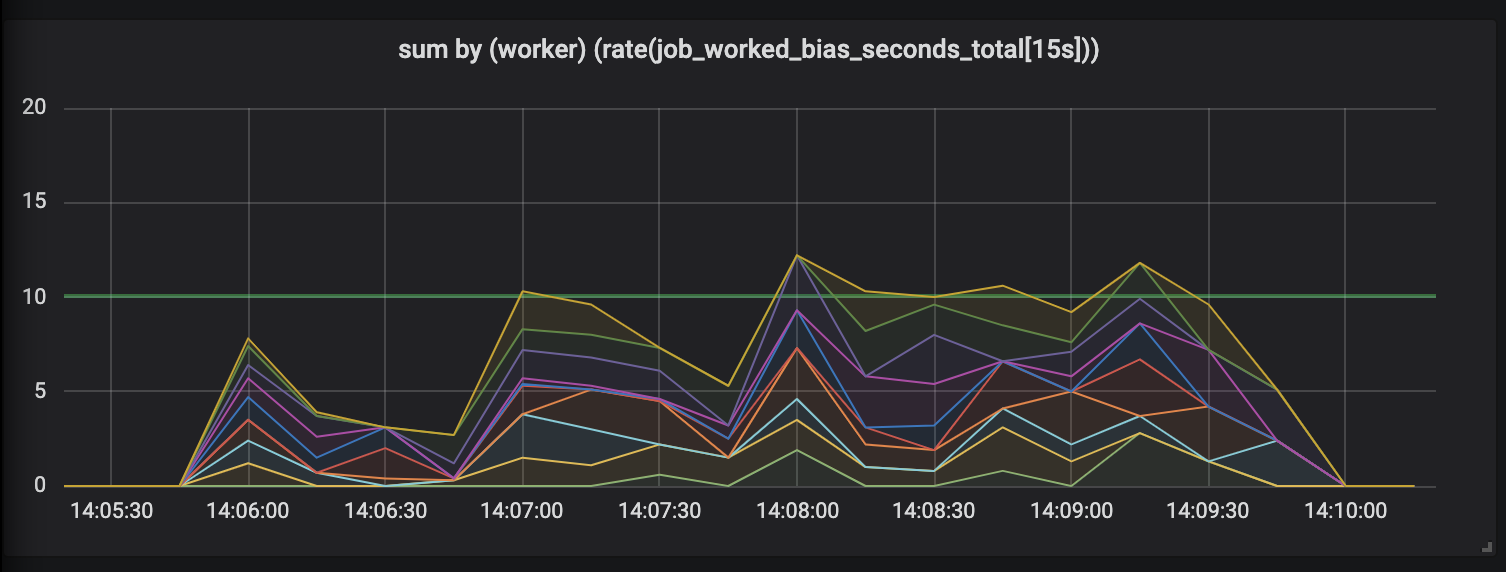
Tasks lasting up to 30 seconds.
Evaluation of works lasting up to 30 seconds is simply ridiculous. A time-bound metric shows zero activity for the longest tasks and, only when the tasks are completed, draws us activity peaks.
Restore Trust
This was not enough for us, so there is another, much more insidious problem with these long-term tasks that spoil our metrics. Whenever a long-term task is completed - say, if Kubernetes throws a pod out of a pool, or when a node dies - then what happens to metrics? It is worth updating them immediately upon completion of the task, as they show that they did not do the work at all .
Metrics should not lie. The laptop howls incredulously, causing existential horror, and surveillance tools that distort the picture of the world are a trap and are unsuitable for work.
Fortunately, the matter is fixable. Data distortion occurs because Prometheus takes measurements regardless of when processors update metrics. If we ask the handlers to update the metrics when Prometheus sends requests, we will see that Prometheus is no longer quirky and shows the current activity.
Introducing ... Tracer
One solution to the distorted metrics problem is Tracer
abstractly designed one, which evaluates activity on long-running tasks by incrementally updating Prometheus related metrics.
class Tracer def trace(metric, labels, &block) ... end def collect(traces = @traces) ... end end
Tracers provide a tracing method that takes the Prometheus metrics and the task to track. The trace
command will execute the given block (anonymous Ruby functions) and will ensure that requests to tracer.collect
during execution will incrementally update related metrics no matter how much time has passed since the last request to collect
.
We need to connect the tracer
to the handlers in order to track the duration of the task and the endpoint serving Prometheus metric requests. We start with the handlers, initialize a new tracer and ask him to track the execution of acquire_job.run
.
class Worker def initialize @tracer = Tracer.new(self) end def work @tracer.trace(JobWorkedSecondsTotal, labels) { acquire_job.run } end # Tell the tracer to flush (incremental) trace progress to metrics def collect @tracer.collect end end
At this stage, tracer will only update the metrics in seconds spent on the completed task - as we did in the initial implementation of the metrics. We must ask tracer to update our metrics before we execute a request from Prometheus. This can be done by setting up the middleware Rack.
# config.ru # https://rack.github.io/ class WorkerCollector def initialize(@app, workers: @workers); end def call(env) workers.each(&:collect) @app.call(env) # call Prometheus::Exporter end end # Rack middleware DSL workers = start_workers # Array[Worker] # Run the collector before serving metrics use WorkerCollector, workers: workers use Prometheus::Middleware::Exporter
Rack is an interface for Ruby web servers that allows you to combine multiple Rack handlers into a single endpoint. The config.ru
command config.ru
determines that the Rack application — whenever it receives the request — sends the collect
command to the handlers first, and only then tells the Prometheus client to draw the collection results.
As for our chart, we update the metrics whenever the task completes or when we receive a request for metrics. Tasks involving several queries equally send data on all segments: as shown by tasks whose duration was divided into 15-second intervals.

Is it better?
Using tracer 24 hours a day affects how activity is logged. Unlike the initial measurements, which showed a “saw,” when the number of peaks exceeded the number of triggered processors and periods of dull silence, the experiment with ten processors provides a graph that clearly shows that each processor is put into the work being monitored evenly.

Metrics built on comparison (left) and controlled by tracer (right), taken from one working experiment.
Compared to the frankly inaccurate and chaotic schedule of the initial measurements, the metrics collected by the tracer are smooth and consistent. We now not only accurately tie the work to each metric request, but also do not worry about the sudden death of any of the handlers: Prometheus records the metrics until the handler disappears, evaluating all its work.
Can this be used?
Yes! The Tracer
interface turned out to be useful to me in many projects, so this is a separate Ruby gem, prometheus-client-tracer . If you use the Prometheus client in your Ruby applications, simply add the prometheus-client-tracer
to your Gemfile:
require "prometheus/client" require "prometheus/client/tracer" JobWorkedSecondsTotal = Prometheus::Client::Counter.new(...) Prometheus::Client.trace(JobWorkedSecondsTotal) do sleep(long_time) end
If this proves to be useful to you and if you want the official Prometheus Ruby client to appear in Tracer
, leave feedback in client_ruby # 135 .
And finally, some thoughts
I hope this helps others more consciously collect metrics for long-running tasks and solve one of the common problems. Make no mistake, it is associated not only with asynchronous processing: if your HTTP requests are slowed down, they will also benefit from using tracer when evaluating the time spent on processing.
As usual, any feedback and corrections are welcome: write to Twitter or open PR . If you want to contribute to tracer gem, the source code is on prometheus-client-tracer-ruby .
All Articles