Linux Profiling with Performance Analyzer
Linux Profiling with Performance Analyzer
Colleagues, I find it useful to talk about a convenient and free code profiler for Linux / Solaris. It is included in the Sun / Oracle Developer Studio package [1]. In my opinion, other parts of this development environment are somewhat useless, but the profiler called Performance Analyzer is very successful. It is easy to use, clearly and conveniently arranged analysis of the results. In my opinion, the profiler is still superior to many Linux counterparts. With this tool, using gprof seems like a weird whim and a waste of time.
If you do not plan to use Performance Analyzer immediately, then you can not read further. Just remember that such a product exists. If it’s interesting to take a look, then welcome.
The profiler consists of two parts: collect - launches the application and collects data, records the results of the experiment; analyzer is a graphical interface that reads experiment data and provides opportunities for convenient analysis of hot spots and function call trees.
Briefly about the important advantages and disadvantages:
Pros:
- free;
- does not require recompiling the code and linking the executable file;
- works with gnu and sun compilers;
- does not change the execution time of the program when collecting data;
- It has an intuitive graphical interface;
- Equipped with advanced command line interface for automatic analysis;
- allows you to quickly look at the result of the compiler;
- has a statistical profiler that is accurate enough even for not particularly laborious pieces;
- conveniently made analysis and comparative analysis of several program launches;
- does not distort the results.
Some cons:
- The graphic interface is written in Java. Sometimes it crashes on boot, a simple restart helps;
- only CPU time is measured; if it is possible to fix the kernel, then this restriction can be removed;
- in multi-threaded applications, the time taken by the function is the sum of the times spent in this function in each thread;
- the statistical profiler is noisy and makes it difficult to optimize cycles.
Platforms
Formally, Oracle Developer Studio only supports Solaris and Oracle Linux. De facto, I have successfully used it on Redhat, CentOS and Ubuntu. Collect / analyzer I used only to optimize C / C ++ / Fortran applications. The documentation states that the tool also handles Java projects.
Run and analyze results
Code analysis, of course, begins with building an executable file. Function names should not be deleted in it, otherwise there will be nothing to analyze. Debugging symbols are needed if you want to examine lines of code from analyzer. Of course, in the first place it makes sense to profile with your favorite optimization options. There are scenarios when it is useful to profile code without optimization, but this is rare. For example, if you just need to look at the call graph, and not measure performance.
So, to start you need, as usual, to collect the executable file, for example:
g++ -O3 –g example.c –o ex
The second step is to run from collect:
$pathToSunStudio/collect ./ex
As a result of the work of the profiler in the current directory, a sub-directory of the experiment test.N.er is created, where N is the start number. (Important: if your program was interrupted, the experiment directory will be broken).
The most enjoyable step is to launch the GUI:
$pathToSunStudio/analyzer test.1.er
In the case of our simple example, we’ll look at the code directly from the GUI analyzer. Our example calculates the sum of the natural and decimal logarithms of integers from 2 to 20,000,000. The "warm" lines are highlighted in yellow.
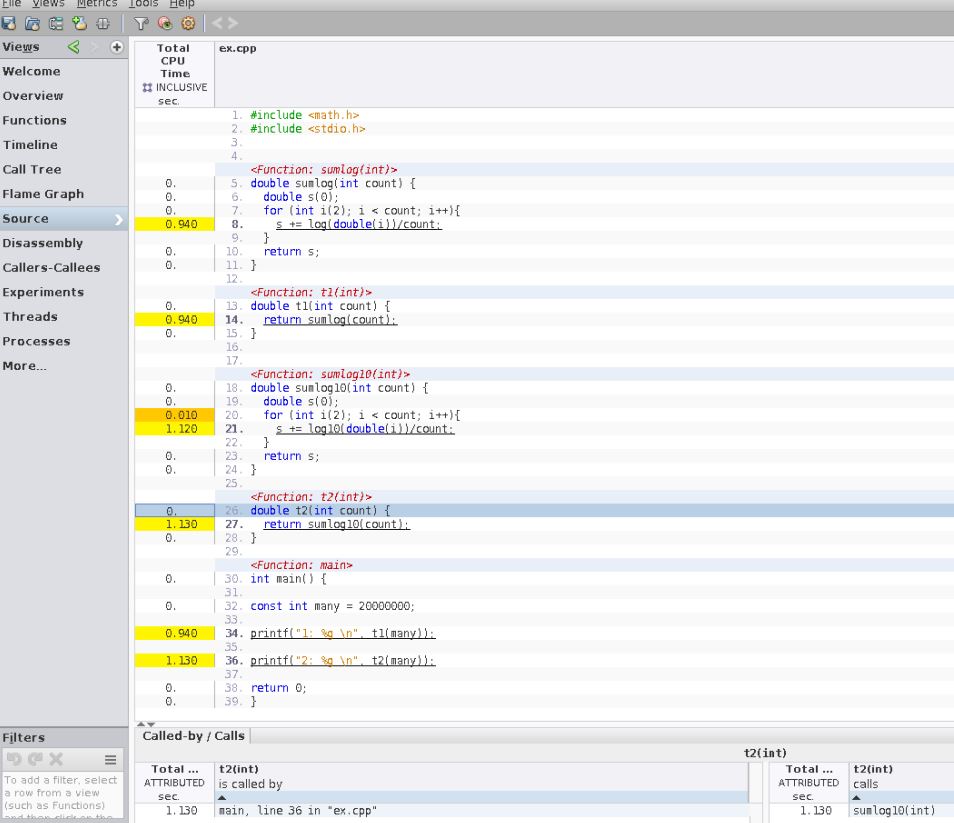
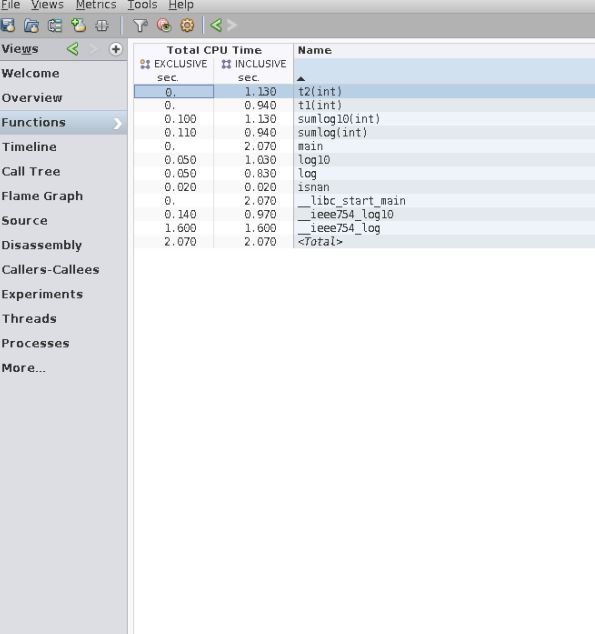
Let's move on to the list of "heavy functions". Initially, the functions are sorted by the time spent in the function itself (exclusive time). You can sort by the sum of time in the function and in its children (inclusive time).
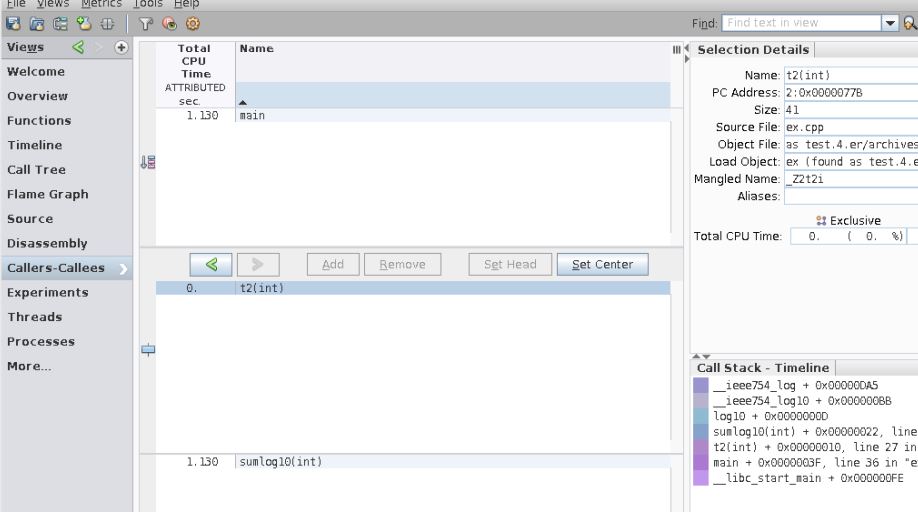
As expected, you can walk around the call stack. In our simple example, we see that in t1 () we came from main () , and the sumlog () function takes half the execution time of the entire program.
It is very convenient for automation that it is possible to pull data using the command line. For example:
er_print -functions test.1.er test.2.er
prints the run time of functions from two starts.
<p>Functions sorted by metric: Exclusive Total CPU Time Excl. Incl. Name Total Total CPU sec. CPU sec. 4.160 4.160 Total 3.140 3.140 __ieee754_log 0.330 1.990 __ieee754_log10 0.270 1.880 sumlog(int) 0.180 2.280 sumlog10(int) 0.100 1.610 log 0.090 2.100 log10 0.050 0.050 isnan</p> <ol> <li>4.160 __libc_start_main</li> <li>4.160 main</li> <li>1.880 t1(int)</li> <li>2.280 t2(int)
Lifehack. Carefully looking at the graph of program calls, you can find out a lot of useful work and the architecture of a new code base for you. I very often start working with a new project by launching Performance Analyzer, because you can immediately understand which code really runs and in which scenarios.
Conclusion
Sun / Oracle Studion Performance Analyzer is a powerful and convenient tool. In the note, I showed the simplest use case and, of course, Performance Analyzer can do much more. If you are interested in learning more, then refer to the documentation [2]. The main conclusion: such a tool exists and can be of great benefit to your projects.
References:
All Articles