Examples of game from the “come to rescue” orders (analysis of a dozen incidents with examples)
Sometimes it happens like this:
- Come, we have fallen. If you don’t raise it now, they’ll show it on TV.
And we are going. At night. To the other side of the country.
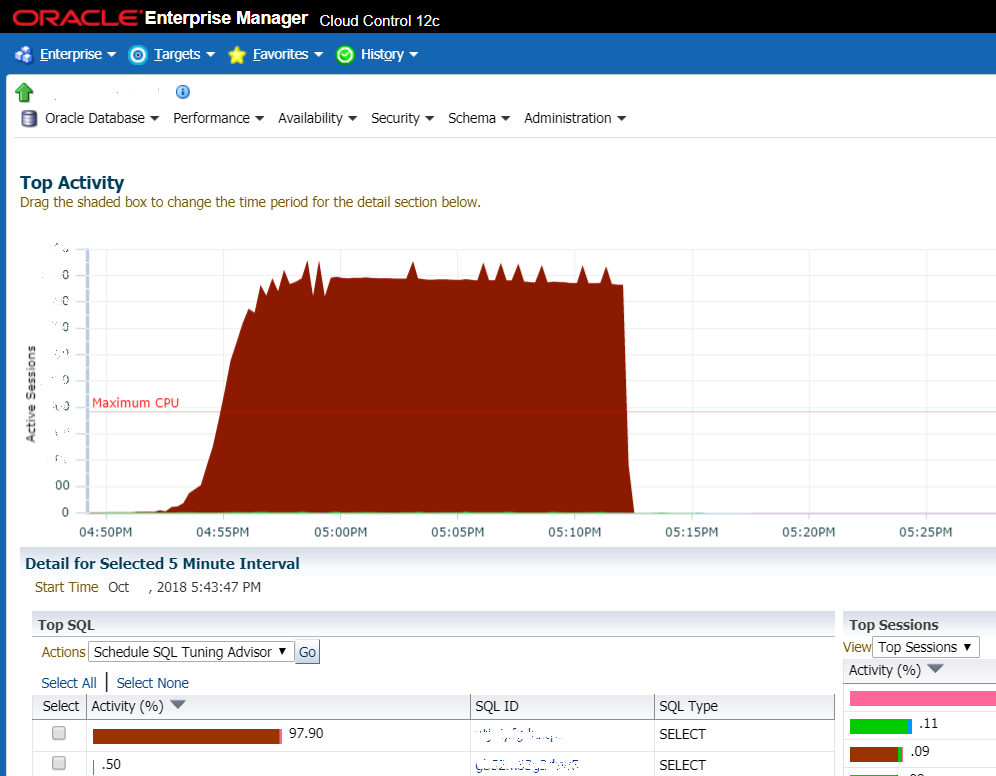
The situation when no luck: the graph shows a sharp increase in the load on the DBMS. Very often this is the first thing that system administrators look at and this is the first sign that an ass has come
But more often we are talking about some typical things. For example, a customer is faced with a poor workflow system. On Mondays and Tuesdays, the system crashed, they rebooted the server, and then everything went up. The database was choking. They wanted to buy equipment (which is long and expensive), they called us to calculate the estimate. We calculated their estimates and at the same time offered to figure out what exactly slows down. In three to four hours, the source of the problem was localized. We found out that these are slow database queries and suboptimal indexing schemes. We created the missing indexes, poked around with the query optimizer in Oracle, some problems required changing the code - we changed the search conditions (without changing the functionality), replaced some of the requests with the use of pre-calculated views. If they had a normal person in the database - they could do the same themselves. But instead of a normal person, the database was audited once every six months by cool oracleists - they issued general recommendations on settings and hardware.
Details are a little changed at the request of security. There is a document management system in hundreds of industrial facilities. She sometimes falls, and work rises. That is, objects can work, but not a single document passes and is not signed. And this, in particular, the shipment of raw materials, salaries and orders, what and how much to produce per shift. Every fall is a pain, tears, cognac for the CIO, because it’s hard for him: a lot of losses.
The director, by the way, is only six months old at this place after the past. And last year lasted. And both of them work on a system that the director introduced three generations ago. The second from the end tried to introduce his own, but did not have time before dismissal. The situation is very realistic.
At first glance, not enough performance. The load profile is locks (Wait Class “Application”). That is, competition for the lines. We begin to investigate the incident. A session is opened for each user transaction. It quickly goes into the state of blocking the order, according to which tasks and instructions for execution are written out, because the user must put a “Familiar” visa at a minimum.
The last case - they rolled up a new standard on how often employees should undergo a medical examination. The top-level personnel officer wrote an order and sent it to all organizations. That is, each employee of each production. Tens of thousands of users have received visa transactions. They began to open orders almost simultaneously, put a long chain of locks in the database. Due to not the most optimal code, a “small” overflow happened as a result, and everything was choked. About 40 thousand users do not work. Of the backup scheme - only phones and mail. Production does not stop, but efficiency drops very much, which causes specific financial losses. And then the calls begin from each enterprise to the IT director personally with a talk. In practice, they have an SLA, but there is no agreement yet. And the situation takes on the final features of purely Russian history.
The quick-fix problem was solved by profiling, analyzing the logic of blocking objects, eliminating unnecessary objects on which the lock was set, although it was not necessary because the object did not change (for example, directories, access rights, etc.). Then, in a couple of months, the main sections of the code were refactored.
In addition to standard tools (thread dumps, logs, metrics, AWR, data from system representations, etc.), we use more civilian tools, including commercial ones.
Example 1: Slow Transaction Log
Complaints from users have been received about the slow operation of the journal (a known and frequent problem).
We find the problem view, then we look for the request in the operations for the deal_journal_view view. We search for all transactions where there is such a request inside.

For each of the operations, you can look at its details and find the request itself with the execution parameters, which allows you to analyze the operation of the request, validate and adjust the plan. Found a specific slow request.

They themselves analyzed and proposed optimization options. And only then, to track this group of business operations (view the transaction log), create a Transaction Type and configure alerts.

Example 2: finding the reasons for the slow user 1
User 1 received complaints about the slow operation of the application. We look:

All user operations were searched and sorted by duration. Next, the slowest operations were analyzed, and slow queries to the external system (SAP) were detected.

Pointed it to the adjacent team, fixed it.
Example 3: another user complains about the slow operation of the application
We look in the same way. This time we see a large number of calls to an external signing service. It turned out, under certain conditions, they signed some documents twice. Corrected.

Example 4: when there is not enough detail
Sometimes, to analyze more complex parts of the code, we resort to the use of custom profilers, which allow us to study the behavior of the application more deeply. For example, like here: a lot of incomprehensible logic during the operation of the logic in the system. We figured out the logic, added a couple of caches, optimized requests.

Example 5: more brakes
The user complained about the slow work with the contract cards.

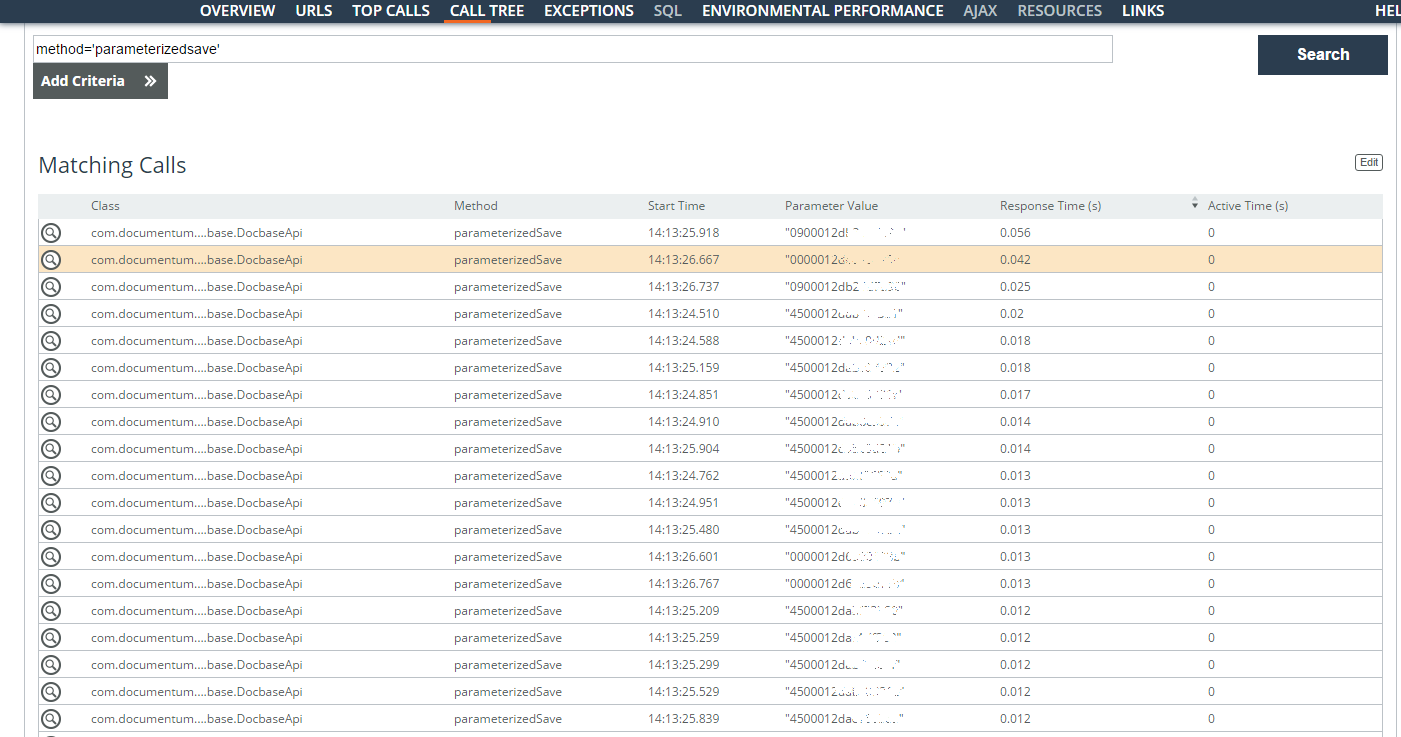
The slow user operations (parameter = 'userlogin = ”...”') for one week are analyzed. Most of the problems were with search queries under contracts, but operations with a document card were also found. Most of the time is spent on creating a large number of tasks on assignments. Identifiers were found (the Parameter Value column in the screenshot) of the stored tasks and the time they were saved.
Logically, when they can be created asynchronously, but now they are queued and require exceptional locks. Here you already need to delve deeper into the architecture.
No.
And again no.
This is all a treatment for the symptoms.
It’s right to quickly save the situation, which is now on fire. And then put the processes. It’s rare when people who work with the system do not understand what they are doing. It’s just that they either need to justify the means to reduce technical debt (and no one believes them), or change the processes to more modern ones (for which there are no resources either), or do something else like that.
In general, we come from the top level and see pain at the customer. Next we catch the bottleneck. Sometimes it ends with the introduction of a monitoring system. And if the customer understands that it is necessary to change the processes of software development, then the stage begins "long, expensive and not even at all awesome."
We look at two or three projects, pick all the documents, repositories, interview people. Next, we prepare templates for new documents, prepare procedures, look at tools for managing requirements, testing. And we help to implement. Sometimes it’s enough just to give an opinion on what to change, and the winged CIO with paper gets a budget. Sometimes it is necessary to directly inject with blood and tears.
Anything can turn out to be a pain, starting from the wrong choice of architecture to some features of the workflow. These examples are about game in processes in different companies around the country.
Regarding database optimization, here is a typical example. There is a medical system (one of those who fell). They called us to watch. We arrived when they had already disabled all the modules, except for the workflow of doctors, so that at least somehow the analyzes would go and the record through the registry would be. Online recording, in particular, was among the disabled modules. I managed to fix everything in one week. Initially, the customer thought that the problems were on the application layer: there were time-out failures, stuck threads. We found out that the problem is with the database. There was a complex structure, a bunch of sectioning by day and month. It turned out that they forgot about a couple of indexes, the developers did not fully know what it would turn into over time - and here is the result. Approximately the same set of operations plus search restrictions (when you need to unload something in a date range, it would be nice to look between these dates, and not across the entire database).
It is clear that such optimization does not always solve the problem. For example, (by architecture) the energy sector: the customer asks to see what the system is hanging with. And there everything flew upon delivery, but after a couple of years there were much more documents, and everything braked nicely. The customer sat with a stopwatch at the operator’s workplace and said: this operation now takes 31 seconds, we want 3. This one is 40 seconds, we want 2. And so on. It is clear that measuring this way is not very correct, but the task is quite specific and can be easily presented in the form of objective criteria. Not everything was done, it took about six months to “clean”. For the most part, the logic was transferred to asynchronous execution, some of the databases were changed to noSQL, the Solar search engine was installed, in one section it was necessary to select the hottest database and make it in-memory. As a result, about 90% of the needs were closed, but in some places they could not reduce the delays. This is the work of third-party libraries, the physical limitations of the platform, and so on. All this was monitored by monitoring and were able to clearly prove exactly where and what slows down.
We use different monitoring software to quickly find inhibitory processes and optimize them. The IT team of one of the major customers looked at how we do this, and asked to implement it at one of the facilities as a permanent tool. OK, we monitored all processes and nodes, customized their system for tasks, worked for almost four months, but made a set of tools to support them. And there are 80 thousand users, there are the first and second lines inside and the third often - with contractors or also inside.
On the second line is just this set of tools. Now in about 50% of cases they use monitoring to diagnose, search for bottlenecks and causes of freezes, so that their own developers can see, understand and optimize. A lot of support time is saved by quickly identifying the cause of the problem. After the pilot scaled by transaction. That is what took four months: there is a business operation for any action. Opening a document card is a business transaction. Signing in a workflow system is a business transaction. Report upload or search, too. 1,500 such business operations in four months are described to understand where and what works. Monitoring before this saw http-calls and sees called methods and functions, sees specific requests. Prior to this, only the developers understood that this was agreement agreement or search. In order for the monitoring system to show relevant data for different support lines and for business, we have set up all these bundles.

The business also began to cut reports on IT development on its own. More on the logs there no one picks especially.
By the way, about everything why APM class systems are needed at all, and how to choose them, we will talk at a webinar on October 1 .
A couple more examples. A large foreign bank with representative offices in Russia. We support Oracle DB and Oracle Weblogic. A gradual decrease in productivity was observed in the system, business operations were performed more slowly, the work of the operator became less and less efficient, and during the periods of imports and synchronization with the NSI everything was completely freezing. In such cases, we use standard Java and Oracle tools to collect data: we collect thread dumps, analyze them in free services or use self-written analysis tools, look at AWR, trace the execution of SQL queries, analyze plans and execution statistics. As a result, in addition to standard things, such as optimizing the composition of indices, adjusting query plans, we proposed introducing partitioning by dividing the data. It turned out two segments: historical (left them on the HDD) and operational - placed on the SSD. Prior to this, it was quite difficult to understand what data relates to what, because historical data still had to be regularly descended, both on long reports and in ordinary operations. As a result of the correct separation, more than 98% of the main operations did not go into slow historical data. What is important, there was no getting into the system code. It happens that some of our recommendations require changes to the application code, which is not supported by us, then we usually agree.
The second example: an international manufacturer in the field of light industry and the FMCG segment in general. The downtime of the main site costs about 20 million rubles. The average load on the base is 200 AS (active sessions) with peaks up to 800-1000. It is not uncommon for the query optimizer to lose his head, plans begin to float not for the better, and wild competition for the buffer cache begins. No one is safe from this, but you can reduce the likelihood: for two months we monitored the system, analyzing the load profile, extinguished fires along the way, adjusting the indexing and partitioning schemes, data processing logic from the side of PL / SQL code. Here you need to understand that in a living, developing system, such an audit should be carried out regularly, although stress testing helps, but not always. And companies conduct audits by inviting third-party oracleists, but rarely do any of them sink to the level of business logic and are ready to delve into the data while interacting with developers. We do it.
Well, I want to say that the problem is not always the lack of regular cleaning or proper support. Often problems are in processes.
Because business loves decisions, not processes. This is the main reason.
The second is that not everyone can allocate resources to search for a bottleneck in an application, especially if it is a third-party application. And far from always in one team there are people who have the necessary competencies. Right now, we have a system engineer, network engineers, specialists in Oracle and 1C, people who are able to optimize Java, and the frontend in our team.
Well, if you are interested in diving into the details, then on October 1 there will be our webinar on what you can do in advance, before everything falls. And here is my mail for questions - sstrelkov@croc.ru.
- Come, we have fallen. If you don’t raise it now, they’ll show it on TV.
And we are going. At night. To the other side of the country.
The situation when no luck: the graph shows a sharp increase in the load on the DBMS. Very often this is the first thing that system administrators look at and this is the first sign that an ass has come
But more often we are talking about some typical things. For example, a customer is faced with a poor workflow system. On Mondays and Tuesdays, the system crashed, they rebooted the server, and then everything went up. The database was choking. They wanted to buy equipment (which is long and expensive), they called us to calculate the estimate. We calculated their estimates and at the same time offered to figure out what exactly slows down. In three to four hours, the source of the problem was localized. We found out that these are slow database queries and suboptimal indexing schemes. We created the missing indexes, poked around with the query optimizer in Oracle, some problems required changing the code - we changed the search conditions (without changing the functionality), replaced some of the requests with the use of pre-calculated views. If they had a normal person in the database - they could do the same themselves. But instead of a normal person, the database was audited once every six months by cool oracleists - they issued general recommendations on settings and hardware.
How does it happen
Details are a little changed at the request of security. There is a document management system in hundreds of industrial facilities. She sometimes falls, and work rises. That is, objects can work, but not a single document passes and is not signed. And this, in particular, the shipment of raw materials, salaries and orders, what and how much to produce per shift. Every fall is a pain, tears, cognac for the CIO, because it’s hard for him: a lot of losses.
The director, by the way, is only six months old at this place after the past. And last year lasted. And both of them work on a system that the director introduced three generations ago. The second from the end tried to introduce his own, but did not have time before dismissal. The situation is very realistic.
At first glance, not enough performance. The load profile is locks (Wait Class “Application”). That is, competition for the lines. We begin to investigate the incident. A session is opened for each user transaction. It quickly goes into the state of blocking the order, according to which tasks and instructions for execution are written out, because the user must put a “Familiar” visa at a minimum.
The last case - they rolled up a new standard on how often employees should undergo a medical examination. The top-level personnel officer wrote an order and sent it to all organizations. That is, each employee of each production. Tens of thousands of users have received visa transactions. They began to open orders almost simultaneously, put a long chain of locks in the database. Due to not the most optimal code, a “small” overflow happened as a result, and everything was choked. About 40 thousand users do not work. Of the backup scheme - only phones and mail. Production does not stop, but efficiency drops very much, which causes specific financial losses. And then the calls begin from each enterprise to the IT director personally with a talk. In practice, they have an SLA, but there is no agreement yet. And the situation takes on the final features of purely Russian history.
The quick-fix problem was solved by profiling, analyzing the logic of blocking objects, eliminating unnecessary objects on which the lock was set, although it was not necessary because the object did not change (for example, directories, access rights, etc.). Then, in a couple of months, the main sections of the code were refactored.
How are these sections of code searched?
In addition to standard tools (thread dumps, logs, metrics, AWR, data from system representations, etc.), we use more civilian tools, including commercial ones.
Example 1: Slow Transaction Log
Complaints from users have been received about the slow operation of the journal (a known and frequent problem).
We find the problem view, then we look for the request in the operations for the deal_journal_view view. We search for all transactions where there is such a request inside.
For each of the operations, you can look at its details and find the request itself with the execution parameters, which allows you to analyze the operation of the request, validate and adjust the plan. Found a specific slow request.
They themselves analyzed and proposed optimization options. And only then, to track this group of business operations (view the transaction log), create a Transaction Type and configure alerts.
Example 2: finding the reasons for the slow user 1
User 1 received complaints about the slow operation of the application. We look:
All user operations were searched and sorted by duration. Next, the slowest operations were analyzed, and slow queries to the external system (SAP) were detected.
Pointed it to the adjacent team, fixed it.
Example 3: another user complains about the slow operation of the application
We look in the same way. This time we see a large number of calls to an external signing service. It turned out, under certain conditions, they signed some documents twice. Corrected.
Example 4: when there is not enough detail
Sometimes, to analyze more complex parts of the code, we resort to the use of custom profilers, which allow us to study the behavior of the application more deeply. For example, like here: a lot of incomprehensible logic during the operation of the logic in the system. We figured out the logic, added a couple of caches, optimized requests.
Example 5: more brakes
The user complained about the slow work with the contract cards.
The slow user operations (parameter = 'userlogin = ”...”') for one week are analyzed. Most of the problems were with search queries under contracts, but operations with a document card were also found. Most of the time is spent on creating a large number of tasks on assignments. Identifiers were found (the Parameter Value column in the screenshot) of the stored tasks and the time they were saved.
Logically, when they can be created asynchronously, but now they are queued and require exceptional locks. Here you already need to delve deeper into the architecture.
That's how simple it is: you need to find a bottleneck - and that's it?
No.
And again no.
This is all a treatment for the symptoms.
It’s right to quickly save the situation, which is now on fire. And then put the processes. It’s rare when people who work with the system do not understand what they are doing. It’s just that they either need to justify the means to reduce technical debt (and no one believes them), or change the processes to more modern ones (for which there are no resources either), or do something else like that.
In general, we come from the top level and see pain at the customer. Next we catch the bottleneck. Sometimes it ends with the introduction of a monitoring system. And if the customer understands that it is necessary to change the processes of software development, then the stage begins "long, expensive and not even at all awesome."
We look at two or three projects, pick all the documents, repositories, interview people. Next, we prepare templates for new documents, prepare procedures, look at tools for managing requirements, testing. And we help to implement. Sometimes it’s enough just to give an opinion on what to change, and the winged CIO with paper gets a budget. Sometimes it is necessary to directly inject with blood and tears.
Anything can turn out to be a pain, starting from the wrong choice of architecture to some features of the workflow. These examples are about game in processes in different companies around the country.
Regarding database optimization, here is a typical example. There is a medical system (one of those who fell). They called us to watch. We arrived when they had already disabled all the modules, except for the workflow of doctors, so that at least somehow the analyzes would go and the record through the registry would be. Online recording, in particular, was among the disabled modules. I managed to fix everything in one week. Initially, the customer thought that the problems were on the application layer: there were time-out failures, stuck threads. We found out that the problem is with the database. There was a complex structure, a bunch of sectioning by day and month. It turned out that they forgot about a couple of indexes, the developers did not fully know what it would turn into over time - and here is the result. Approximately the same set of operations plus search restrictions (when you need to unload something in a date range, it would be nice to look between these dates, and not across the entire database).
It is clear that such optimization does not always solve the problem. For example, (by architecture) the energy sector: the customer asks to see what the system is hanging with. And there everything flew upon delivery, but after a couple of years there were much more documents, and everything braked nicely. The customer sat with a stopwatch at the operator’s workplace and said: this operation now takes 31 seconds, we want 3. This one is 40 seconds, we want 2. And so on. It is clear that measuring this way is not very correct, but the task is quite specific and can be easily presented in the form of objective criteria. Not everything was done, it took about six months to “clean”. For the most part, the logic was transferred to asynchronous execution, some of the databases were changed to noSQL, the Solar search engine was installed, in one section it was necessary to select the hottest database and make it in-memory. As a result, about 90% of the needs were closed, but in some places they could not reduce the delays. This is the work of third-party libraries, the physical limitations of the platform, and so on. All this was monitored by monitoring and were able to clearly prove exactly where and what slows down.
Why else might such monitoring be needed?
We use different monitoring software to quickly find inhibitory processes and optimize them. The IT team of one of the major customers looked at how we do this, and asked to implement it at one of the facilities as a permanent tool. OK, we monitored all processes and nodes, customized their system for tasks, worked for almost four months, but made a set of tools to support them. And there are 80 thousand users, there are the first and second lines inside and the third often - with contractors or also inside.
On the second line is just this set of tools. Now in about 50% of cases they use monitoring to diagnose, search for bottlenecks and causes of freezes, so that their own developers can see, understand and optimize. A lot of support time is saved by quickly identifying the cause of the problem. After the pilot scaled by transaction. That is what took four months: there is a business operation for any action. Opening a document card is a business transaction. Signing in a workflow system is a business transaction. Report upload or search, too. 1,500 such business operations in four months are described to understand where and what works. Monitoring before this saw http-calls and sees called methods and functions, sees specific requests. Prior to this, only the developers understood that this was agreement agreement or search. In order for the monitoring system to show relevant data for different support lines and for business, we have set up all these bundles.
The business also began to cut reports on IT development on its own. More on the logs there no one picks especially.
By the way, about everything why APM class systems are needed at all, and how to choose them, we will talk at a webinar on October 1 .
What else are there “plugs” on the technical side?
A couple more examples. A large foreign bank with representative offices in Russia. We support Oracle DB and Oracle Weblogic. A gradual decrease in productivity was observed in the system, business operations were performed more slowly, the work of the operator became less and less efficient, and during the periods of imports and synchronization with the NSI everything was completely freezing. In such cases, we use standard Java and Oracle tools to collect data: we collect thread dumps, analyze them in free services or use self-written analysis tools, look at AWR, trace the execution of SQL queries, analyze plans and execution statistics. As a result, in addition to standard things, such as optimizing the composition of indices, adjusting query plans, we proposed introducing partitioning by dividing the data. It turned out two segments: historical (left them on the HDD) and operational - placed on the SSD. Prior to this, it was quite difficult to understand what data relates to what, because historical data still had to be regularly descended, both on long reports and in ordinary operations. As a result of the correct separation, more than 98% of the main operations did not go into slow historical data. What is important, there was no getting into the system code. It happens that some of our recommendations require changes to the application code, which is not supported by us, then we usually agree.
The second example: an international manufacturer in the field of light industry and the FMCG segment in general. The downtime of the main site costs about 20 million rubles. The average load on the base is 200 AS (active sessions) with peaks up to 800-1000. It is not uncommon for the query optimizer to lose his head, plans begin to float not for the better, and wild competition for the buffer cache begins. No one is safe from this, but you can reduce the likelihood: for two months we monitored the system, analyzing the load profile, extinguished fires along the way, adjusting the indexing and partitioning schemes, data processing logic from the side of PL / SQL code. Here you need to understand that in a living, developing system, such an audit should be carried out regularly, although stress testing helps, but not always. And companies conduct audits by inviting third-party oracleists, but rarely do any of them sink to the level of business logic and are ready to delve into the data while interacting with developers. We do it.
Well, I want to say that the problem is not always the lack of regular cleaning or proper support. Often problems are in processes.
Why do we need such services with their live developers?
Because business loves decisions, not processes. This is the main reason.
The second is that not everyone can allocate resources to search for a bottleneck in an application, especially if it is a third-party application. And far from always in one team there are people who have the necessary competencies. Right now, we have a system engineer, network engineers, specialists in Oracle and 1C, people who are able to optimize Java, and the frontend in our team.
Well, if you are interested in diving into the details, then on October 1 there will be our webinar on what you can do in advance, before everything falls. And here is my mail for questions - sstrelkov@croc.ru.
All Articles