MetricKit. Performance analysis of iOS applications

New toy
We continue to familiarize ourselves with new material from Apple presented at WWDC. This time, consider MetricKit , a completely new framework that serves as a tool for monitoring application performance.
Everyone knows that measuring application performance during development is easy. Xcode shows the amount of RAM used and processor load, you can connect using Instruments to a simulator or device under test and even write your own tools (for more details, see our articles on custom tool packages: part 1 / part 2 ). Just understanding the importance of performance tuning does not allow you to measure almost everything that the application does. But things get more complicated when we talk about the AppStore, if the developed application is intended for real users. No matter how thoroughly you test your application, in real life there will always be a bunch of surprises that will affect performance and user experience. Of course, there are many tools for collecting various parameters, but most of them are limited by the iOS SDK , as well as the impact of actual monitoring on application behavior.
This year, Apple decided to fill this gap and provided developers with a tool that helps them collect and analyze application performance metrics in a real-world environment. They announced MetricKit (a framework that provides access to the options that the OS provides) of a separate tab in the Xcode 11 organizer, where you can find application settings. We will pause in MetricKit, because the display of parameters in Xcode will work only with applications that are already published in the AppStore.
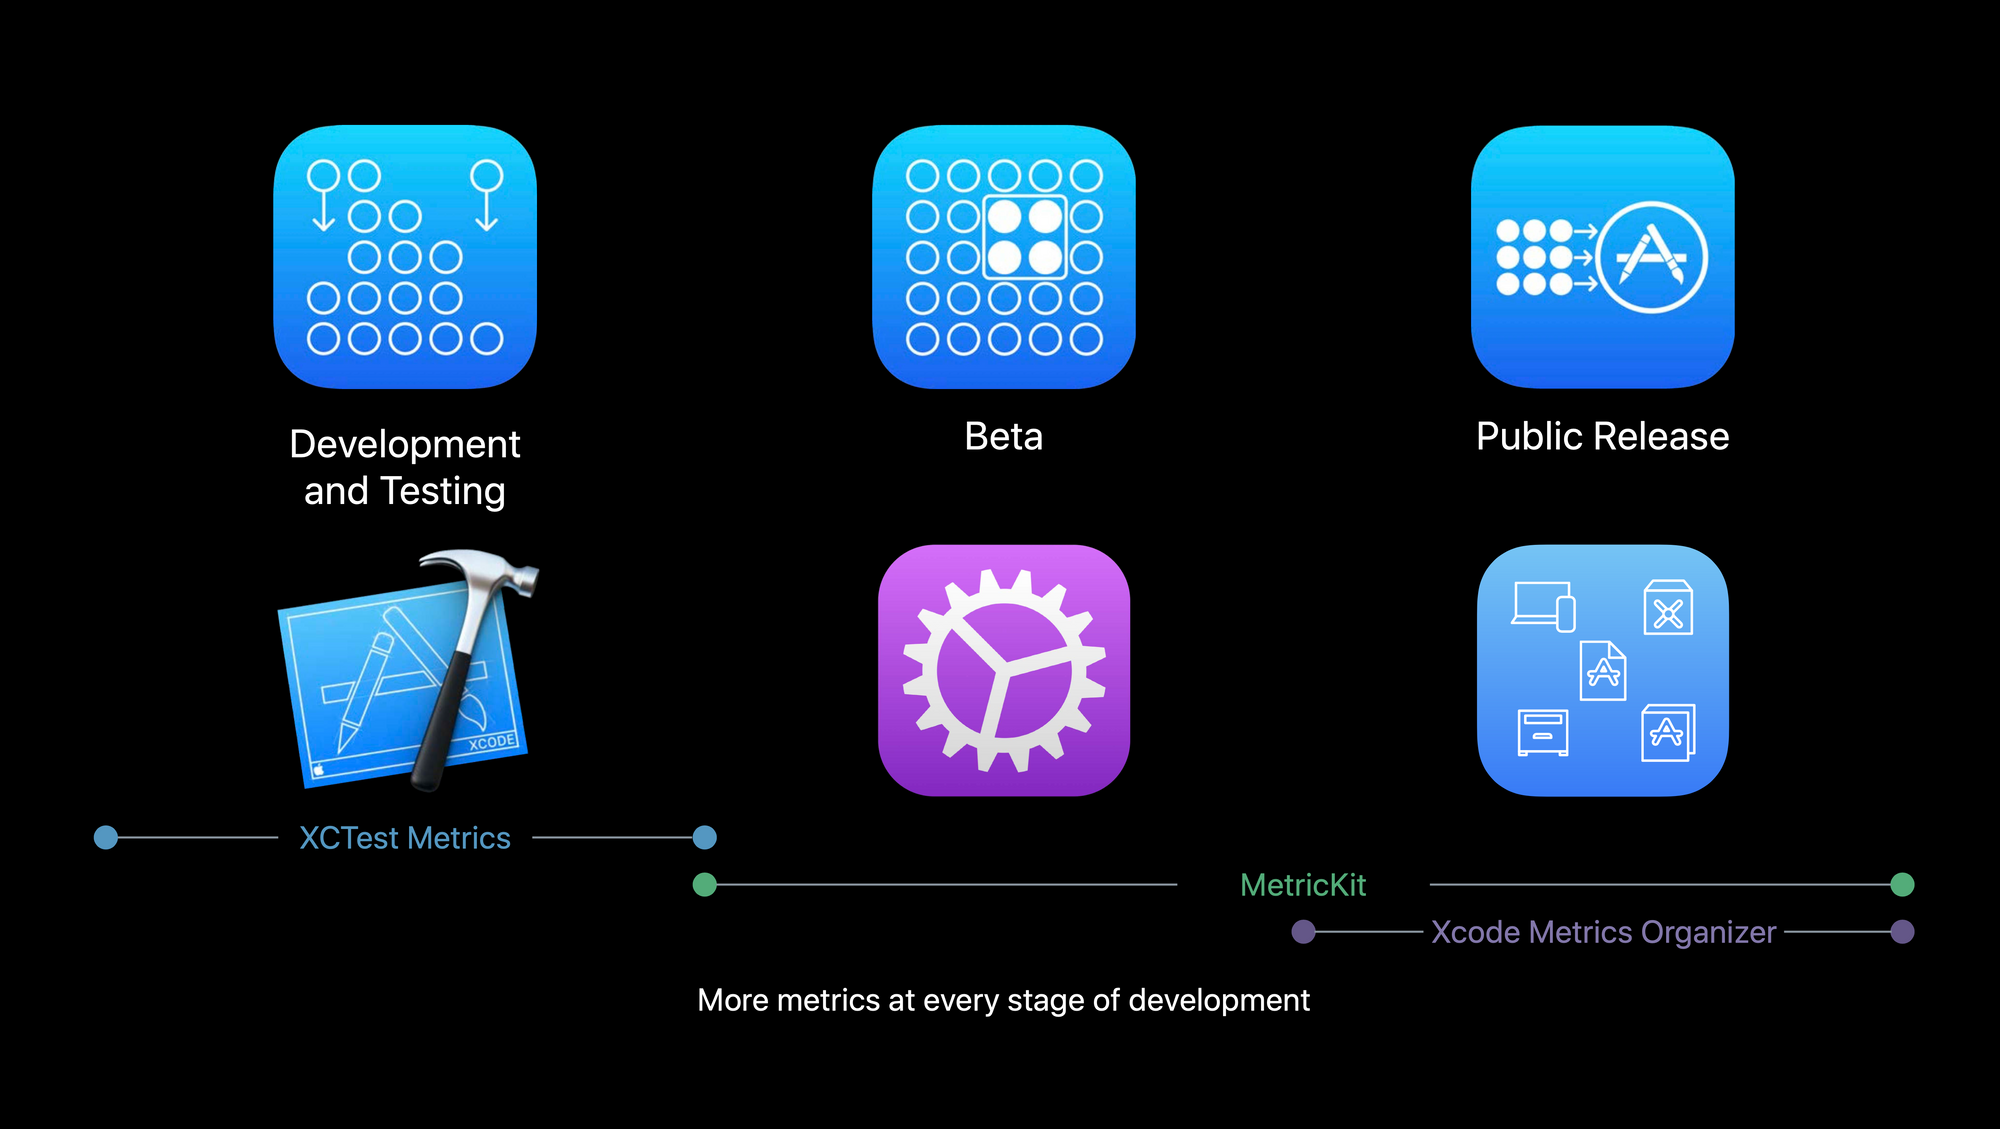
MXMetricManager
The architecture of the framework is quite simple and straightforward. The central part is occupied by the MXMetricManager class, which is a single-element structure that provides the developer with a large set of framework APIs.
In general, the workflow consists of 3 main steps:
- You initialize the MXMetricMnager and assign an observer for it.
- If you wish, you can implement your own metrics in your application using the Signpost API
- And finally, now we are dealing with the received data in the didReceivePayloads method, i.e. send them to your backend for further analysis.
Parameters come as an array of instances of MXMetricPayload . The payload encapsulates metadata sets and timestamps. Metric payload is a simple wrapper for subclassing MXMetric . For each type of parameter, it is separate.
The types of metrics are pretty well documented by Apple, so let's not dwell on this for too long. However, you should stop to notice one interesting thing - MXMetric provides an open API for serializing it in NSDictionary or JSON, which, in my opinion, is a bit unusual.
Internal components of MetricKit.
Outside, MetricKit looks pretty simple. But it’s always interesting to see how everything works from the inside. Immersion into something deeper is always an intrigue, if you are facing a specific task. So I decided that I wanted to pass parameters with MetricKit tags, and then get them to provide me with updated metrics at any time. Of course, you can use ` Debug -> Simulate MetricKit Payloads` in Xcode, but id does not allow you to display your own data. True, this is not a very useful team, but it gives you direction in your research, and it looks very funny;)
To start the task, we obviously need MetricKit itself. You might think that getting a binary file for the framework is easy, because Xcode shows it in the list of frameworks as soon as you add it through the “link binary file to libraries” dialog. This is a very optimistic thought. Because if you open MetricKit.framework , you will see the MetricKit.tbd file. Its size is only 4kb . Obviously, this is not what we are looking for.
So what is really going on here?
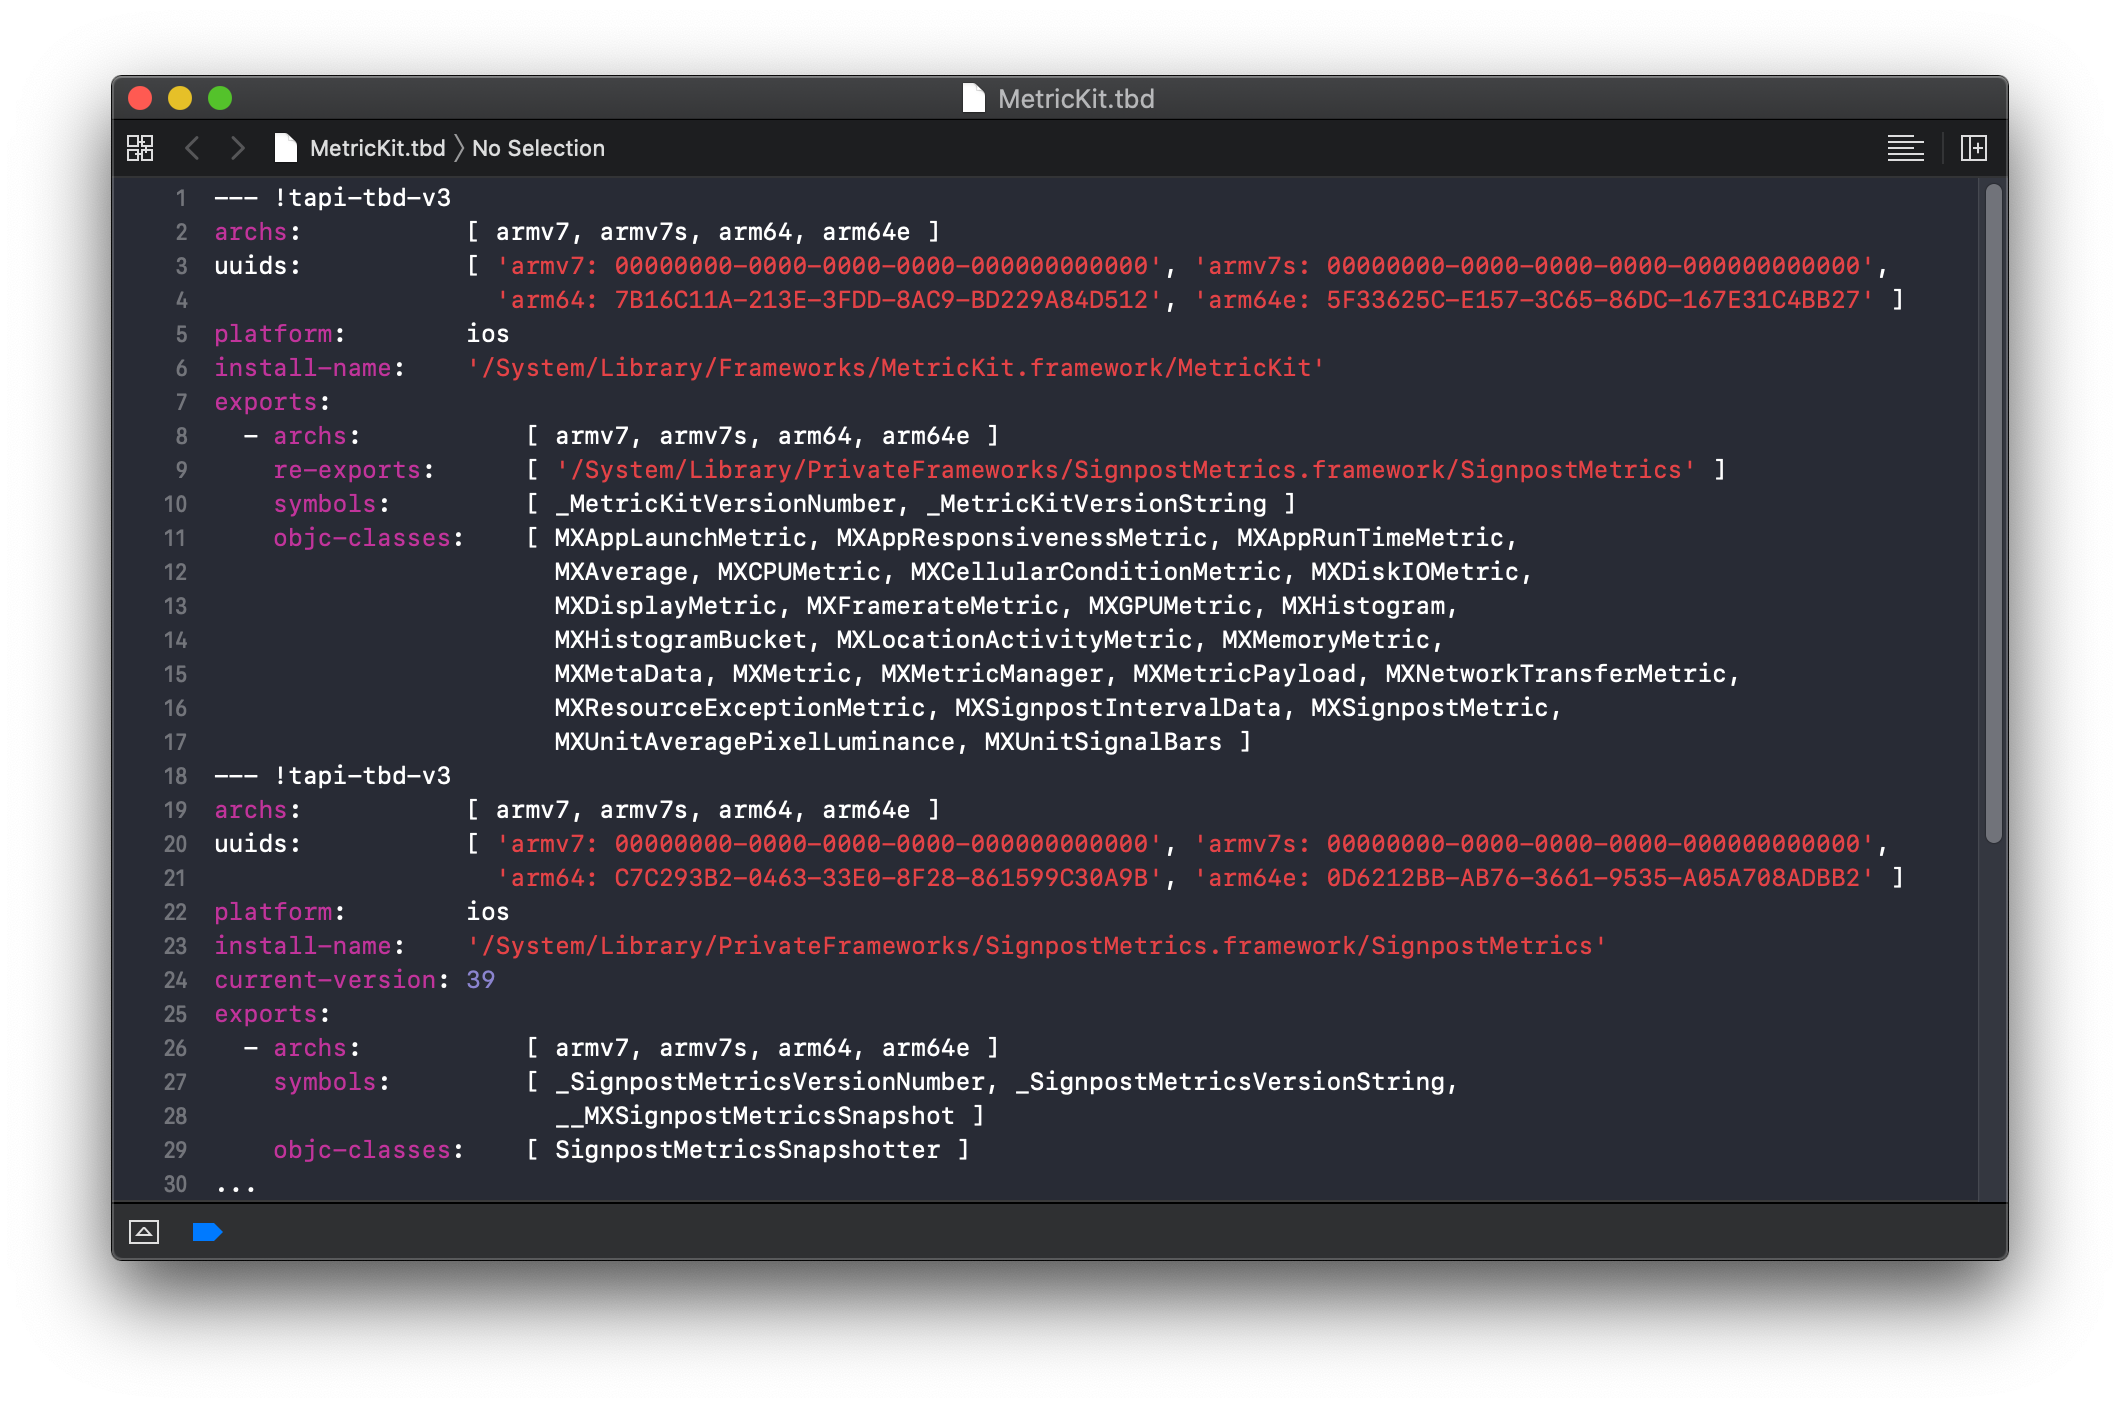
TBD stands for “text-based dylib stub” and is actually a YAML file with a dylib description exporting characters and a path to the dylib binary. Linking tbd files reduces the size of the binary. Later, at runtime, the real dylib binary will be downloaded from the OS at the path specified in the tbd file. This is what the file looks like when you open it in Xcode:
Using the path from the tbd file, you can easily get the MetricKit binary for further research, but there is an even simpler method.
Our application binary contains the path to each dynamically linked library in the Mach-O header section. This information is easily accessed using the tool using the -l flag.
Here is the output for the test project I created:
→ otool -l ./Metrics | grep -i metrickit name /System/Library/Frameworks/MetricKit.framework/MetricKit (offset 24)
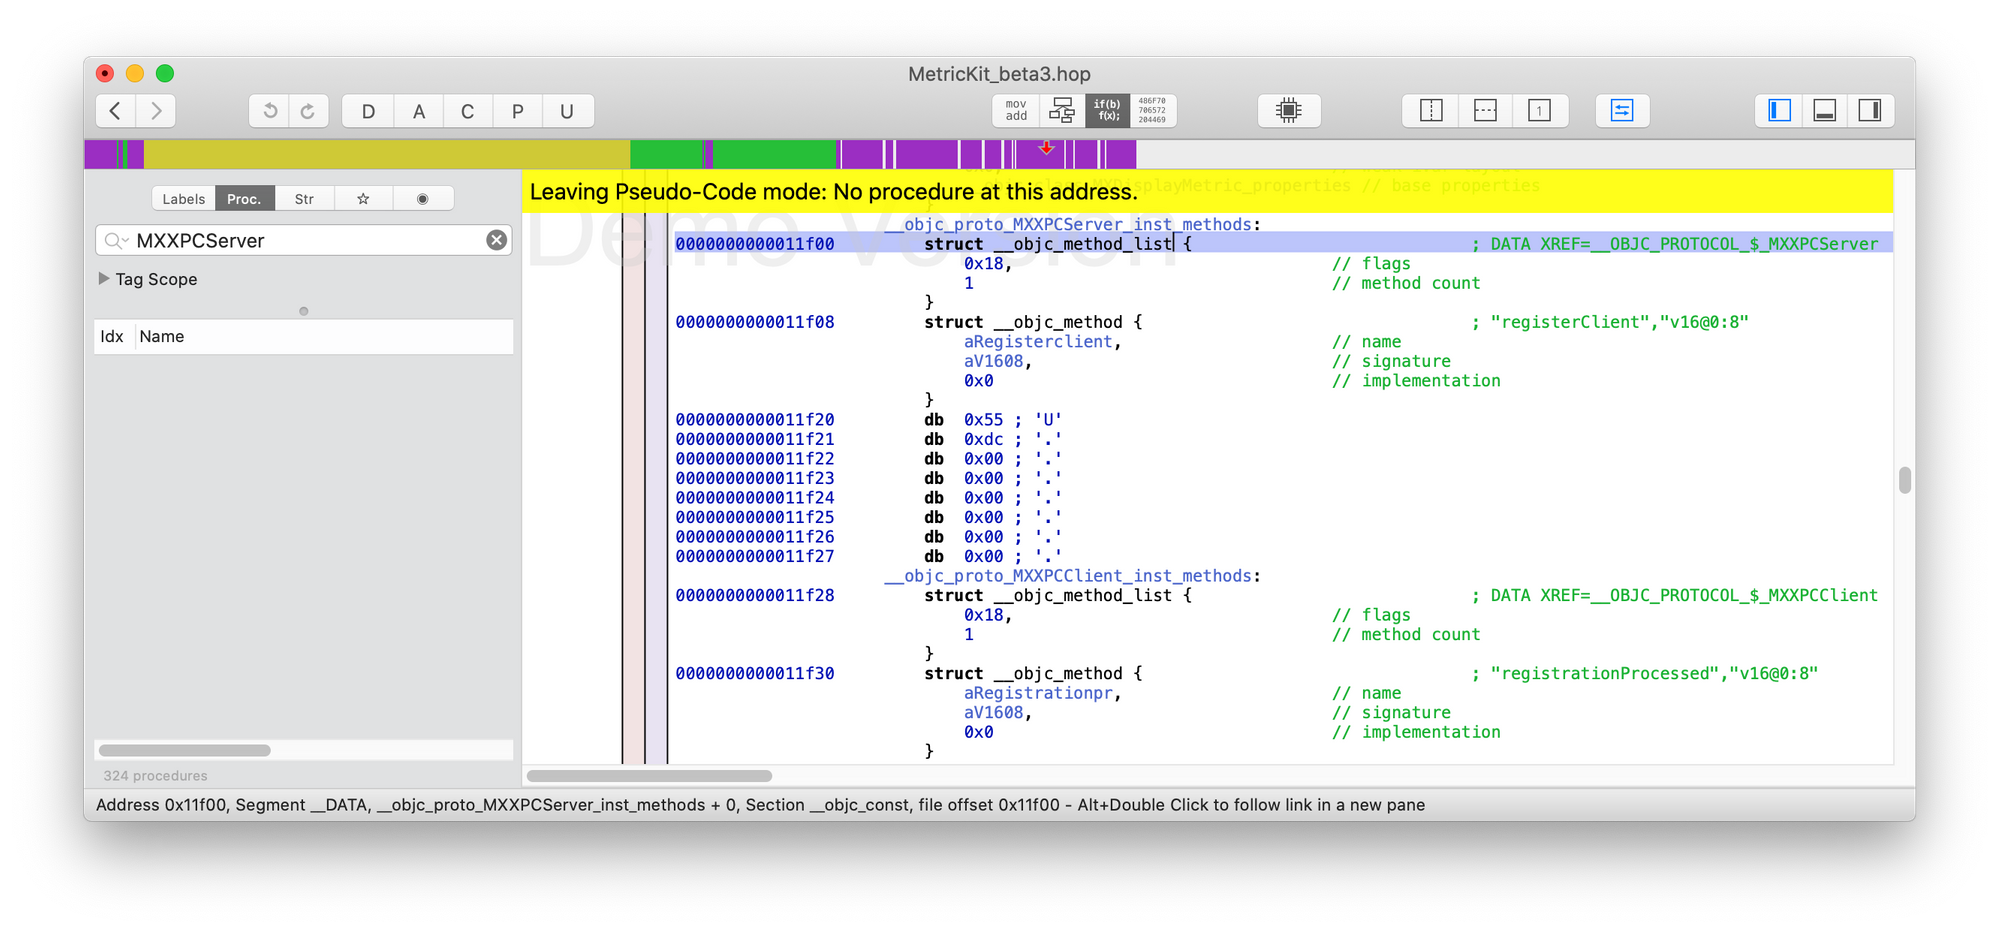
You can see the same path that we saw earlier in the tbd file. Having a binary framework file, you can take a look at the internal elements. For this, I usually use the Hopper Disassemble . It is an easy to use, but very powerful tool for a careful study of binary files.
As soon as the MetricKit binary file opens, go to the 'Proc.' Tab and expand the 'Tags' list. Here you can see all exported characters. Selecting one of them (for example, MXMetricManager), we will see all its methods and, having selected a method, we will see its contents on the right side:
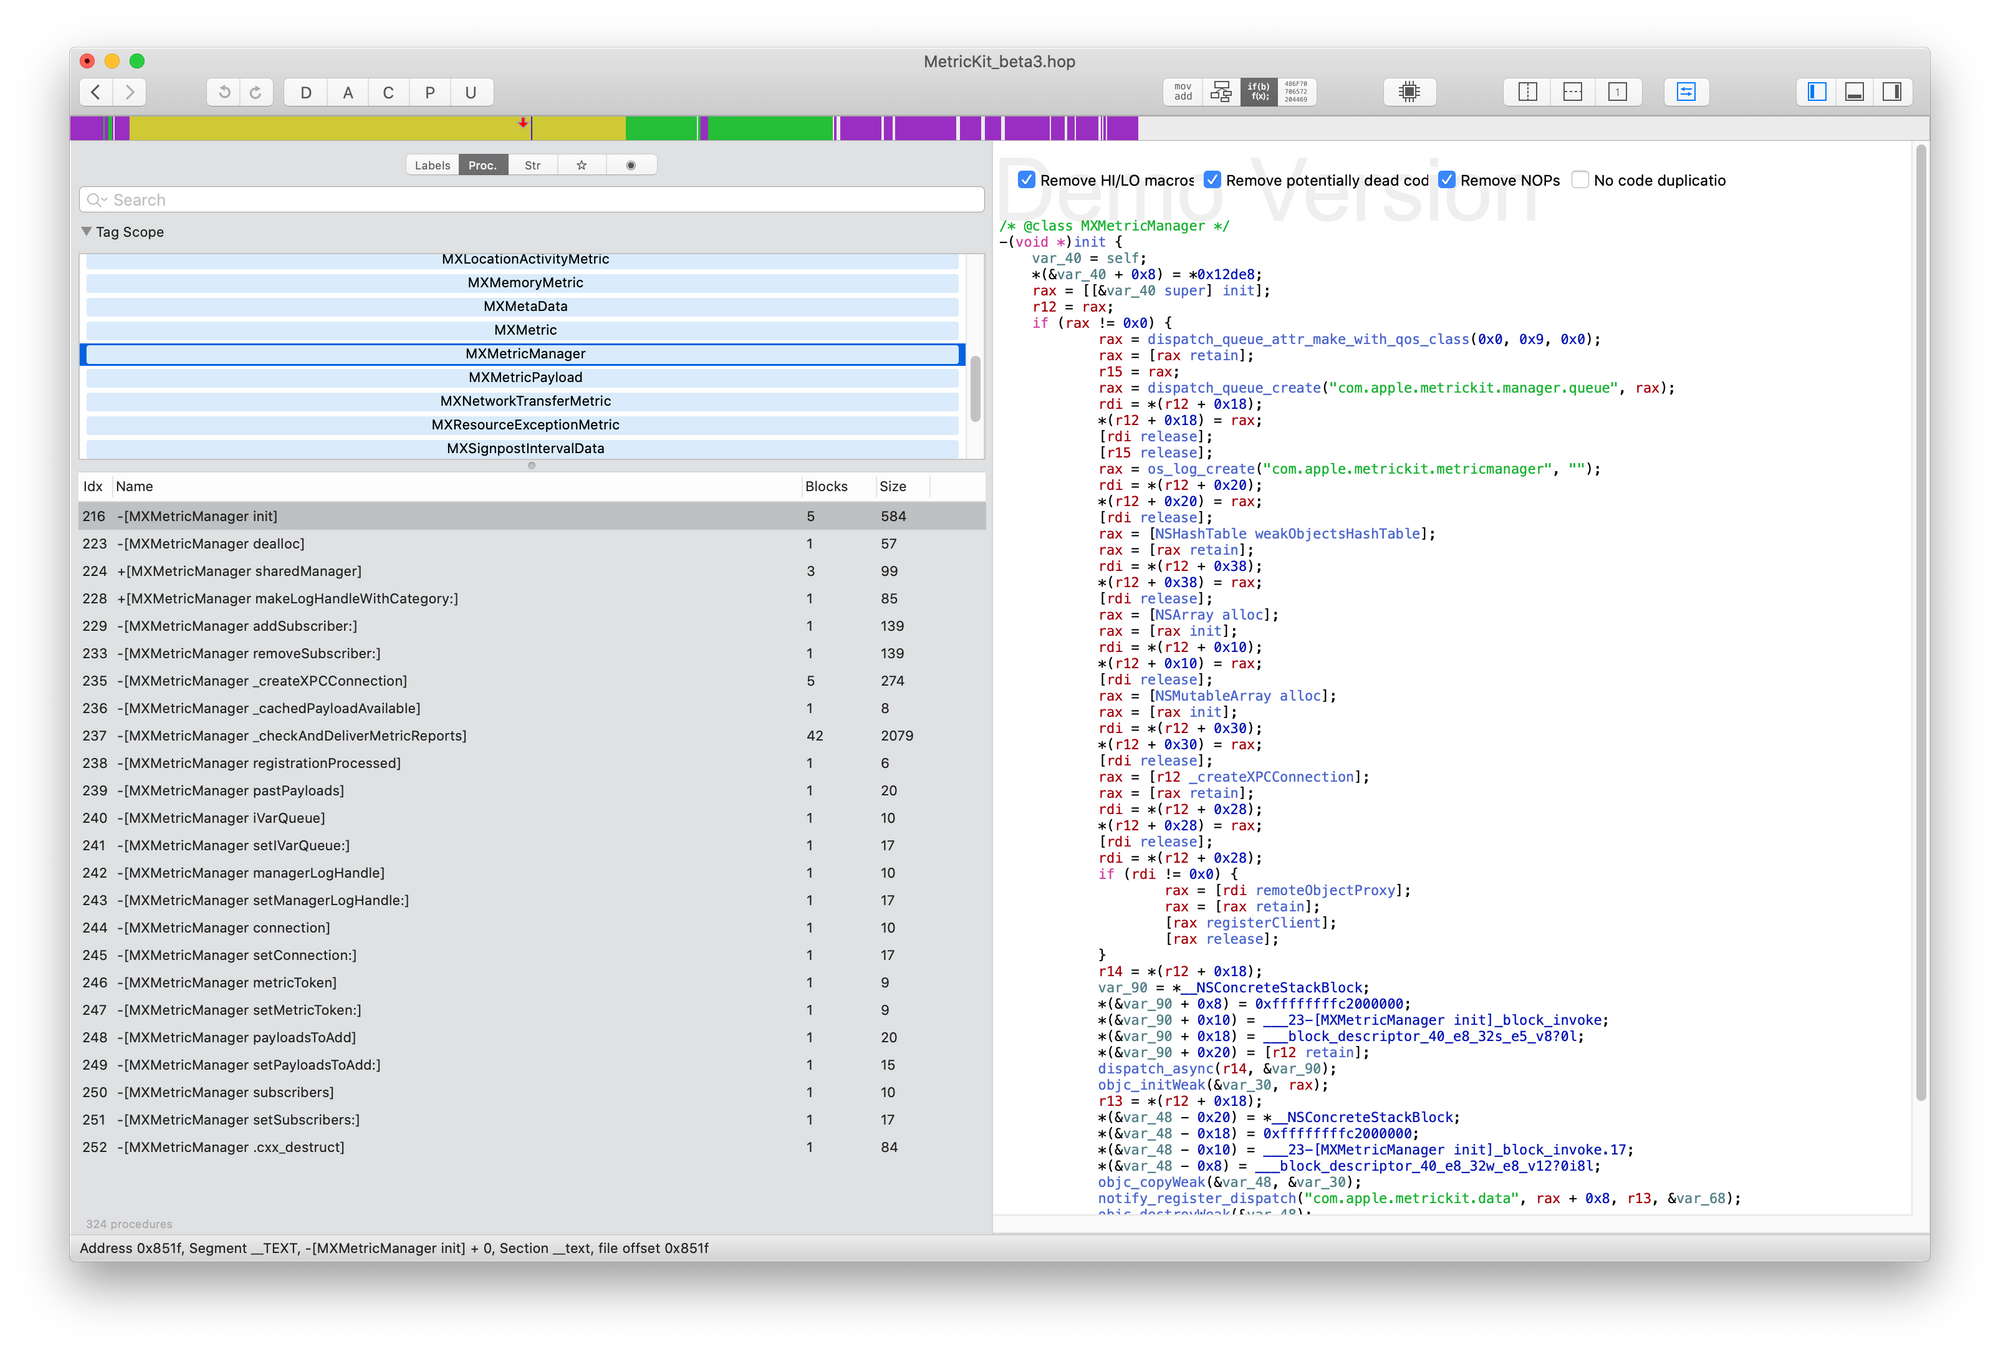
When viewing the MXMetricManager method list [ https://gist.github.com/deszip/88a258ae21d33dc75d7cbac9569c6ec1 ] it is very easy to notice the _checkAndDeliverMetricReports method. This seems to be what needs to be called in order to get MetricKit to deliver updates to subscribers.
Unfortunately, an attempt to call him did not lead to a call to the subscriber, which probably means that these parameters will not be delivered. Considering the implementation of the method, we note several interesting things: it enumerates the contents of the / Library / Caches / MetricKit / Reports directory.
He then tries to unzip the MXMetricPayload instance for each item on disk. And finally, it iterates over registered subscribers and calls the didReceive method with a list of data.
The problem is probably that there is no data in / Library / Caches / MetricKit / Reports , but we know that we need some archived instances of MXMetricPayload. So, let's create them and put them on the disk before calling ' _checkAndDeliverMetricReports '. Again, the plan is to create an instance of MXMetricPayload, then create and add any type of MXMetric to it, and then archive the data instance to disk. After all, call the ' _checkAndDeliverMetricReports ' method, this should result in calling our subscriber with stub as an argument.
Looking through Apple docs on payload and metrics, you may notice that they do not have public initializers, and most properties are read-only. So, how is it possible to instantiate a class?
Back to Hopper again to see a list of MXMetricPayload methods:
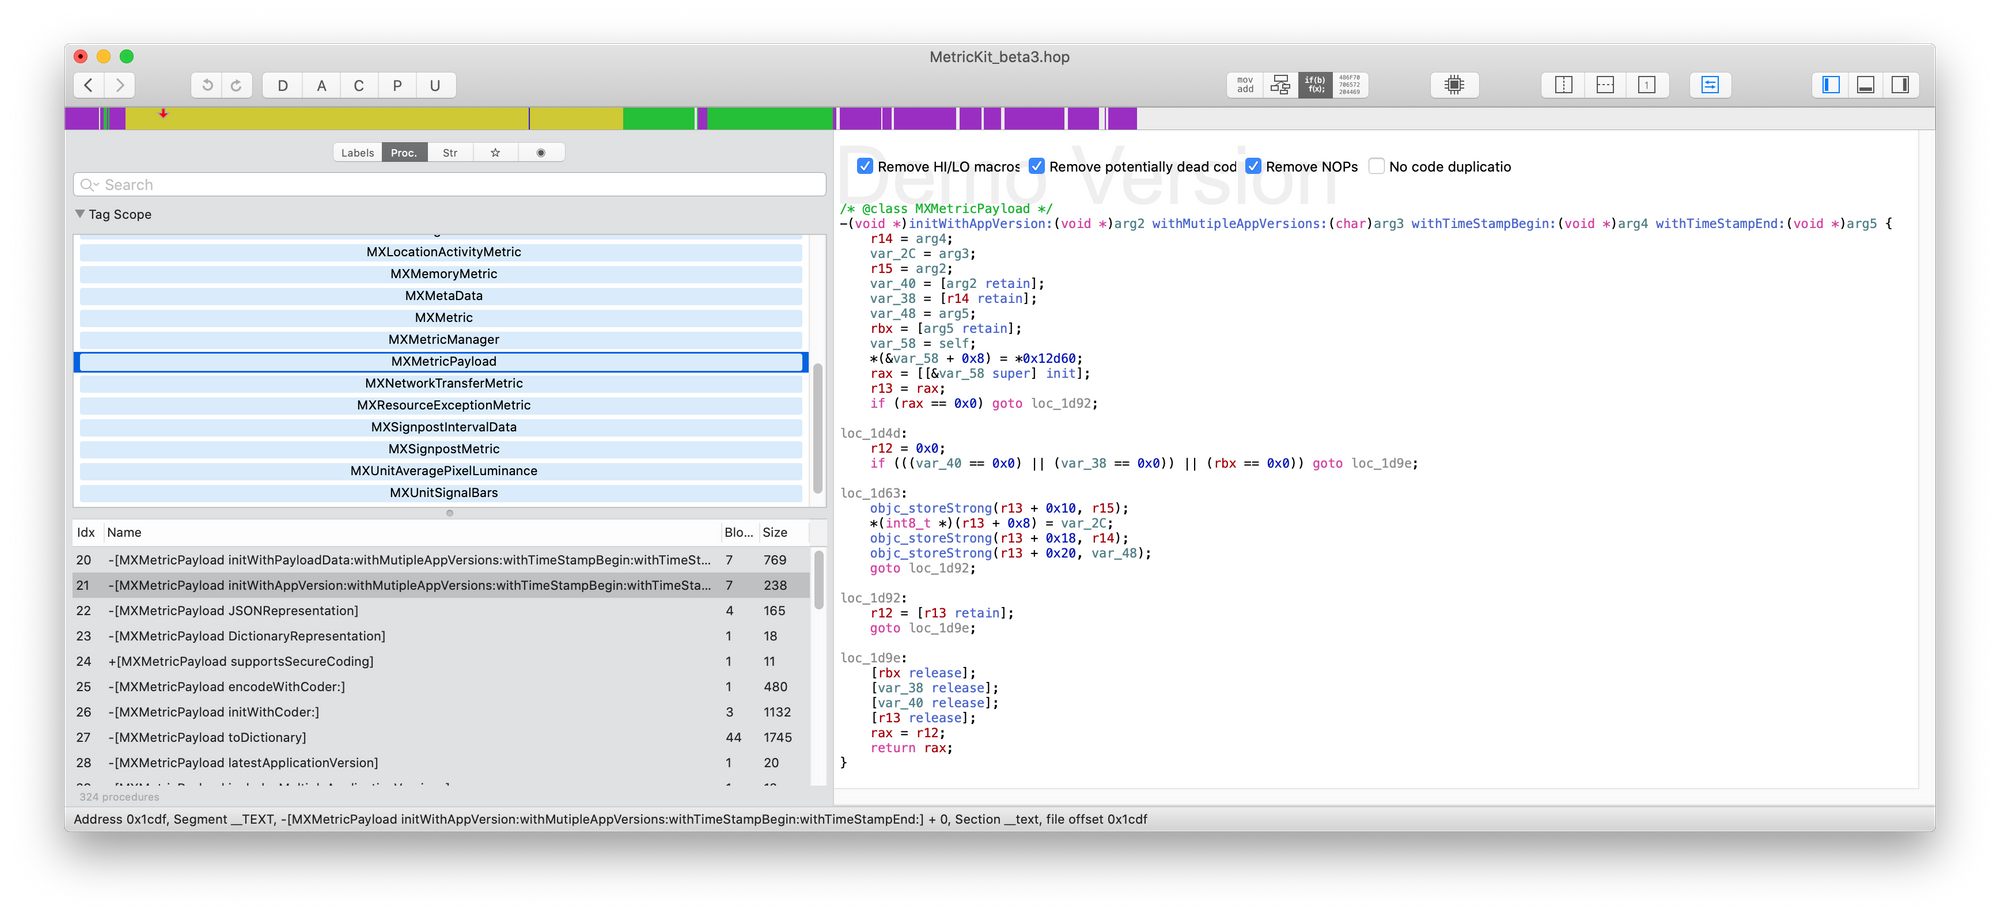
Here you can see its initializers and methods for assigning parameters. Calling private methods is easy using the NSInvocation class and the 'performSelector' method due to the dynamic nature of Objective-C.
As an example, we will create metrics for the CPU and add them to payload. Using this link, you can find the full code fragment: [ https://gist.github.com/deszip/a0cf877b07cc2877129e0aaef2fed1e4 ].
And finally, we archive everything that we created and write the data to the / Library / Caches / MetricKit / Reports directory .
Now it's time to call the ' _checkAndDeliverMetricReports ' method, which should eventually lead to a call to the subscriber. This time we pass the data with stubbed payload as an argument as an argument.
Where do the metrics come from
Getting reports is pretty easy to implement through MetricKit , but you're probably interested in learning how reports appear in the app / Library directory. Here is how.
Digging inside the MetricKit binary, I noticed this method: '_createXPCConnection'. Checking its implementation clarifies the situation - it builds an NSXPCConnection for service with the name com.apple.metrickit.xpc and two interfaces MXXPCServer and MXXPCClient for the client and server sides. If you look at the protocol description:
Conclusion
MetricKit is a unique and indispensable tool for taking care of the performance of your application in real conditions in production.
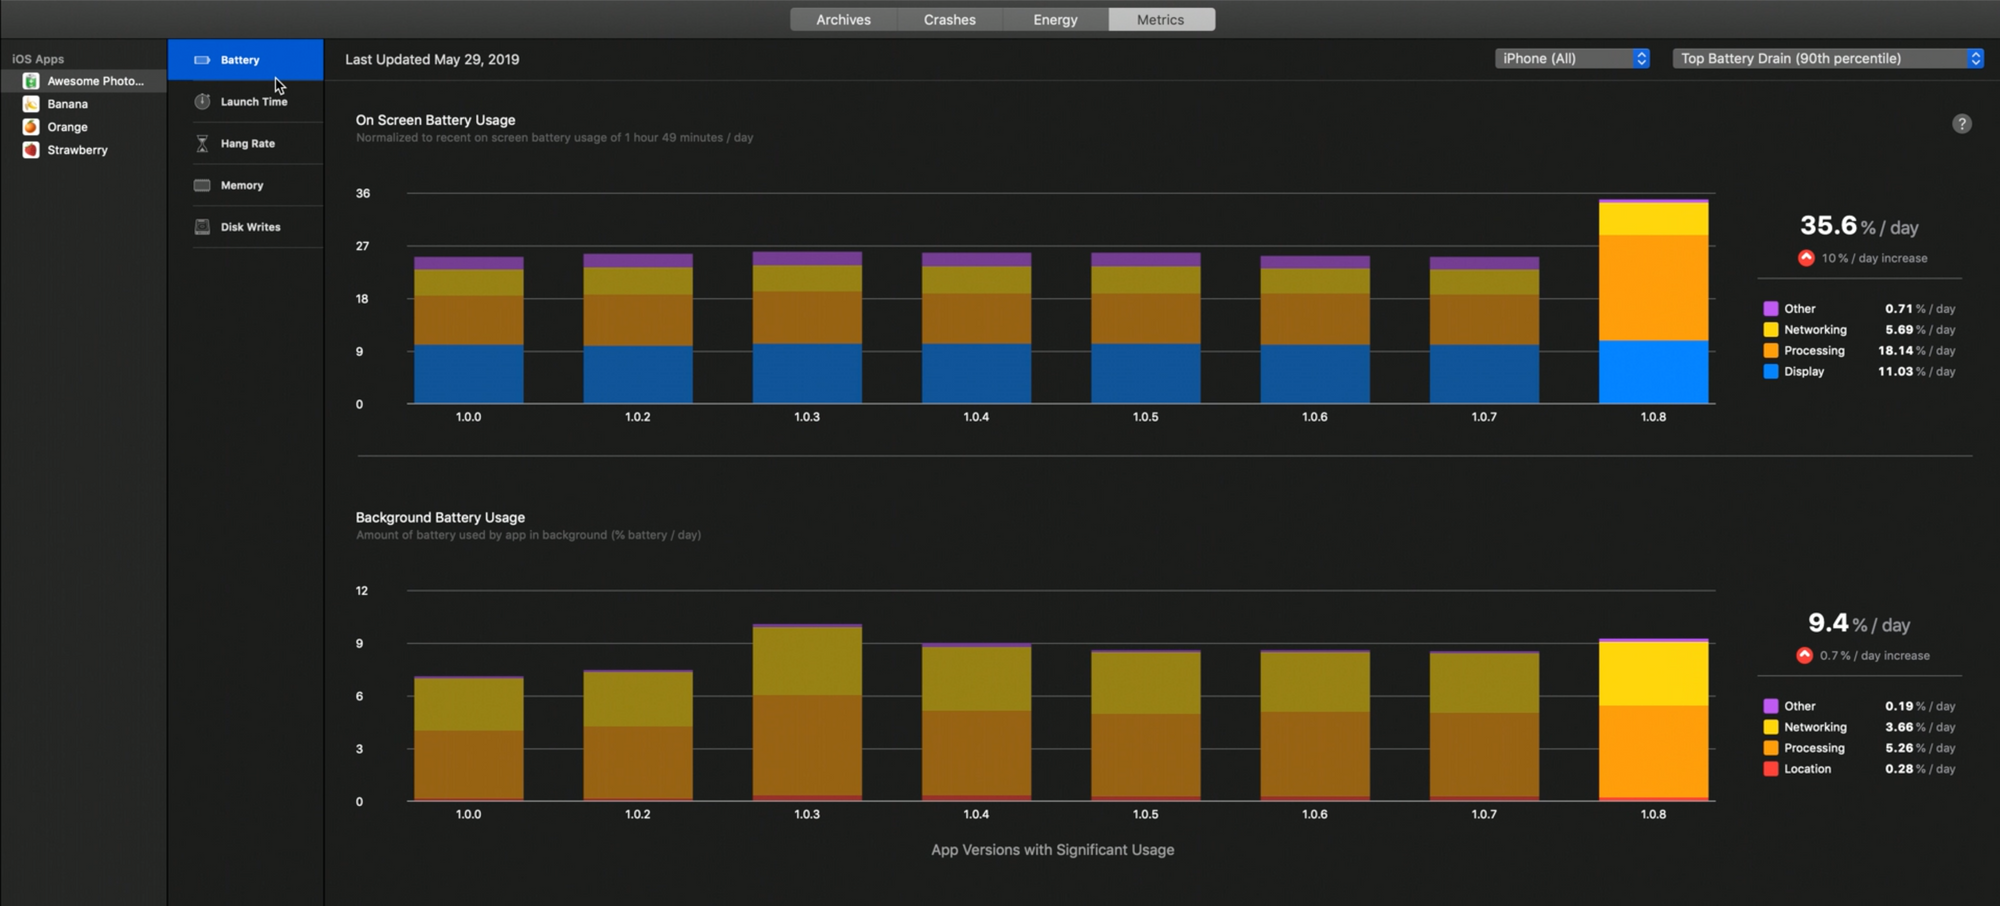
Unfortunately, it is currently not possible to look at the 'Metric' user interface in Xcode, except for what was shown during a demo at a WWDC session.
It can be an invaluable tool for taking user experience to the next level by eliminating performance issues in your code.
One drawback that I see now in this tool is the lack of details for each type: only separation is the version of the application, and you cannot see any metrics for a specific group of devices / OS versions / regions, etc.
But, of course, there is always the opportunity to send data to yourself for further processing along with important information that you need. You can attach it to tasks in your bug tracker and more. At AppSpector, our team is working on expanding the functionality of performance monitoring tools using data obtained from MetricKit .
Stay up to date!
All Articles