How to debug and profile any exe file using Visual Studio
Have you ever had to debug or profile an executable file (.exe file) for which you do not have source code or cannot build it? Then the least known type of Visual Studio project, the EXE project, is for you!
In Visual Studio, you can open any EXE file as a “project”. Just go to File -> Open -> Project / Solution and go to the .exe file . As if it were a .sln file. Visual Studio will open this EXE file as a project. This feature has been around for a long time. It works on all currently supported versions of Visual Studio, and its documentation is on the Debugging page of the application, which is not part of the Visual Studio solution .

As in a regular project, you can start debugging with F5, which will launch the EXE and enable the debugger. If you want to debug the launch, you can start using F11, which will launch the EXE and stop at the first line of user code. Both of these options are available in the context menu for the EXE project in the Solution Explorer window, as shown below:

For debugging you will need symbols, PDB files, for EXE and any DLLs that need to be debugged. Visual Studio will follow the same process and try to get characters the same way as when debugging a regular project. Since it is unlikely that the PDB files were distributed with the .exe file, you might want to find them in the assembly or, even better, on the symbol server. For more information and recommendations on using symbols, see this blog .
For effective debugging, you will also need the source code that was used to build the EXE, or even for several files that interest you. You need to find these files and open them in Visual Studio. If the source code does not match the source code that was compiled, Visual Studio EXE will warn you when you try to insert a breakpoint and the breakpoint will not be bound. This behavior can be changed in the Settings peek window . In the parameter view, click the link text Must match source , and then select the check box to resolve the inappropriate source, as shown below. Of course, with an inappropriate source, you never know what will happen, so use this only at your own risk.

If the EXE was compiled with SourceLink , then the source information will be included in the PDB, and Visual Studio will try to load the source automatically. This is a really good reason to use SourceLink with your projects. Even if you have a local set, you may not have the version used to build the binary. SourceLink is your reliable way to ensure that the correct source is associated with the correct binary.
If you cannot get the source code, you still have several options:
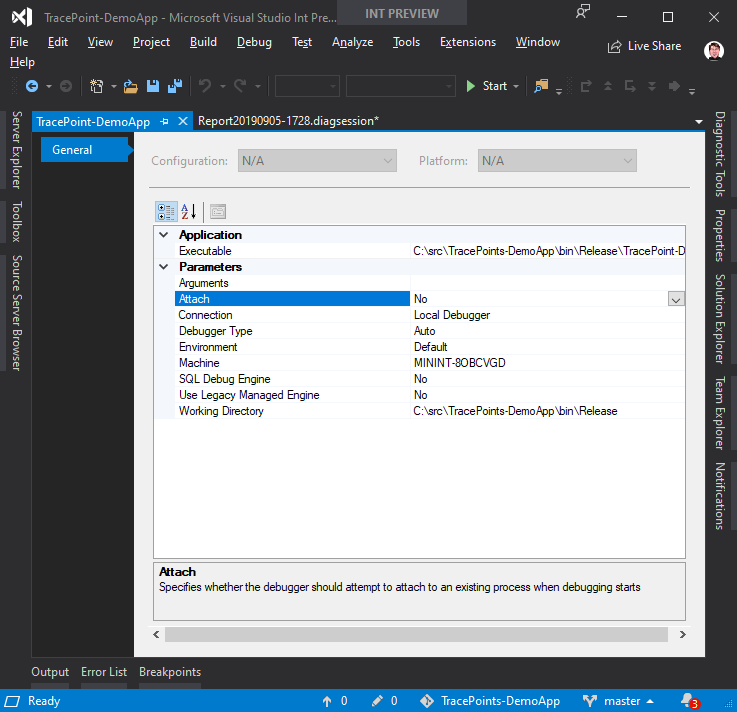
Finally, if you need to pass any arguments to a debugged EXE file, you can configure them along with other parameters on the Project Properties page ( Right-click -> Properties in the project node in Solution Explorer).
You can also use profiling tools with an .exe file by running them from Debugging -> Performance Profiling . On the launch page of the profiling tools, you can choose which tools to use against the EXE. Further information on profiling can be found in these documents ( https://docs.microsoft.com/en-us/visualstudio/profiling/profiling-feature-tour?view=vs-2019 ).

That's all. A brief overview of how you can use Visual Studio to debug and profile applications that you don’t create and that may not even have source code. The next time you need to debug or profile an .exe file, be sure to open it as a solution in Visual Studio!
In Visual Studio, you can open any EXE file as a “project”. Just go to File -> Open -> Project / Solution and go to the .exe file . As if it were a .sln file. Visual Studio will open this EXE file as a project. This feature has been around for a long time. It works on all currently supported versions of Visual Studio, and its documentation is on the Debugging page of the application, which is not part of the Visual Studio solution .
Debugging
As in a regular project, you can start debugging with F5, which will launch the EXE and enable the debugger. If you want to debug the launch, you can start using F11, which will launch the EXE and stop at the first line of user code. Both of these options are available in the context menu for the EXE project in the Solution Explorer window, as shown below:
For debugging you will need symbols, PDB files, for EXE and any DLLs that need to be debugged. Visual Studio will follow the same process and try to get characters the same way as when debugging a regular project. Since it is unlikely that the PDB files were distributed with the .exe file, you might want to find them in the assembly or, even better, on the symbol server. For more information and recommendations on using symbols, see this blog .
For effective debugging, you will also need the source code that was used to build the EXE, or even for several files that interest you. You need to find these files and open them in Visual Studio. If the source code does not match the source code that was compiled, Visual Studio EXE will warn you when you try to insert a breakpoint and the breakpoint will not be bound. This behavior can be changed in the Settings peek window . In the parameter view, click the link text Must match source , and then select the check box to resolve the inappropriate source, as shown below. Of course, with an inappropriate source, you never know what will happen, so use this only at your own risk.
If the EXE was compiled with SourceLink , then the source information will be included in the PDB, and Visual Studio will try to load the source automatically. This is a really good reason to use SourceLink with your projects. Even if you have a local set, you may not have the version used to build the binary. SourceLink is your reliable way to ensure that the correct source is associated with the correct binary.
If you cannot get the source code, you still have several options:
- Use the tool to decompile assemblies back to C #, which you can recompile into a new assembly to fix the old one.
- ILSpy is a great choice for this, but there are many other good paid and free tools.
- Use the Disassembly tool window in Visual Studio.
- The Source Not Found document contains a link to view disassembly . Keep in mind that if you're used to debugging C # code, view disassembly is a last resort.
Finally, if you need to pass any arguments to a debugged EXE file, you can configure them along with other parameters on the Project Properties page ( Right-click -> Properties in the project node in Solution Explorer).
Profiling
You can also use profiling tools with an .exe file by running them from Debugging -> Performance Profiling . On the launch page of the profiling tools, you can choose which tools to use against the EXE. Further information on profiling can be found in these documents ( https://docs.microsoft.com/en-us/visualstudio/profiling/profiling-feature-tour?view=vs-2019 ).
Conclusion
That's all. A brief overview of how you can use Visual Studio to debug and profile applications that you don’t create and that may not even have source code. The next time you need to debug or profile an .exe file, be sure to open it as a solution in Visual Studio!
All Articles