Announcement of the Kubernetes Web View web interface (and a brief overview of other web UIs for Kubernetes)
Note perev. : The author of the original material is Henning Jacobs from Zalando. He created a new web interface for working with Kubernetes, which is positioned as "kubectl for the web." Why the new Open Source project appeared and what criteria the existing solutions did not satisfy, read its article.

In this post, I look at the various open source Kubernetes web interfaces, present my requirements for a universal UI and explain why I developed Kubernetes Web View , an interface designed to make it easier to support and troubleshoot multiple clusters at once.
At Zalando, we serve a large number of Kubernetes (900+) and cluster (100+) users. There are a couple of typical use cases where the help of a specialized web tool would be very useful:
In my experience, communication within the framework of support often looks like this:
- Help, our XYZ service is unavailable!
- What do you see when you perform
?
Or something similar for CRD:
- I have some kind of problem with the identification service ...
- And what
command
?
This communication usually comes down to introducing various variations of the
command to fix the problem. As a result, both sides of the conversation are forced to constantly switch between the terminal and web chat, plus they observe a different situation.
Therefore, I want the Kubernetes web frontend to allow the following:
Responding to incidents in the infrastructure requires situational awareness, the ability to assess impact, and look for patterns in clusters. Some real life examples:
My standard solution in such cases is something like
. Obviously, you can develop a tool that provides similar capabilities.
The open source world of Kubernetes web interfaces is not too large *, so I tried to collect additional information using Twitter :
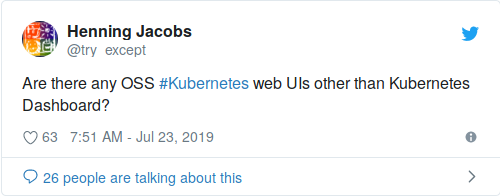
* My explanation of the limited number of web interfaces for Kubernetes: Kubernetes cloud services and vendors usually offer their own frontends, so the market for the “good” free Kubernetes UI is relatively small.
I tweeted about K8Dash , Kubernator, and Octant . Let's look at them and other existing Open Source-solutions, try to understand what they are.
“K8Dash is the easiest way to manage your Kubernetes cluster.”
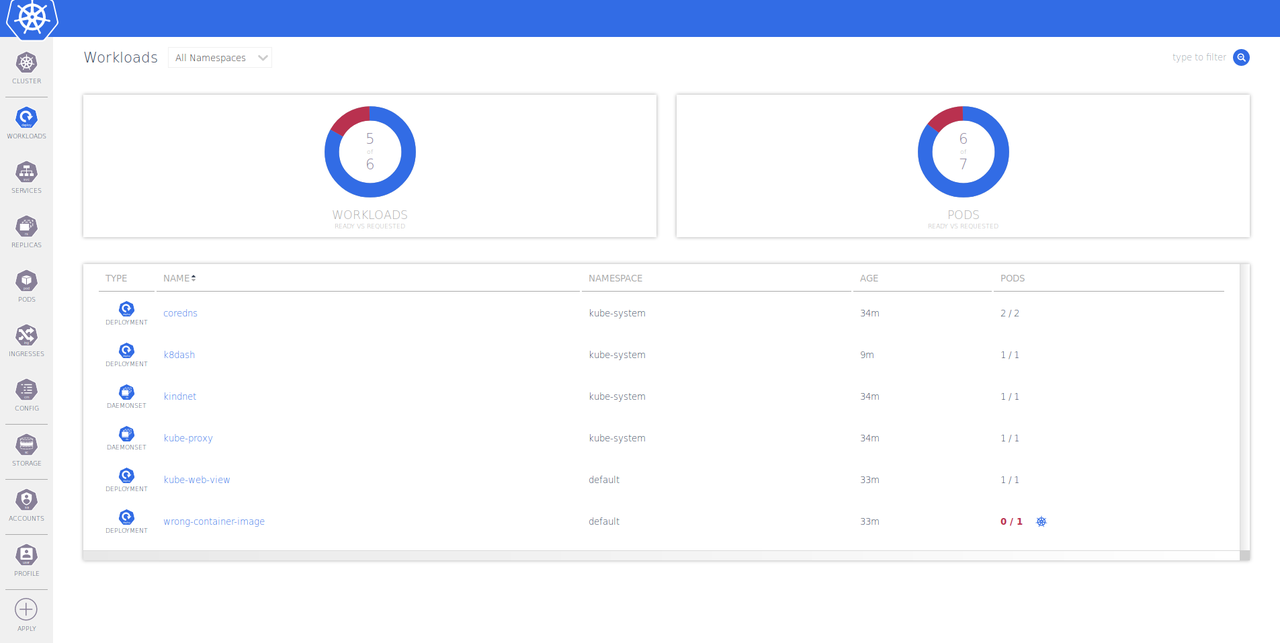
K8Dash looks good and feels fast, but it has a number of disadvantages for the use cases listed above:
“Kubernator is an alternative UI for Kubernetes. Unlike the high-level Kubernetes Dashboard, it provides low-level control and an excellent overview of all objects in the cluster with the ability to create new ones, edit them and resolve conflicts. Being a fully client application (like kubectl), it does not require any backend except for the Kubernetes API server itself, and also takes into account the rules for accessing the cluster. "

This is a fairly accurate description of Kubernator . Alas, he lacks some features:
“Kubernetes Dashboard is a universal web interface for Kubernetes clusters. It allows users to manage and troubleshoot applications running in the cluster, as well as manage the cluster itself. ”
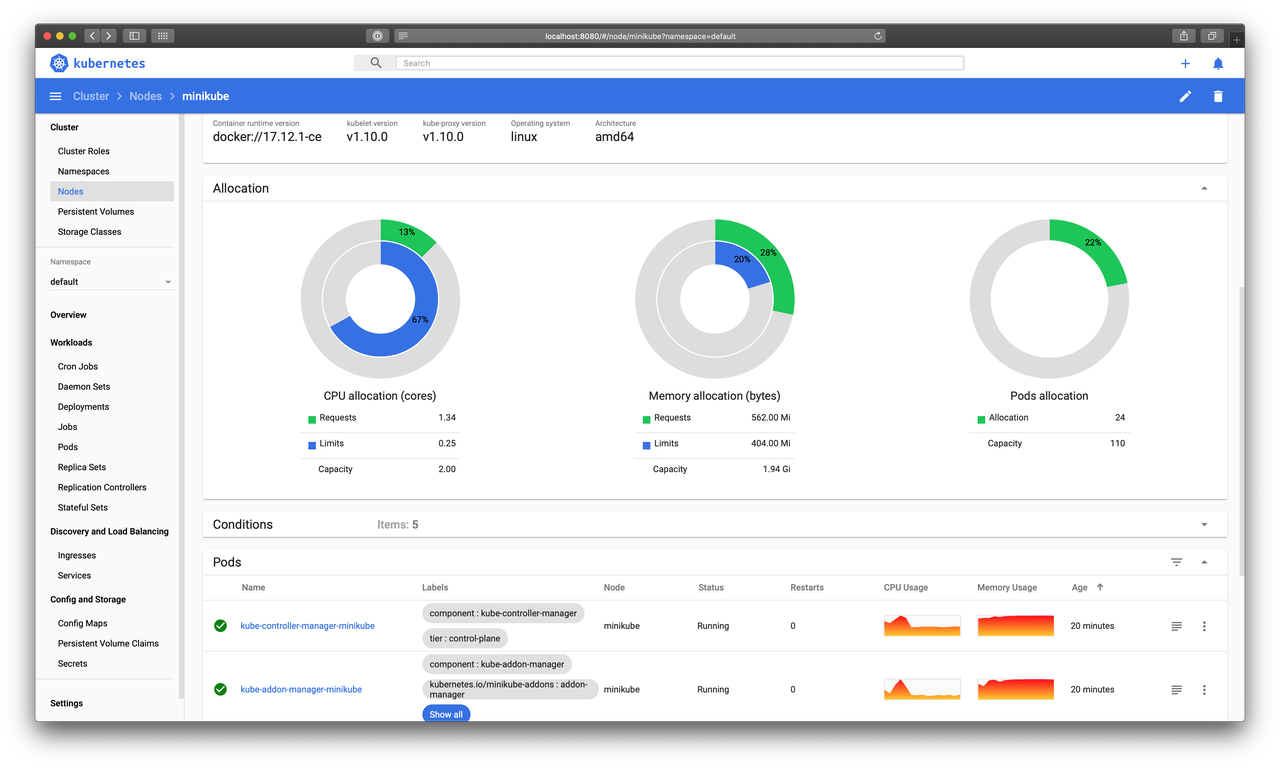
Unfortunately, Kubernetes Dashboard doesn’t help much in my incident support and response activities, because it:
“K8s Cluster Space Observer System Panel.”
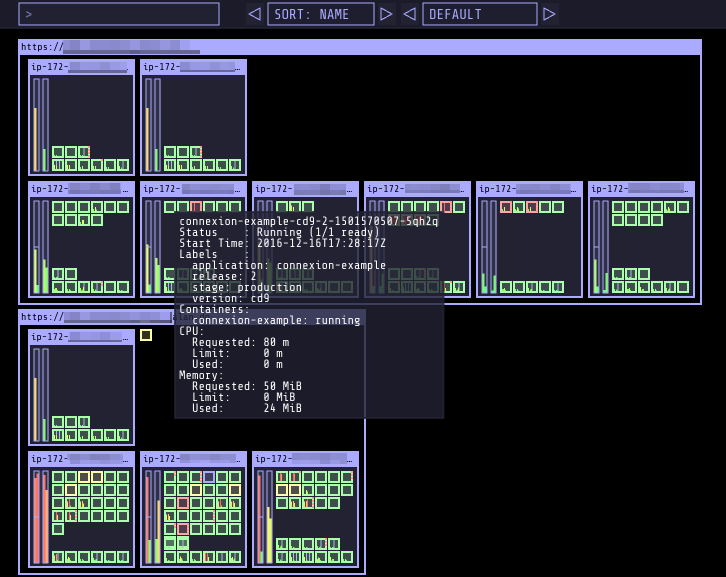
Kubernetes Operational View has a completely different approach: this tool only shows cluster nodes and pods using WebGL, without any textual details of the objects. It is great for an on-line overview of cluster status (“do pods fall?”) *, But not for the cases of support and incident response described above.
* Note perev. : In this sense, you might also be interested in our grafana-statusmap plugin , which we covered in more detail in this article .
"Gather information about resource requests from pods and Kubernetes clusters, compare them with resource consumption, and generate static HTML."
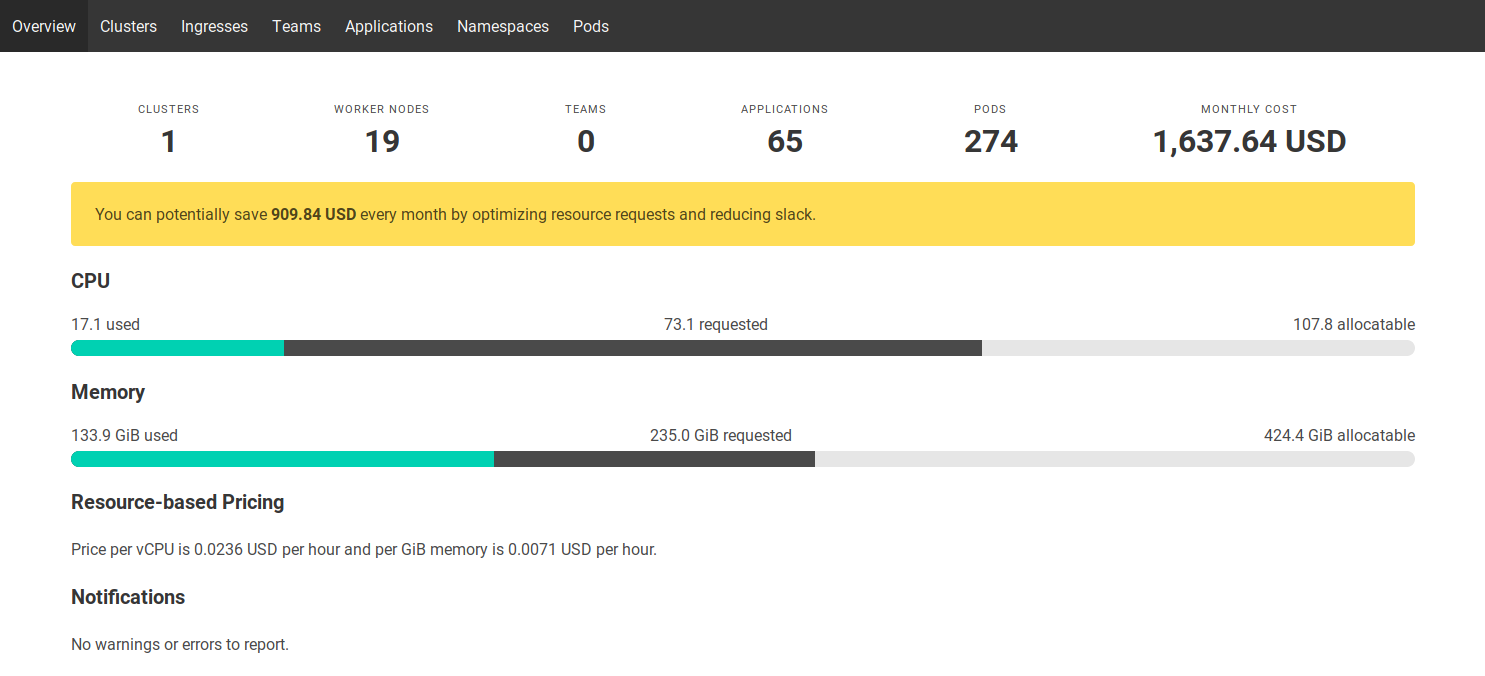
Kubernetes Resource Report generates static HTML reports on resource usage and cost distribution by teams / applications in clusters. The report is somewhat useful for supporting and responding to incidents, as it allows you to quickly find the cluster in which the application is deployed.
Note perev. : In viewing information about the distribution of resources and their cost from cloud providers, the Kubecost service and tool, which we recently published, may also be useful.
“An extensible web development platform designed to provide a better understanding of Kubernetes cluster complexity.”
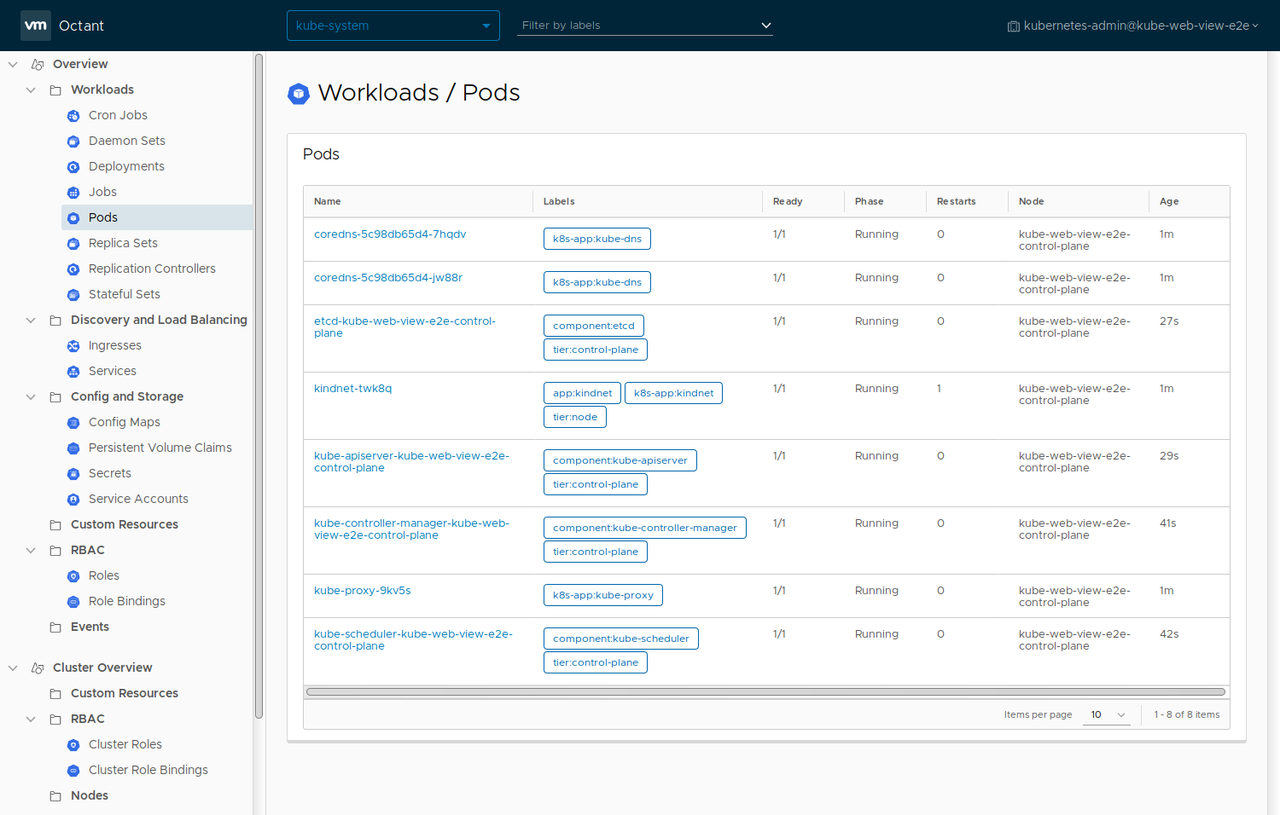
Octant , created in VMware, is a new product that I learned about relatively recently. Using it, it is convenient to examine the cluster on a local machine (there are even visualizations), however, it only touches upon the problems of support and response to incidents to a limited extent. Disadvantages of Octant:
I also had problems with Octant stability with Zalando clusters: it crashed on some CRDs.
"Kubectl for the web."
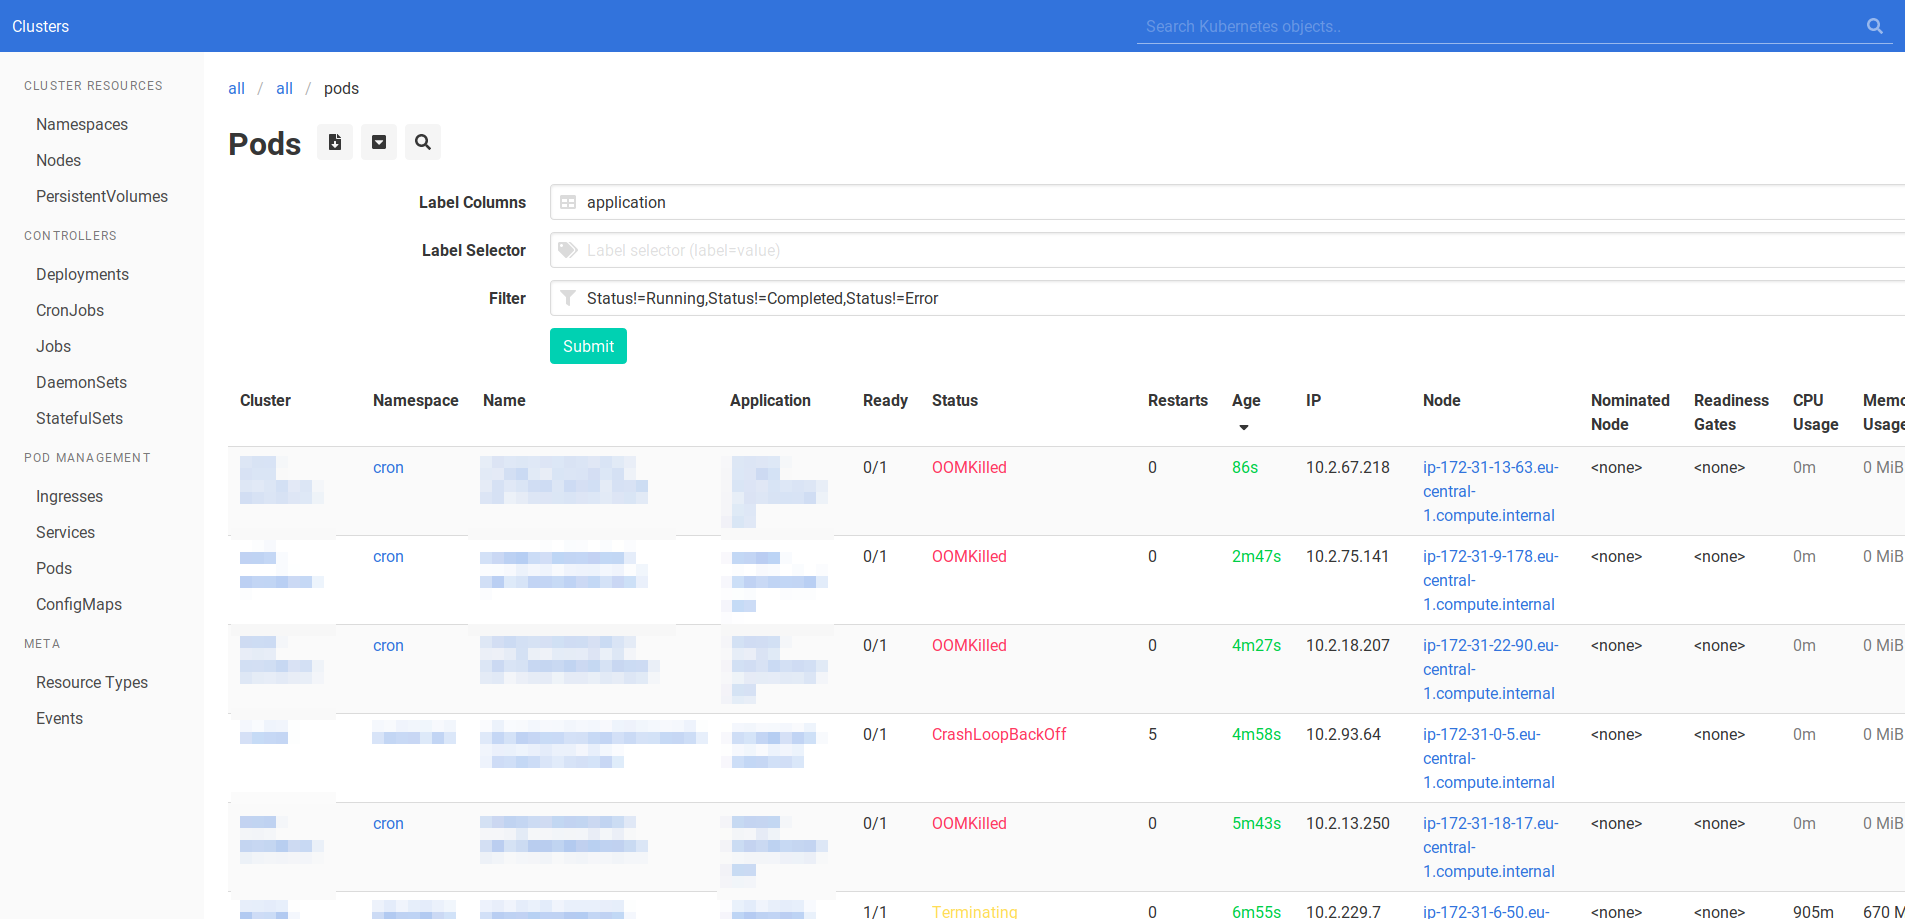
After analyzing the available interface options for Kubernetes, I decided to create a new one: Kubernetes Web View . Indeed, in fact, I just need all the power of
on the web, namely:
Outside of the non-goals solved by Kubernetes Web View, there are:
How does Kubernetes Web View help support and respond to incidents?

Cluster Search in Kubernetes Web View
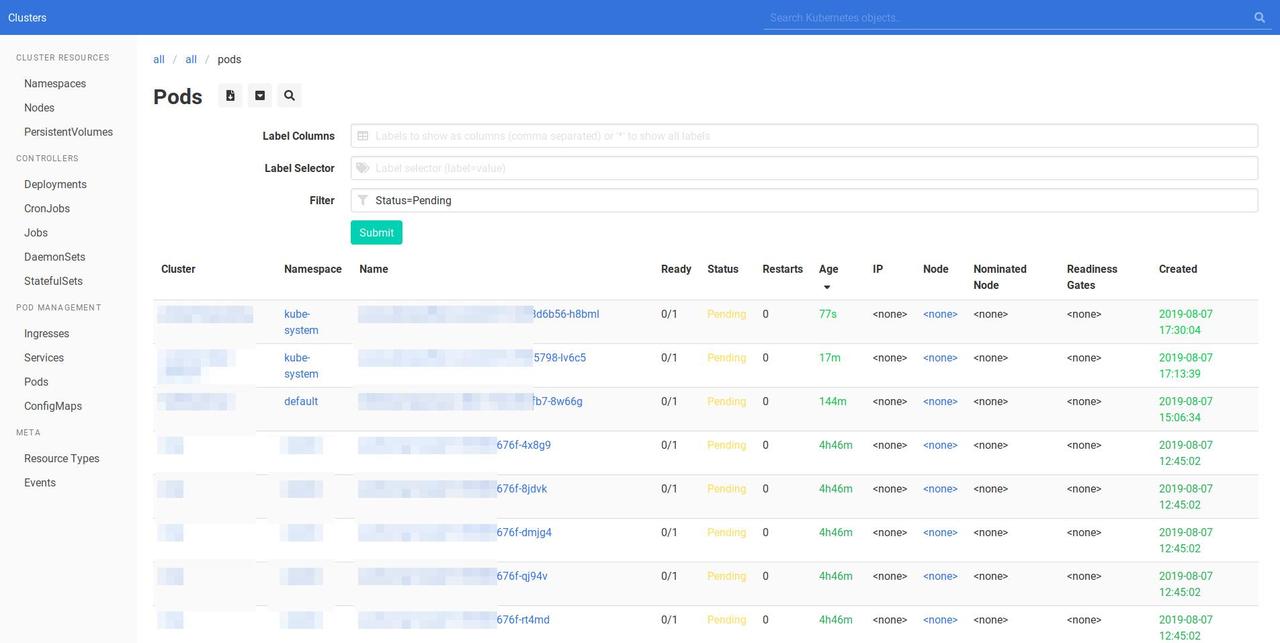
Kubernetes Web View: a list of pods with a Pending status in all clusters
If you want to try Kubernetes Web View, I recommend that you familiarize yourself with the documentation or look at the live demo version .
Of course, the interface could have been better, but for now Kubernetes Web View is a tool for "advanced users" who do not shy away from manually manipulating URL paths if necessary. If you have comments / additions / wishes, please contact me on Twitter !
This article is a brief account of the premises that led to the creation of Kubernetes Web View. Others will follow! ( Note transl .: They should be expected in the author's blog .)
Read also in our blog:

In this post, I look at the various open source Kubernetes web interfaces, present my requirements for a universal UI and explain why I developed Kubernetes Web View , an interface designed to make it easier to support and troubleshoot multiple clusters at once.
Use cases
At Zalando, we serve a large number of Kubernetes (900+) and cluster (100+) users. There are a couple of typical use cases where the help of a specialized web tool would be very useful:
- communication with colleagues in support;
- response to incidents and investigation of their causes.
Support
In my experience, communication within the framework of support often looks like this:
- Help, our XYZ service is unavailable!
- What do you see when you perform
kubectl describe ingress ...
?
Or something similar for CRD:
- I have some kind of problem with the identification service ...
- And what
kubectl describe platformcredentialsset ...
command
kubectl describe platformcredentialsset ...
?
This communication usually comes down to introducing various variations of the
kubectl
command to fix the problem. As a result, both sides of the conversation are forced to constantly switch between the terminal and web chat, plus they observe a different situation.
Therefore, I want the Kubernetes web frontend to allow the following:
- users could exchange links and observe the same thing;
- It would help to avoid human errors in support: for example, entering the wrong cluster on the command line, typos in CLI commands, etc.
- would allow you to generate your own views for sending to colleagues, that is, add label columns, display many types of resources on one page;
- Ideally, this web-based tool should allow you to put deep links to specific sections of YAML (for example, point to an invalid parameter that causes crashes).
Incident Response and Analysis
Responding to incidents in the infrastructure requires situational awareness, the ability to assess impact, and look for patterns in clusters. Some real life examples:
- the critical production service has problems and you need to find all Kubernetes resources by name in all clusters to fix the problems;
- nodes start to fall when scaling, and you need to find all pods with the status “Pending” in all clusters in order to assess the magnitude of the problem;
- individual users report a problem with DaemonSet deployed in all clusters, and it is necessary to find out if the problem is total .
My standard solution in such cases is something like
for i in $clusters; do kubectl ...; done
for i in $clusters; do kubectl ...; done
for i in $clusters; do kubectl ...; done
. Obviously, you can develop a tool that provides similar capabilities.
Existing Kubernetes Web Interfaces
The open source world of Kubernetes web interfaces is not too large *, so I tried to collect additional information using Twitter :

* My explanation of the limited number of web interfaces for Kubernetes: Kubernetes cloud services and vendors usually offer their own frontends, so the market for the “good” free Kubernetes UI is relatively small.
I tweeted about K8Dash , Kubernator, and Octant . Let's look at them and other existing Open Source-solutions, try to understand what they are.
K8Dash
“K8Dash is the easiest way to manage your Kubernetes cluster.”

K8Dash looks good and feels fast, but it has a number of disadvantages for the use cases listed above:
- It works only within the boundaries of one cluster.
- Sorting and filtering are possible, but do not have permalinks.
- There is no support for Custom Resource Definitions (CRDs).
Kubernator
“Kubernator is an alternative UI for Kubernetes. Unlike the high-level Kubernetes Dashboard, it provides low-level control and an excellent overview of all objects in the cluster with the ability to create new ones, edit them and resolve conflicts. Being a fully client application (like kubectl), it does not require any backend except for the Kubernetes API server itself, and also takes into account the rules for accessing the cluster. "

This is a fairly accurate description of Kubernator . Alas, he lacks some features:
- Serves only one cluster.
- There is no viewing mode in the form of a list (that is, it is impossible to display all pods with the “Pending” status).
Kubernetes Dashboard
“Kubernetes Dashboard is a universal web interface for Kubernetes clusters. It allows users to manage and troubleshoot applications running in the cluster, as well as manage the cluster itself. ”

Unfortunately, Kubernetes Dashboard doesn’t help much in my incident support and response activities, because it:
- there are no permalinks, for example, when I filter resources or change the sort order;
- there is no easy way to filter by status - for example, see all pods with the “Pending” status;
- only one cluster is supported;
- CRDs are not supported (this function is under development);
- no custom columns (e.g.
kubectl -L
).
Kubernetes Operational View (kube-ops-view)
“K8s Cluster Space Observer System Panel.”

Kubernetes Operational View has a completely different approach: this tool only shows cluster nodes and pods using WebGL, without any textual details of the objects. It is great for an on-line overview of cluster status (“do pods fall?”) *, But not for the cases of support and incident response described above.
* Note perev. : In this sense, you might also be interested in our grafana-statusmap plugin , which we covered in more detail in this article .
Kubernetes Resource Report (kube-resource-report)
"Gather information about resource requests from pods and Kubernetes clusters, compare them with resource consumption, and generate static HTML."

Kubernetes Resource Report generates static HTML reports on resource usage and cost distribution by teams / applications in clusters. The report is somewhat useful for supporting and responding to incidents, as it allows you to quickly find the cluster in which the application is deployed.
Note perev. : In viewing information about the distribution of resources and their cost from cloud providers, the Kubecost service and tool, which we recently published, may also be useful.
Octant
“An extensible web development platform designed to provide a better understanding of Kubernetes cluster complexity.”

Octant , created in VMware, is a new product that I learned about relatively recently. Using it, it is convenient to examine the cluster on a local machine (there are even visualizations), however, it only touches upon the problems of support and response to incidents to a limited extent. Disadvantages of Octant:
- No search by cluster.
- It works only on the local machine (not deployed to the cluster).
- Unable to sort / filter objects (only label selector is supported).
- You cannot specify custom columns.
- Cannot list objects by namespace.
I also had problems with Octant stability with Zalando clusters: it crashed on some CRDs.
Introducing Kubernetes Web View
"Kubectl for the web."

After analyzing the available interface options for Kubernetes, I decided to create a new one: Kubernetes Web View . Indeed, in fact, I just need all the power of
kubectl
on the web, namely:
- accessibility of all (read-only) operations in which users prefer to use kubectl;
- All URLs should be permanent and present the page in its original form, so that colleagues can share them and use in other tools;
- support for all Kubernetes objects, which will solve the problem of any type;
- resource lists should be downloadable for further work (in spreadsheets, CLI tools like
grep
) and storage (for example, for postmortem); - support for selecting resources by labels (similar to
kubectl get .. -l
); - the ability to create combined lists of various types of resources (similar to
kubectl get all
) to get a common operational picture among colleagues (for example, in the process of responding to an incident); - the ability to add customizable “smart” deep links to other tools, such as dashboards, loggers, application registries, etc. to facilitate troubleshooting / incident response;
- the frontend should be as simple as possible (pure HTML) to avoid accidental problems, for example, frozen JavaScript;
- support for multiple clusters to facilitate interaction during remote consulting (for example, to remember only one URL);
- if possible, situational analysis should be simplified (for example, with links to downloading resources for all clusters / namespaces);
- additional opportunities for creating flexible links and highlighting textual information, for example, so that colleagues can point to a specific section in the resource description (line in YAML);
- the ability to adapt to the requirements of a particular client, for example, allowing you to create special display templates for CRD, your own table views, change CSS styles;
- tools for further study on the command line (for example, showing full-fledged
kubectl
commands ready for copying);
Outside of the non-goals solved by Kubernetes Web View, there are:
- abstracting Kubernetes objects;
- application management (for example, deployment management, Helm charts, etc.);
- write operations (must be done through secure CI / CD and / or GitOps tools);
- beautiful interface (JavaScript, themes, etc.);
- visualizations (see kube-ops-view );
- cost analysis (see kube-resource-report ).
How does Kubernetes Web View help support and respond to incidents?
Support
- All links are permanent , which facilitates the exchange of information with colleagues.
- You can create your own views , for example, display all Deployments and Pods with a specific label in two specific clusters (several cluster names and resource types can be specified in the link, separated by commas).
- You can reference specific lines in the object's YAML file , indicating potential problems in the specification of the object.

Cluster Search in Kubernetes Web View
Incident response
- Global search allows you to search for objects in all clusters.
- List views can display all objects with a certain state / column in all clusters (for example, we need to find all pods with the “Pending” status).
- Lists of objects can be downloaded as tab delimited values (TSV) for later analysis.
- Customizable external links allow you to switch to the corresponding dashboards and other tools.

Kubernetes Web View: a list of pods with a Pending status in all clusters
If you want to try Kubernetes Web View, I recommend that you familiarize yourself with the documentation or look at the live demo version .
Of course, the interface could have been better, but for now Kubernetes Web View is a tool for "advanced users" who do not shy away from manually manipulating URL paths if necessary. If you have comments / additions / wishes, please contact me on Twitter !
This article is a brief account of the premises that led to the creation of Kubernetes Web View. Others will follow! ( Note transl .: They should be expected in the author's blog .)
PS from translator
Read also in our blog:
All Articles