Website development on WebAssembly using NetCore 3 and Blazor
My opinion is that WebAssembly is the future of the Internet. This technology is currently already integrated in most modern browsers (or rather in their engines) on PC and mobile devices. On browsers like Chrome, Edge, Firefox, and WebKit.
In this article, I will describe how to start developing a WebAssembly site in Visual Studio. This article is suitable for those who would like to understand how to start developing SPA applications without using JavaScript, knowing only asp.net mvc, c #, html and css layout.
At the time of this article's release, the NetCore 3 framework is in RC1 stage, and Blazor has version 3.0.0-preview9.19457.4. The release of NetCore 3 is scheduled for September 2019. As for Blazor, its release is promised later in November 2019, most likely after the release of NetCore 3.1
Table of contents:
- I Installation
- II Creating a WebAssembly project from a template
- III Structure of the decision
- IV Starting and debugging WebAssembly blazor
- V file sizes and linker
- VI Publishing and LazyLoading, element libraries
- VII Conclusions
I Installation (be sure to put the current version, after November 2019 most likely release)
- Visual Studio preview - visualstudio.microsoft.com/en/vs/preview
- Blazor template - devblogs.microsoft.com/aspnet/asp-net-core-and-blazor-updates-in-net-core-3-0-release-candidate-1
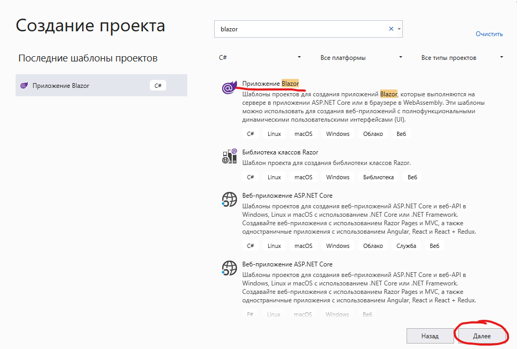
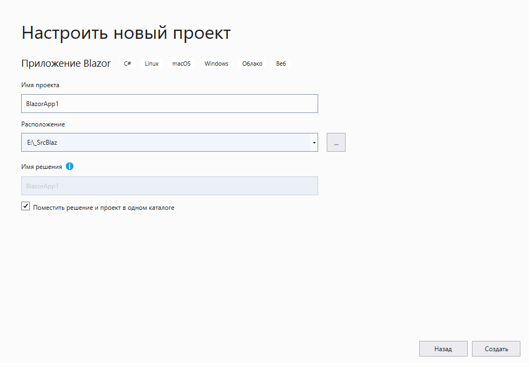
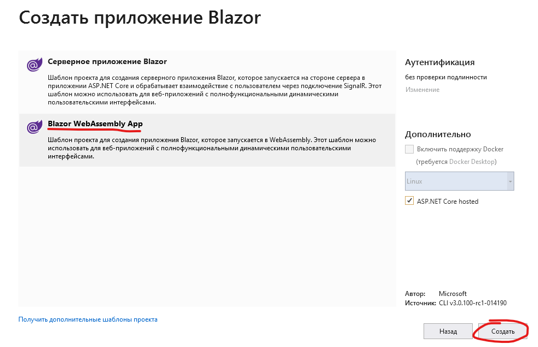
II Creating a WebAssembly project from a template
- Open VS preview 16.3 preview 4

- Create a new project. Select the Blazor Application template and specify the type of WebAssembly.
The process of creating in pictures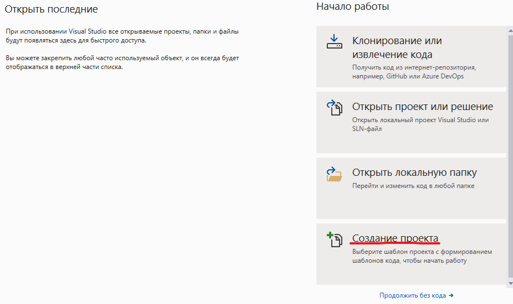
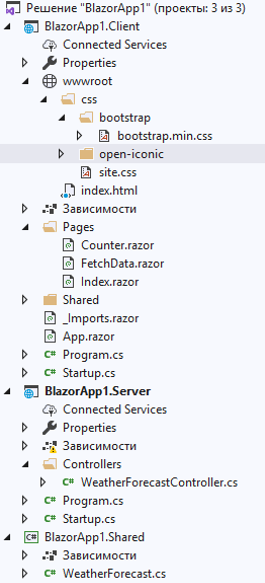
III Structure of the decision
As you can see, the default solution consists of 3 projects:
- This is a Client project, which contains html, css files, pictures, etc. Everything that will be loaded by the client (frontend). The Client project also contains code for creating the WebAssemly package.
- Server in this project contains the code of services that the client accesses for information (backend). The example implements weather information.
- Shared is used to store common data models for the first two projects.
IV Starting and debugging WebAssembly blazor
- Set two breakpoints. One in the client application code, the second in the server code of the service. You can immediately notice that the onclick button event calls C # code, not JavaScript. There is nothing unusual about the server code of the service.
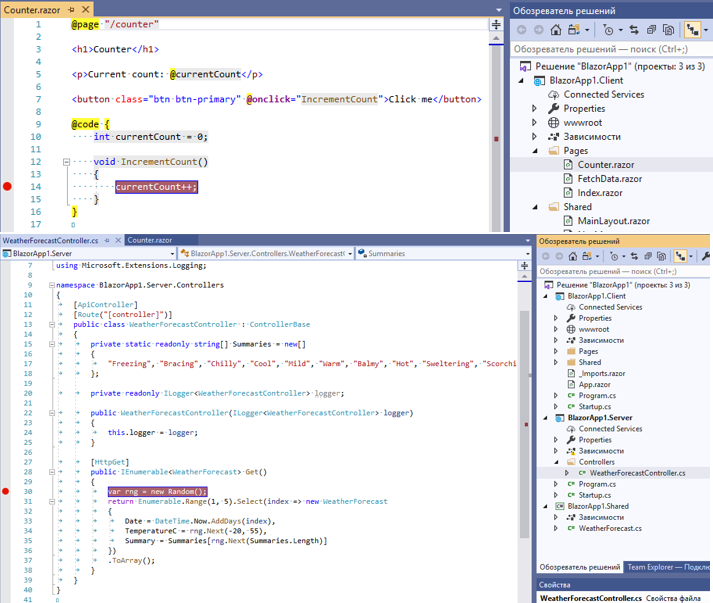
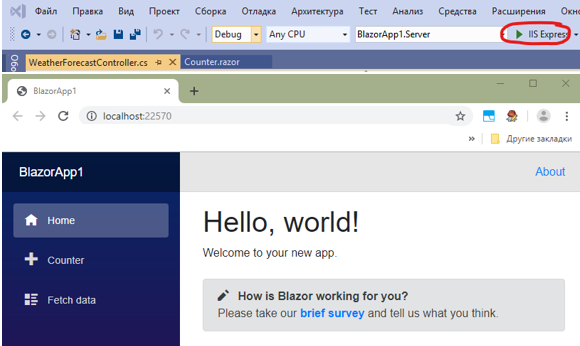
- Run the solution in debug build mode. After successful assembly, the browser will open and the website based on webassembly will load
- Let's try to go to the "Fetch data" section. This section contains the code making the request to the backend. As soon as we try to go to this section, the predefined breakpoint in the service controller will immediately work. The behavior is standard, nothing new. Continue code execution

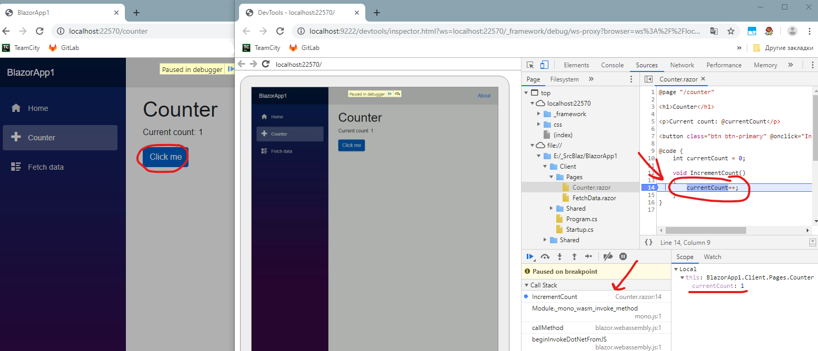
- Now go to the “Counter” section. Here is implemented code that is fully executed on the client. By clicking on the “click me” button, we get an unexpected result. The code will work (adding to current count 1), but the set breakpoint in the code will not work.
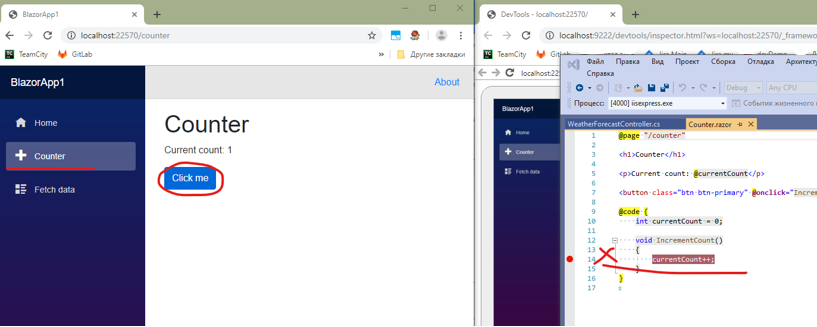
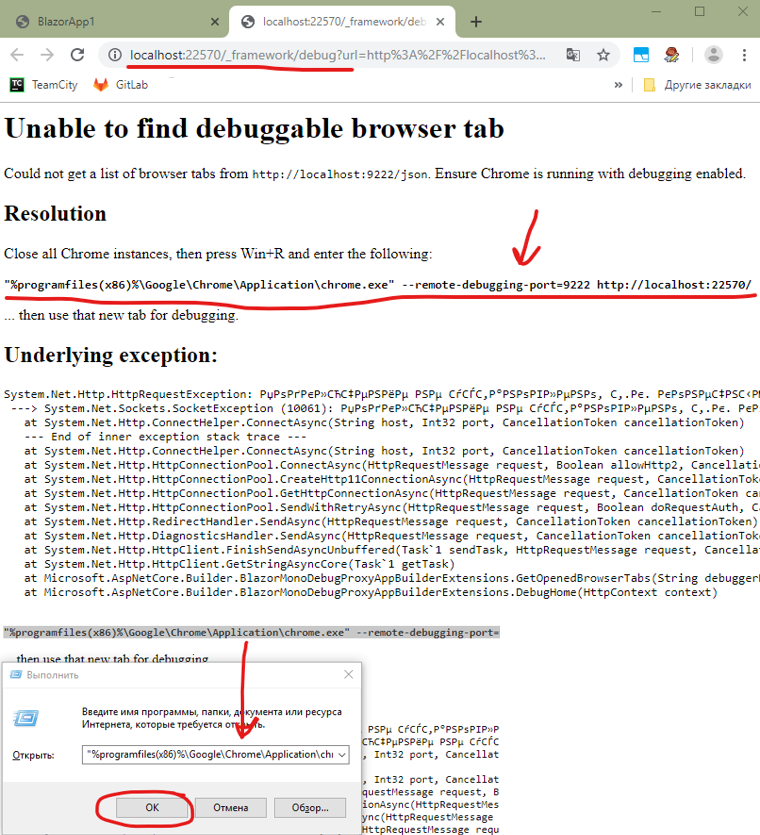
- The fact is that debugging a client application based on webassembly occurs in the browser. Just like JavaScript debugging. To do this, press shift + alt + D in the window with the site running. But there are several conditions.
The browser must have a direct connection with the running visual studio. To do this, Chrome must be running in debugging mode with access to the browser api through a specific port.
Copy the suggested line to launch the browser. Close all browser windows. And execute the previously copied line.
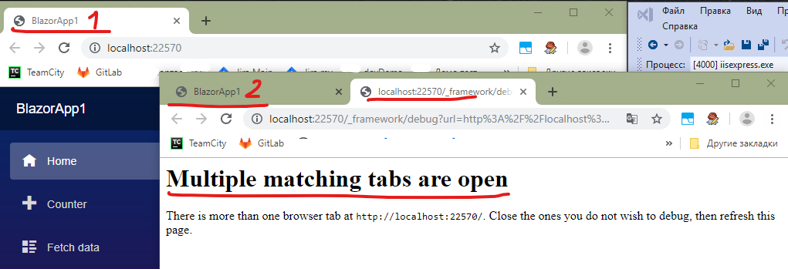
- Restart debugging. If you try to debug in chrome a client application opened several times, you will receive an error message. Leave only one open tab with the site and only one debug tab.
- On the debug tab, in the file structure you will see the files located on your disk. Where the source code is located. Now, going to the file “Counter.razor” we can set a breakpoint in the procedure called on the onclick event. When you click on the "Click me" button, a breakpoint will work, we will have access to the call stack and view the values of variables
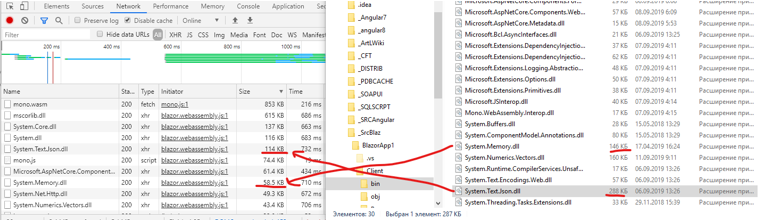
V file sizes and linker
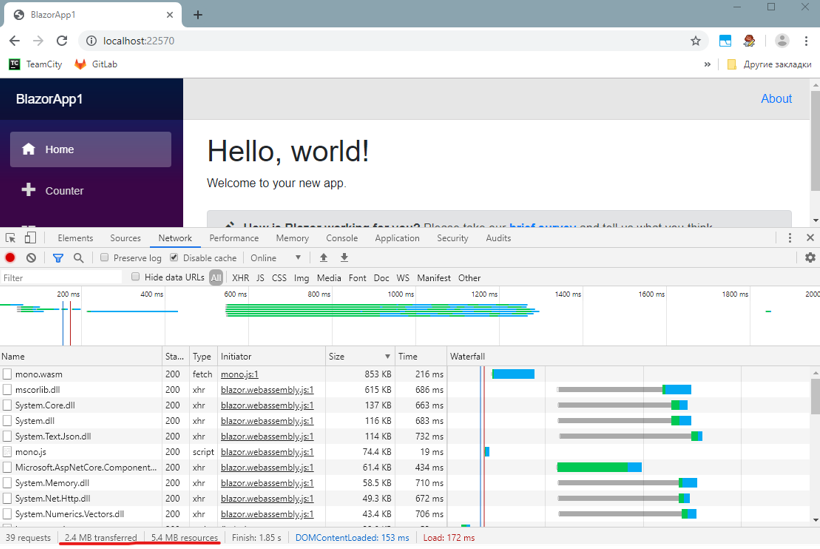
- As we see in the example, the sizes of the downloaded site data are quite small 2.4MB (after unpacking on the client 5.4MB). When the site is first loaded, the required DLLs are loaded for the site to work (an example is how to load JS libraries), later they are not reloaded, but are used from the browser cache.
- You should also pay attention to the fact that linker is used. This allows you to reduce the size of the resulting dll files, that is, unused code functions are automatically cut from the files.
For example, System.Text.Json.dll from 288KB became 114KB, and System.Memory.dll from 146KB became 58.5KB. This is ensured by the work of the linker, and also by compressing the transferred files.
Also, this process can be manually configured docs.microsoft.com/ru-ru/aspnet/core/host-and-deploy/blazor/configure-linker?view=aspnetcore-3.0
VI Publishing and LazyLoading, element libraries
- You can publish a site based on webassembly through IIS or ASP.NET Core engines. More details here .
- Although the WebAssembly technology itself allows you to download wasm files as requested by developers.google.com/web/updates/2018/04/loading-wasm .
Currently blazor does not have the ability to load dlls (wasm components) depending on the needs of a particular page. That is, all components will be downloaded the first time you access the site.
The recommendation is one - "Do not use complex libraries to implement a simple function that you write in three lines of code." Do not inherit 100 + MB dll in the client application for the sake of the possibility of a simple implementation of logging (reluctance to write 5 lines of code yourself).
The good news is that they promise to implement modular loading in core 3.1 - If you like to use ready-made components for the implementation of sites, then such collections of well-known companies as telerik, devexpress or for example the free package www.matblazor.com have already arrived for blazor
VII Conclusions
- Weassambly technology at the moment can already be fully used in website development.
- For comfortable working with blazor for Internet projects, LazyLoading is required. Which promise to add in the near future
- If the project is intranet, then the use of blazor in new developments will be welcome. It is not worth discussing in this vein that end PCs on the internal network can be with slow access, this can be solved using the RDP thin client.
- ASP.NET Core 3 + blazor is where the c # developer should develop
- I believe that this technology will lead to a complete rejection of javascript in the future, but this is my personal opinion.
All Articles