Maltego is closer to the body. Part 2
Hello dear friends. Here, finally, I got to writing the second article on Maltego. Who has not read the first - be sure to read here . In it I wrote what Maltego is in general, and in this article I will tell you what it is eaten with. There will be a lot of pictures.
This article is not quite a tutorial on how to work. Of course, I will try to show the maximum of unobvious things that I encountered in the process of working as a first priority, but the best way to get to know a framework is to just start using it and gain experience.
So, let's first break down the interface.
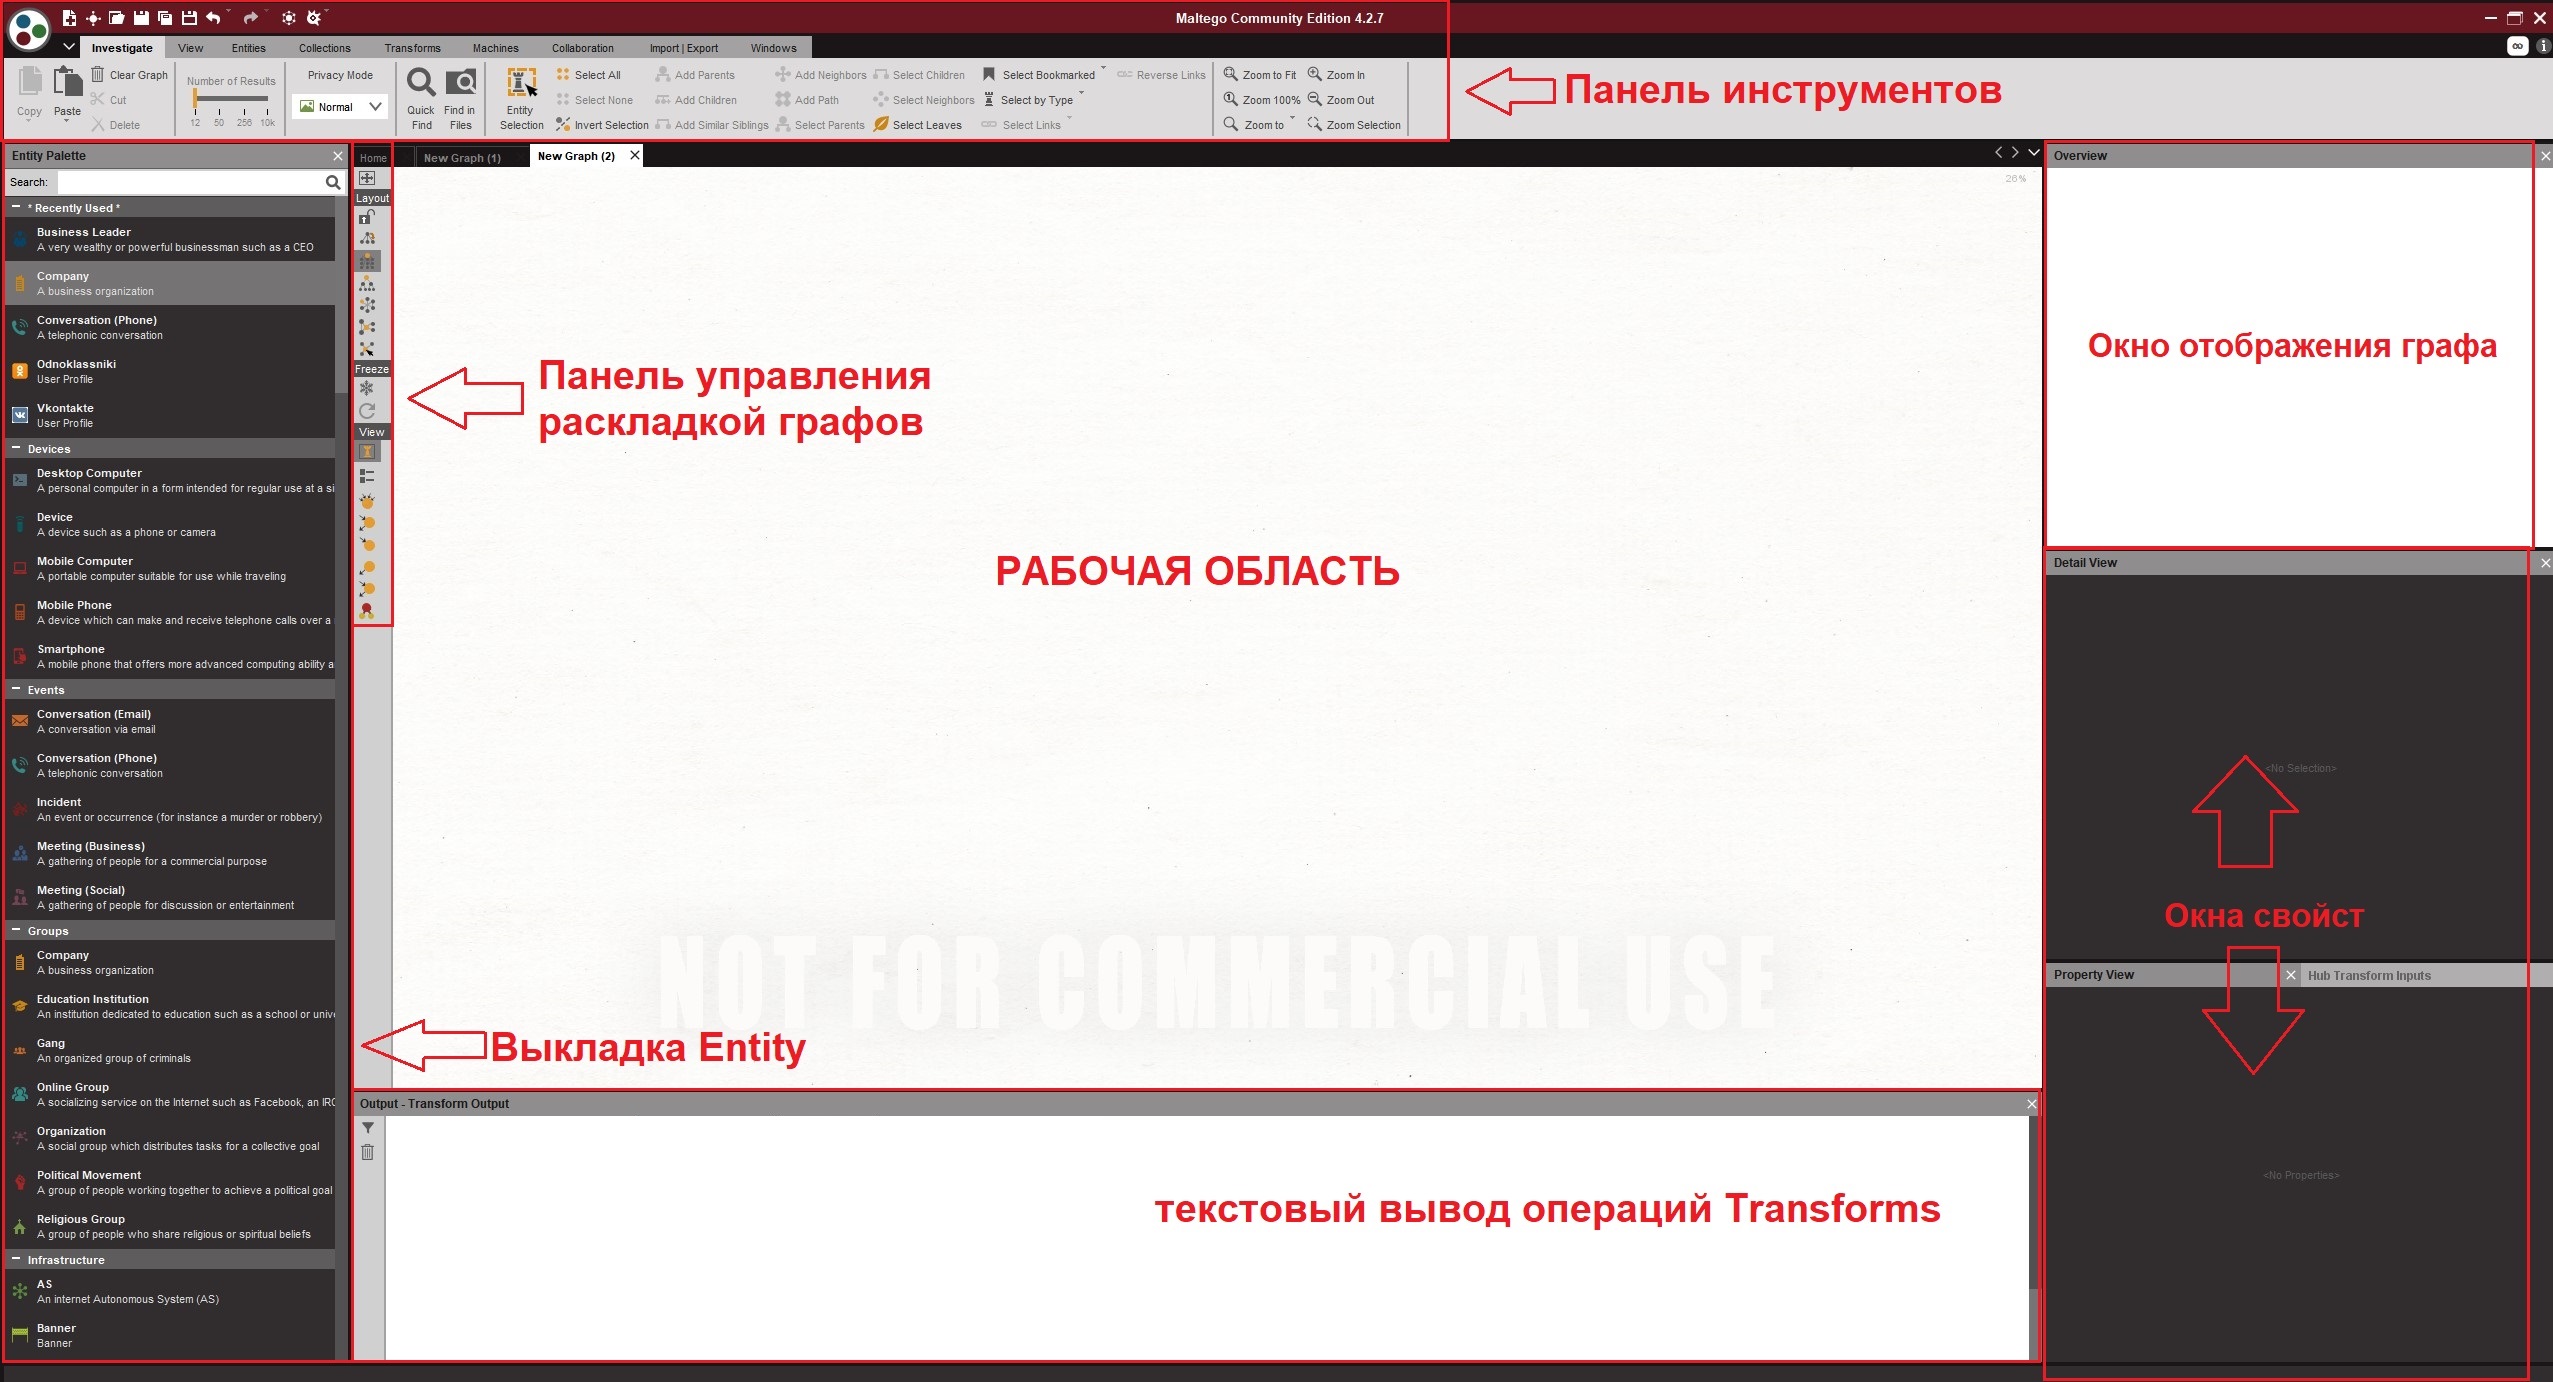
The workspace is the place where you will place all the elements of the graph (Entities) and connect them using links (Links);
Entity layout - here you will take objects for placement on the graph;
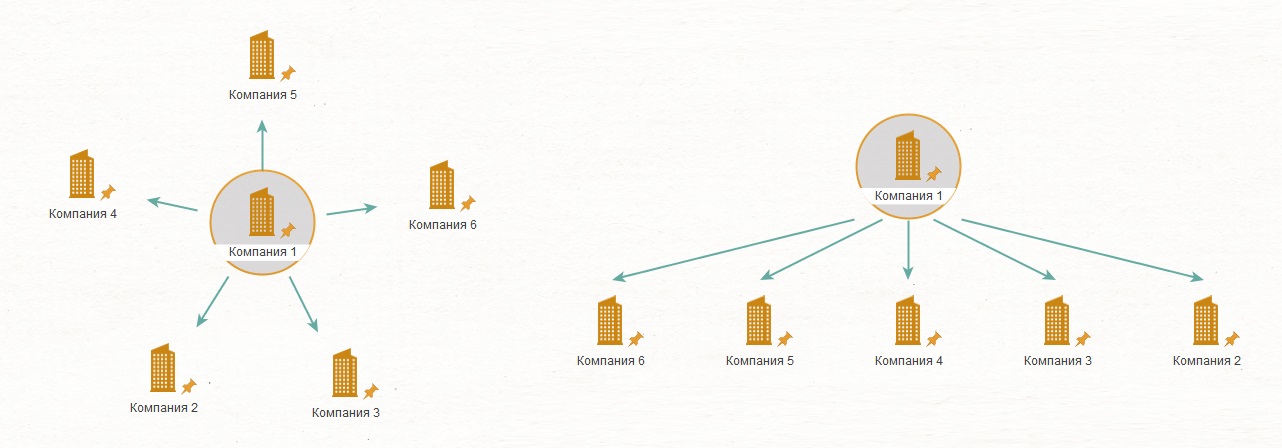
Graph layout control panel - if in the process you do not like the visual display of the graph, then using this panel you can change it. For example, from circular to hierarchical, as shown in the figure;
Toolbar - here we have concentrated all the basic functions for working with Maltego. We will talk about this panel a little later and in more detail;
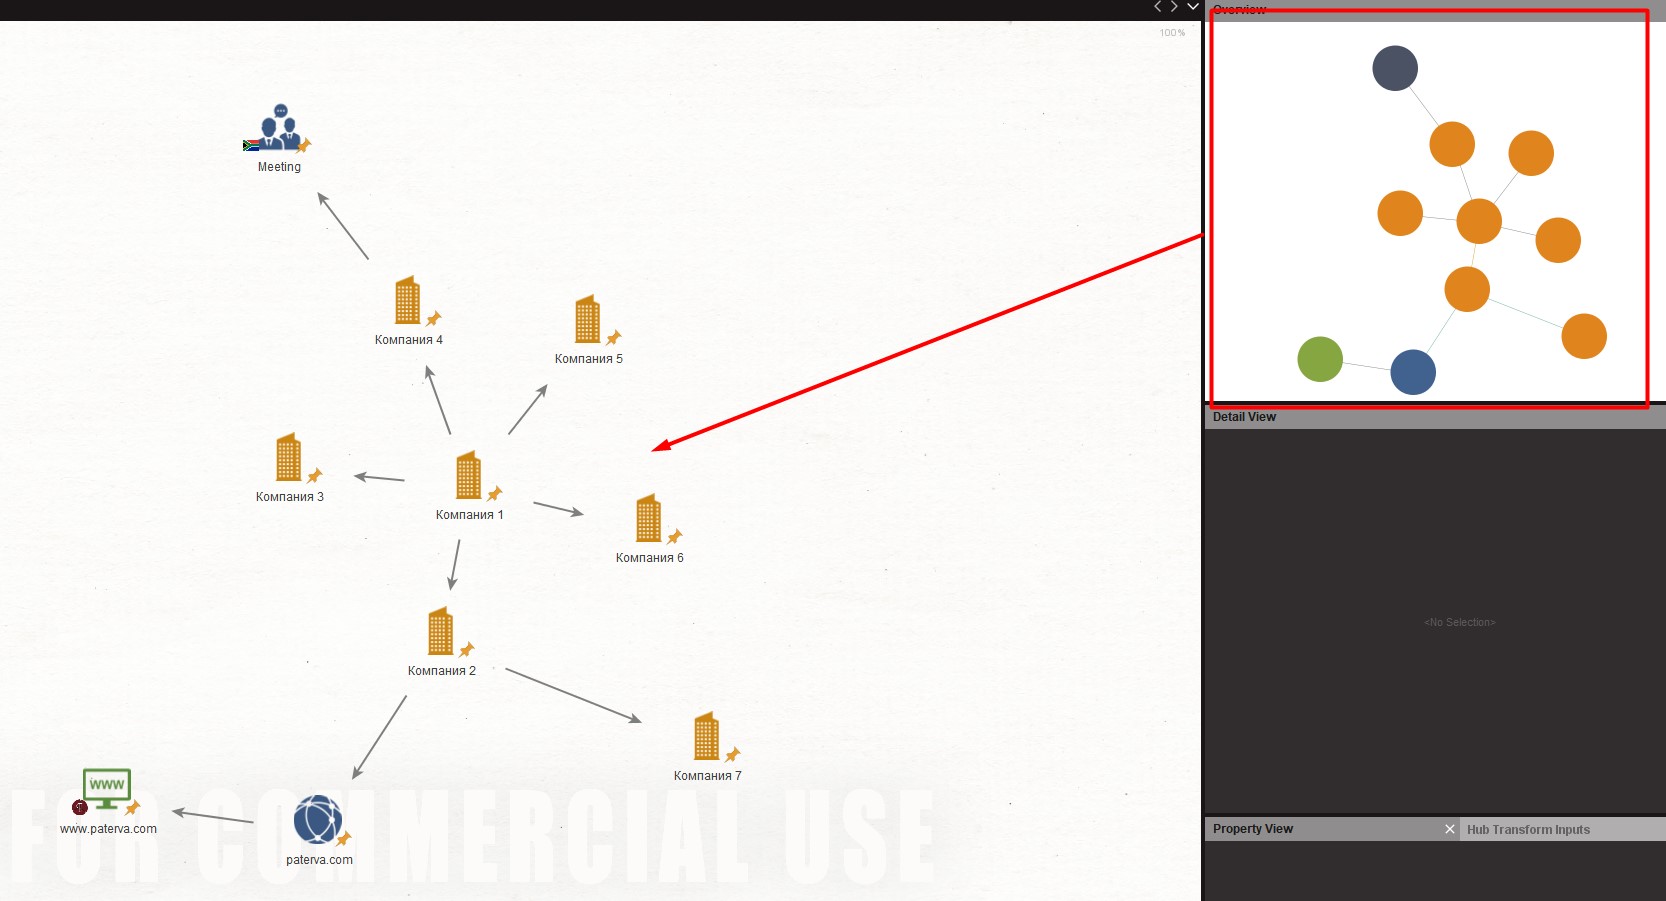
Graph display window - in it we can see a schematic reduced version of the graph in order to understand what part we are in. It is useless for small graphs, for a graph of medium and large length - it saves a lot of time when orienting between parts of graphs;
Property windows - here we see the properties of the object that we have currently selected. By the way, with the help of these windows you can quickly change them without opening the object window;

Transforms operations text output window - this shows the log of the execution of the Transforms that you started. If there are errors in the execution process, then this is where you will see them;

The basic interface seems to be everything. Now let's, as promised, take a closer look at the Toolbar

Here we have a bunch of tabs, and without each - nowhere)
Investigate - Tab for working with graph. It contains tools for selecting and searching for elements and groups of elements on a graph. However, the most interesting thing to pay attention to is what I highlighted.
The slider “Number of Results” is responsible for the number of added elements per graph upon completion of Transforms. Why is it important? Let me explain with an example: you launched Transform, which should unload you the accounts of all the person’s friends in VK. A person has 100 friends. If you do not switch the slider to display more results, then Transform will unload only 12 (VK accounts) and will not even give an error. And you will puzzle why a person has 100 friends in VK, and Maltego unloads not what you see.
Another function I noted is responsible for highlighting relationships. For a beginner, finding how to isolate and remove erroneous or unnecessary relationships between objects can be a real challenge. And the function is in the most prominent place. Why the separation of objects and relationships are separated is a mystery, shrouded in darkness.
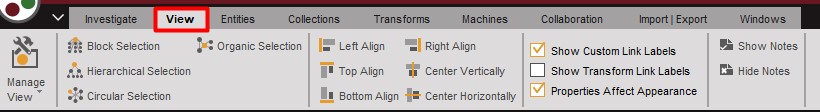
View - everything follows from the name. Some functions duplicate the graph layout control panel. The rest helps with orientation.
Entities - tab for working on objects. Here we can customize the current objects and even add our own.

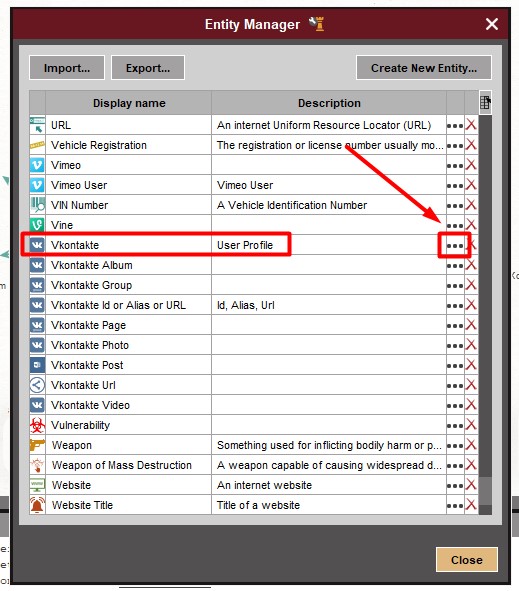
And here it is worth paying special attention to the Manage Entities section. It is not clear why, but initially not all available objects are placed in the Entity Layout. I understand it sounds strange, but fact is a fact. The most eloquent example is the objects of profiles of social networks. By default, we have only Twitter and Facebook in the calculation. And even a search by calculation does not help. To display the missing elements, you need to do the following:
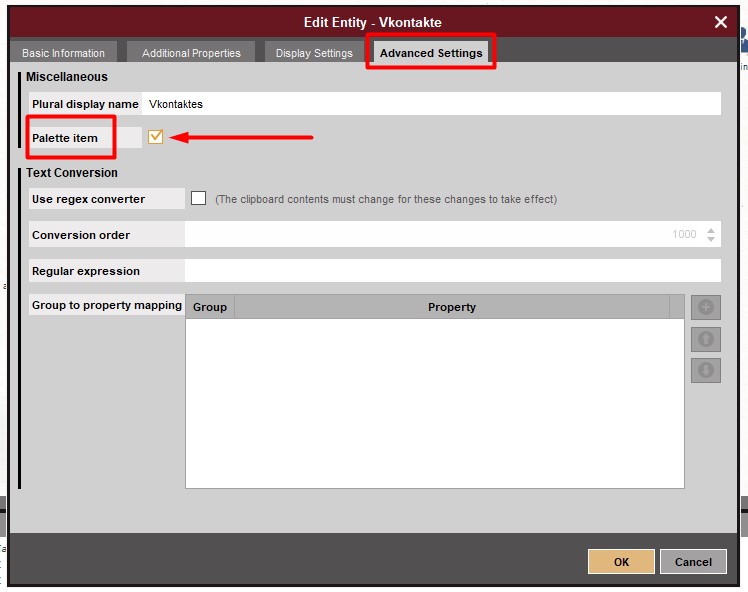
3. An object editing window will open, and in it go to the “AdvancedSettings” tab and put a check in the “PaletteItem” check box;
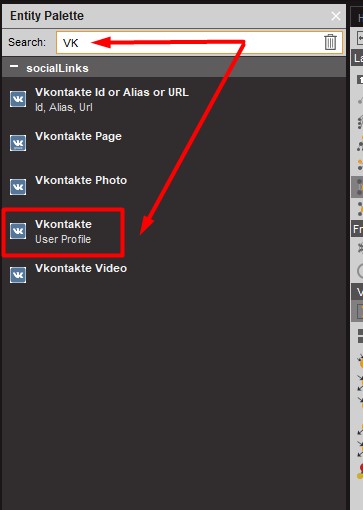
4. PROFIT! Now the object we need is available in the calculation window.
Collections - a tab that determines the order of grouping of the same type of elements.

Maltego for convenience of display can group elements of the same type. This simplifies the graph when working with large arrays of elements. Agree, it’s easier than, for example, 1000 VK accounts scattered around the column ...
Transforms - similar to Entities, this tab allows you to edit Transforms or add your own. Needed for those involved in the development of Transforms. If you do not indulge in this, then for you it is not very informative.

Machines - but this is an interesting tab. On it, we can run and create Machines. This is an automated sequence of Transforms that matches the concept of finding information on an object.


Now I’ll explain everything more simply.
Here is, for example, a company. And there is a concept of finding information about it. That is, first we make Transform, which searches for all the domains of this company, then we upload the info by domain, then - what kind of mail is in open sources under such domains ... I think you got the idea.
Machines is something like the Transforms sequence that we need to do in order to get all the available information on the company.
Collaboration - this tab helps us stir up collaborative behavior. Yes! YES! In Maltego, even in the Community version, it is possible for several people to work simultaneously on a project.

To work in this case, the Paterva public server will be used. The data is encrypted using the key that you enter when sharing the chart. In paid releases of Maltego, there is an option to set up a private server with the same Paterva or even raise your own with blackjack and courtesans.
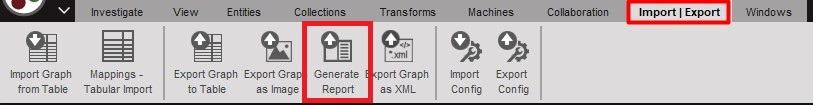
Import | Export - is responsible for the functions of input and output of information on and from the graph, respectively. We are especially interested in the “GenerateReport” function, which will not only throw info in us, but also structure it into a report and let it muddle everything in PDF. In general, beauty and more.
Windows is the last in the queue, but not the last by value. If you accidentally clicked some kind of cross and closed any window, then here you are. It is on this tab that we can turn on again any window that was accidentally closed.

That, in principle, is all that I wanted to tell about the Maltego interface, without going into the wilds. I hope this article will be useful to you. Especially for those who are just starting to work and learn this program. Personally, I at one time drank a lot of blood searching for how to display the necessary objects in the calculation.
END OF SECOND PART. Do not miss the new part, in which we will look at several popular extensions (SocialLinks and DomainTools) for Maltego and check what you can do with them ...
This article is not quite a tutorial on how to work. Of course, I will try to show the maximum of unobvious things that I encountered in the process of working as a first priority, but the best way to get to know a framework is to just start using it and gain experience.
So, let's first break down the interface.
The workspace is the place where you will place all the elements of the graph (Entities) and connect them using links (Links);
Entity layout - here you will take objects for placement on the graph;
Graph layout control panel - if in the process you do not like the visual display of the graph, then using this panel you can change it. For example, from circular to hierarchical, as shown in the figure;
Toolbar - here we have concentrated all the basic functions for working with Maltego. We will talk about this panel a little later and in more detail;
Graph display window - in it we can see a schematic reduced version of the graph in order to understand what part we are in. It is useless for small graphs, for a graph of medium and large length - it saves a lot of time when orienting between parts of graphs;
Property windows - here we see the properties of the object that we have currently selected. By the way, with the help of these windows you can quickly change them without opening the object window;
Transforms operations text output window - this shows the log of the execution of the Transforms that you started. If there are errors in the execution process, then this is where you will see them;
The basic interface seems to be everything. Now let's, as promised, take a closer look at the Toolbar
Here we have a bunch of tabs, and without each - nowhere)
Investigate - Tab for working with graph. It contains tools for selecting and searching for elements and groups of elements on a graph. However, the most interesting thing to pay attention to is what I highlighted.
The slider “Number of Results” is responsible for the number of added elements per graph upon completion of Transforms. Why is it important? Let me explain with an example: you launched Transform, which should unload you the accounts of all the person’s friends in VK. A person has 100 friends. If you do not switch the slider to display more results, then Transform will unload only 12 (VK accounts) and will not even give an error. And you will puzzle why a person has 100 friends in VK, and Maltego unloads not what you see.
Another function I noted is responsible for highlighting relationships. For a beginner, finding how to isolate and remove erroneous or unnecessary relationships between objects can be a real challenge. And the function is in the most prominent place. Why the separation of objects and relationships are separated is a mystery, shrouded in darkness.
View - everything follows from the name. Some functions duplicate the graph layout control panel. The rest helps with orientation.
Entities - tab for working on objects. Here we can customize the current objects and even add our own.
And here it is worth paying special attention to the Manage Entities section. It is not clear why, but initially not all available objects are placed in the Entity Layout. I understand it sounds strange, but fact is a fact. The most eloquent example is the objects of profiles of social networks. By default, we have only Twitter and Facebook in the calculation. And even a search by calculation does not help. To display the missing elements, you need to do the following:
- Go to the Manage Entities window;
- In the window that appears, find the object we need and click on 3 points near it;
3. An object editing window will open, and in it go to the “AdvancedSettings” tab and put a check in the “PaletteItem” check box;
4. PROFIT! Now the object we need is available in the calculation window.
Collections - a tab that determines the order of grouping of the same type of elements.
Maltego for convenience of display can group elements of the same type. This simplifies the graph when working with large arrays of elements. Agree, it’s easier than, for example, 1000 VK accounts scattered around the column ...
Transforms - similar to Entities, this tab allows you to edit Transforms or add your own. Needed for those involved in the development of Transforms. If you do not indulge in this, then for you it is not very informative.
Machines - but this is an interesting tab. On it, we can run and create Machines. This is an automated sequence of Transforms that matches the concept of finding information on an object.
Now I’ll explain everything more simply.
Here is, for example, a company. And there is a concept of finding information about it. That is, first we make Transform, which searches for all the domains of this company, then we upload the info by domain, then - what kind of mail is in open sources under such domains ... I think you got the idea.
Machines is something like the Transforms sequence that we need to do in order to get all the available information on the company.
Collaboration - this tab helps us stir up collaborative behavior. Yes! YES! In Maltego, even in the Community version, it is possible for several people to work simultaneously on a project.
To work in this case, the Paterva public server will be used. The data is encrypted using the key that you enter when sharing the chart. In paid releases of Maltego, there is an option to set up a private server with the same Paterva or even raise your own with blackjack and courtesans.
Import | Export - is responsible for the functions of input and output of information on and from the graph, respectively. We are especially interested in the “GenerateReport” function, which will not only throw info in us, but also structure it into a report and let it muddle everything in PDF. In general, beauty and more.
Windows is the last in the queue, but not the last by value. If you accidentally clicked some kind of cross and closed any window, then here you are. It is on this tab that we can turn on again any window that was accidentally closed.
That, in principle, is all that I wanted to tell about the Maltego interface, without going into the wilds. I hope this article will be useful to you. Especially for those who are just starting to work and learn this program. Personally, I at one time drank a lot of blood searching for how to display the necessary objects in the calculation.
END OF SECOND PART. Do not miss the new part, in which we will look at several popular extensions (SocialLinks and DomainTools) for Maltego and check what you can do with them ...
All Articles