6 lessons learned from finding a solution to a massive problem at gitlab.com. Part 2
We present to your attention the second part of the translation of the material about the struggle of the gitlab.com team against the tyranny of time.

→ Here, by the way, is the first part .
At this point, we were not interested in simply raising the values of the
parameter. Although a 50% increase in this parameter proved to be good, its further increase without sufficient reason looked like a rather crude solution to the problem. Surely there was something else we could do.
Searches brought me to the HAProxy level, which was located in front of the SSH servers. HAProxy has a nice
option that affects the part of the system that accepts incoming requests. If this option is configured, it is used to limit the number of new TCP requests per second that the frontend sends to the backends, while leaving additional incoming connections to the TCP socket. If the speed of incoming requests exceeds the limit (changeable every millisecond), then new connections are simply delayed. The TCP client (in this case, SSH) simply sees the delay before establishing a TCP connection. This, in my opinion, is a very beautiful move. Until the speed at which requests are received, for too long periods of time, exceed the limit too much, the system will work well.
The next question was the selection of the value of the
option, which we should use. Finding an answer to this question was complicated by the fact that we have 27 SSH backends and 18 HAProxy frontends (16 main and 2 alt-ssh), as well as the fact that the frontends do not coordinate with each other with regard to request processing speed . In addition, we had to take into account how long the authentication step of the new SSH session takes. Suppose that the first value of
is 150. This means that if the authentication phase takes two seconds, then we can transfer each of the backends only 75 new sessions per second. Here you can find details about calculating the value of
, I will not go into details here. I only note that in order to calculate this value, four parameters must be taken into account. The first and second are the number of servers of both types. Third is the value of
. The fourth is
- how long does it take to authenticate an SSH session. The value of
extremely important, but it can only be deduced approximately. We did just that, leaving the result at a value of 2 seconds. As a result, we got the
value for the front-ends, which amounted to 112.5. We rounded it to 110.
And now, the new settings took effect. Perhaps you think that after this everything ended happily? It must be that the number of errors rushed to zero and everyone around was immensely happy? Well, actually it was far from so good. This change did not result in any visible changes in the error rate. Frankly, I was pretty upset. We have missed something important or misunderstood the essence of the problem.
As a result, we went back to the logs (and, finally, to the HAProxy information) and were able to make sure that the query processing speed limit at least works by acting on the queries as we expected. Previously, the corresponding indicators were higher, this allowed us to conclude that we successfully limited the speed with which incoming requests are sent for processing. But it was clear that the rate at which the requests arrived was still too high. Although it was also clear that it did not even come close to those levels when it could have a noticeable effect on the system. When we analyzed the process of selecting backends (according to the HAProxy logs), we noticed one weirdness there. At the beginning of the hour, backend connections were distributed unevenly across SSH servers. In the time interval chosen for analysis, the number of connections per second on different servers varied from 30 to 121. And this meant that our load balancing did not do its job well. Analysis of the configuration showed that we used the
option, so that a client with a specific IP address always connected to the same backend. This can be considered as a positive phenomenon in cases where session binding is needed. But we are dealing with SSH, so we do not need this. This option was once configured by us, but we did not find any hints on why this was done. We could not find a worthy reason to continue to use it. As a result, we decided to switch to
. Thanks to this option, new incoming connections give backends with a minimum number of current connections. This affected the use of processor resources by our SSH (Git) servers. Here is the corresponding schedule.
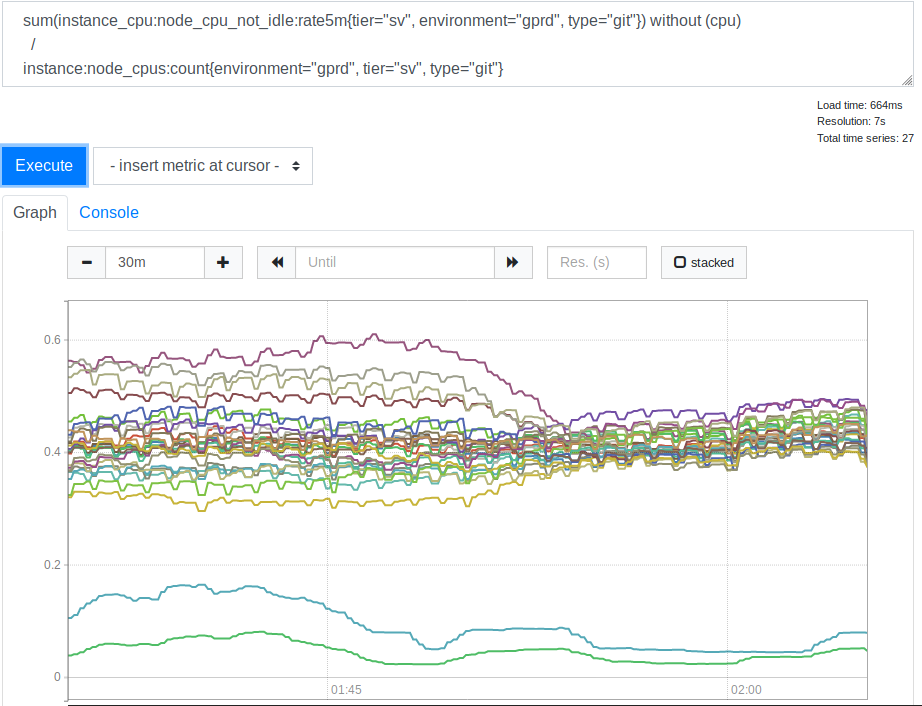
CPU consumption by servers before and after applying the leastconn option
After we saw this, we realized that using
is a good idea. The two lines that are at the bottom of the graph are our Canary servers, you can ignore them. But before, the spread of CPU load values for different servers was correlated as 2: 1 (from 30% to 60%). This clearly indicated that earlier some of our backends were loaded more than others due to the binding of clients to them. It came as a surprise to me. It seemed reasonable to expect that a wide range of client IP addresses was sufficient to load our servers much more evenly. But, apparently, in order to distort the server load indicators, several large clients were enough, the behavior of which differs from some average option.
Lesson number 4. When you select specific settings that differ from the default settings, comment on them or leave a link to the materials explaining the changes. Anyone who will have to deal with these settings in the future will be grateful to you for this.
This transparency is one of GitLab's core values .
Enabling the
option also helped reduce error levels. And that was exactly what we were striving for. Therefore, we decided to leave this option. But, continuing to experiment, they reduced the level of request processing speed limits to 100, which helped to further reduce the level of errors. This indicated that the initial selection of the value of
was probably performed incorrectly. But if so, then this indicator was too small, which led to a too strong speed limit, and even 100 requests per second was perceived as a very low value, and we were not ready to further reduce it. Unfortunately, for some internal reason, these two changes were just an experiment. We had to return to using the
option and to limit the processing speed of requests to 100 requests per second.
Given that the query processing speed was set to a low level that suits us, and that we could not use
, we tried to increase the
parameter. At first we increased it to 200, this gave some effect. Then - up to 250. Errors almost completely disappeared and nothing bad happened.
Lesson number 5. Although high MaxStartups may look intimidating, they have very little impact on performance even when they are much higher than the default values.
Perhaps this is something like a large and powerful lever, which we can, if necessary, use in the future. Perhaps we will encounter problems if we are talking about numbers in the region of several thousand or several tens of thousands, but we are still far from that.
What does this say about my estimates of the
parameter, the time it takes to set up and authenticate an SSH session? If you work with the formula for calculating the connection processing speed limit indicator, knowing that 200 is not quite enough for the
indicator, and 250 is enough, you can find out that
probably has a value from 2.7 to 3.4 seconds. As a result, an estimated value of 2 seconds was not far from the truth, but the real value, of course, was higher than expected. We will come back to this a bit later.
We again looked at the logs, taking into account what we already knew, and, after some thought, found out that the problem with which it all started could be identified by the following symptoms. Firstly, this is the
value equal to
. Secondly, this is the value of
(bytes read by the client), equal to 0. As already mentioned, we process approximately 26-28 million SSH connections per day. It was unpleasant to learn that, in the midst of the disaster, approximately 1.5% of these connections were grossly broken. Obviously, the scale of the problem was much larger than we thought at the very beginning. Moreover, there was nothing that we could not find earlier (even then, when we realized that
indicated the problem in the logs), but we did not think about how to do this, although we and you should think about it. Probably because of this, we spent much more time and effort on solving the problem than we could have spent.
Lesson number 6. Measure real error levels as early as possible.
If we were initially aware of the extent of the problem, we could pay more attention to it. Although, how to perceive it, still depends on the knowledge of the characteristics that allow us to describe the problems.
If we talk about the advantages that appeared after we increased the values of
and adjusted the speed of processing requests, then we can say that the level of errors decreased to 0.001%. That is - up to several thousand a day. This situation looked much better, but a similar level of errors was still higher than the one we would like to reach. After we figured out some things, we were again able to use the
option and the errors completely disappeared. After that, we were able to breathe a sigh of relief.
Obviously, the SSH authentication phase still takes a lot of time. Maybe up to 3.4 seconds. GitLab can use AuthorizedKeysCommand to directly search for an SSH key in a database. This is very important for quick operations when there are a large number of users. Otherwise, SSHD needs to sequentially read a very large
file to find the user's public key. This task does not scale well. We implemented a search using a certain amount of Ruby code that performs calls to an external HTTP API. Stan Hugh , the head of our engineering and technical services and an inexhaustible source of knowledge on GitLab, found out that Unicorn instances of Git / SSH servers are under constant load from requests made to them. This could make a significant contribution to the three seconds required to authenticate requests. As a result, we realized that in the future we should investigate this issue. Perhaps we will increase the number of Unicorn (or Puma) instances on these nodes so that SSH servers do not have to wait to access them. However, there is a certain risk, so we need to be careful and be careful about collecting and analyzing system indicators. Work on productivity continues, but now, after the main problem is solved, things are going slower. We may be able to reduce the value of
, but since its high level does not create the negative impact on the system that it seems to be creating, this is not particularly necessary. It will be much easier for everyone to live if OpenSSH can tell us at any time how close we are to the
limits. It will be better if we can always be in the know. This is much nicer than finding out that the limits are exceeded when faced with disconnected connections.
In addition, we need some kind of notification system when HAProxy log entries appear, indicating a problem with disconnected connections. The fact is that this, in practice, should not happen at all. If this happens again, we will need to continue to increase
values, or if we run into a lack of resources, we will need to add more Git / SSH nodes to the system.
Parts of complex systems interact in complex patterns. And in them, to solve various problems, one can often find far from one "lever". When dealing with such systems, it is useful to know about the tools present in them. The fact is that they all have their pros and cons. In addition, it should be noted that it may be risky to perform certain settings based on assumptions and estimated values. Now, looking at the path we have traveled, I would try to measure as accurately as possible the time required to complete the authentication of the request, which would lead to the approximate value of
that I deduced would be closer to the truth.
But the main lesson we learned from all of this is that when a lot of people plan tasks based on some nice time metrics, this, for centralized service providers like GitLab, leads to really unusual scaling problems.
If you are one of those who uses the scheduled task launch tools, then you might need to consider setting up the time for launching your tasks in a new way. For example, you can make the tasks “fall asleep” for a while, starting to really work only 30 seconds after launch. You can, for example, indicate random times within an hour in the task launch schedule (here you can add a random wait time before the actual execution of the task). This will help us all in the fight against the tyranny of watches.
Dear readers! Have you encountered problems similar to the one whose story this material is dedicated to?

→ Here, by the way, is the first part .
Request Processing Speed Limit
At this point, we were not interested in simply raising the values of the
MaxStartups
parameter. Although a 50% increase in this parameter proved to be good, its further increase without sufficient reason looked like a rather crude solution to the problem. Surely there was something else we could do.
Searches brought me to the HAProxy level, which was located in front of the SSH servers. HAProxy has a nice
rate-limit sessions
option that affects the part of the system that accepts incoming requests. If this option is configured, it is used to limit the number of new TCP requests per second that the frontend sends to the backends, while leaving additional incoming connections to the TCP socket. If the speed of incoming requests exceeds the limit (changeable every millisecond), then new connections are simply delayed. The TCP client (in this case, SSH) simply sees the delay before establishing a TCP connection. This, in my opinion, is a very beautiful move. Until the speed at which requests are received, for too long periods of time, exceed the limit too much, the system will work well.
The next question was the selection of the value of the
rate-limit sessions
option, which we should use. Finding an answer to this question was complicated by the fact that we have 27 SSH backends and 18 HAProxy frontends (16 main and 2 alt-ssh), as well as the fact that the frontends do not coordinate with each other with regard to request processing speed . In addition, we had to take into account how long the authentication step of the new SSH session takes. Suppose that the first value of
MaxStartups
is 150. This means that if the authentication phase takes two seconds, then we can transfer each of the backends only 75 new sessions per second. Here you can find details about calculating the value of
rate-limit sessions
, I will not go into details here. I only note that in order to calculate this value, four parameters must be taken into account. The first and second are the number of servers of both types. Third is the value of
MaxStartups
. The fourth is
T
- how long does it take to authenticate an SSH session. The value of
T
extremely important, but it can only be deduced approximately. We did just that, leaving the result at a value of 2 seconds. As a result, we got the
rate-limit
value for the front-ends, which amounted to 112.5. We rounded it to 110.
And now, the new settings took effect. Perhaps you think that after this everything ended happily? It must be that the number of errors rushed to zero and everyone around was immensely happy? Well, actually it was far from so good. This change did not result in any visible changes in the error rate. Frankly, I was pretty upset. We have missed something important or misunderstood the essence of the problem.
As a result, we went back to the logs (and, finally, to the HAProxy information) and were able to make sure that the query processing speed limit at least works by acting on the queries as we expected. Previously, the corresponding indicators were higher, this allowed us to conclude that we successfully limited the speed with which incoming requests are sent for processing. But it was clear that the rate at which the requests arrived was still too high. Although it was also clear that it did not even come close to those levels when it could have a noticeable effect on the system. When we analyzed the process of selecting backends (according to the HAProxy logs), we noticed one weirdness there. At the beginning of the hour, backend connections were distributed unevenly across SSH servers. In the time interval chosen for analysis, the number of connections per second on different servers varied from 30 to 121. And this meant that our load balancing did not do its job well. Analysis of the configuration showed that we used the
balance source
option, so that a client with a specific IP address always connected to the same backend. This can be considered as a positive phenomenon in cases where session binding is needed. But we are dealing with SSH, so we do not need this. This option was once configured by us, but we did not find any hints on why this was done. We could not find a worthy reason to continue to use it. As a result, we decided to switch to
leastconn
. Thanks to this option, new incoming connections give backends with a minimum number of current connections. This affected the use of processor resources by our SSH (Git) servers. Here is the corresponding schedule.
CPU consumption by servers before and after applying the leastconn option
After we saw this, we realized that using
leastconn
is a good idea. The two lines that are at the bottom of the graph are our Canary servers, you can ignore them. But before, the spread of CPU load values for different servers was correlated as 2: 1 (from 30% to 60%). This clearly indicated that earlier some of our backends were loaded more than others due to the binding of clients to them. It came as a surprise to me. It seemed reasonable to expect that a wide range of client IP addresses was sufficient to load our servers much more evenly. But, apparently, in order to distort the server load indicators, several large clients were enough, the behavior of which differs from some average option.
Lesson number 4. When you select specific settings that differ from the default settings, comment on them or leave a link to the materials explaining the changes. Anyone who will have to deal with these settings in the future will be grateful to you for this.
This transparency is one of GitLab's core values .
Enabling the
leastconn
option also helped reduce error levels. And that was exactly what we were striving for. Therefore, we decided to leave this option. But, continuing to experiment, they reduced the level of request processing speed limits to 100, which helped to further reduce the level of errors. This indicated that the initial selection of the value of
T
was probably performed incorrectly. But if so, then this indicator was too small, which led to a too strong speed limit, and even 100 requests per second was perceived as a very low value, and we were not ready to further reduce it. Unfortunately, for some internal reason, these two changes were just an experiment. We had to return to using the
balance source
option and to limit the processing speed of requests to 100 requests per second.
Given that the query processing speed was set to a low level that suits us, and that we could not use
leastconn
, we tried to increase the
MaxStartups
parameter. At first we increased it to 200, this gave some effect. Then - up to 250. Errors almost completely disappeared and nothing bad happened.
Lesson number 5. Although high MaxStartups may look intimidating, they have very little impact on performance even when they are much higher than the default values.
Perhaps this is something like a large and powerful lever, which we can, if necessary, use in the future. Perhaps we will encounter problems if we are talking about numbers in the region of several thousand or several tens of thousands, but we are still far from that.
What does this say about my estimates of the
T
parameter, the time it takes to set up and authenticate an SSH session? If you work with the formula for calculating the connection processing speed limit indicator, knowing that 200 is not quite enough for the
MaxStartups
indicator, and 250 is enough, you can find out that
T
probably has a value from 2.7 to 3.4 seconds. As a result, an estimated value of 2 seconds was not far from the truth, but the real value, of course, was higher than expected. We will come back to this a bit later.
Final steps
We again looked at the logs, taking into account what we already knew, and, after some thought, found out that the problem with which it all started could be identified by the following symptoms. Firstly, this is the
t_state
value equal to
SD
. Secondly, this is the value of
b_read
(bytes read by the client), equal to 0. As already mentioned, we process approximately 26-28 million SSH connections per day. It was unpleasant to learn that, in the midst of the disaster, approximately 1.5% of these connections were grossly broken. Obviously, the scale of the problem was much larger than we thought at the very beginning. Moreover, there was nothing that we could not find earlier (even then, when we realized that
t_state="SD"
indicated the problem in the logs), but we did not think about how to do this, although we and you should think about it. Probably because of this, we spent much more time and effort on solving the problem than we could have spent.
Lesson number 6. Measure real error levels as early as possible.
If we were initially aware of the extent of the problem, we could pay more attention to it. Although, how to perceive it, still depends on the knowledge of the characteristics that allow us to describe the problems.
If we talk about the advantages that appeared after we increased the values of
MaxStartups
and adjusted the speed of processing requests, then we can say that the level of errors decreased to 0.001%. That is - up to several thousand a day. This situation looked much better, but a similar level of errors was still higher than the one we would like to reach. After we figured out some things, we were again able to use the
leastconn
option and the errors completely disappeared. After that, we were able to breathe a sigh of relief.
Future work
Obviously, the SSH authentication phase still takes a lot of time. Maybe up to 3.4 seconds. GitLab can use AuthorizedKeysCommand to directly search for an SSH key in a database. This is very important for quick operations when there are a large number of users. Otherwise, SSHD needs to sequentially read a very large
authorized_keys
file to find the user's public key. This task does not scale well. We implemented a search using a certain amount of Ruby code that performs calls to an external HTTP API. Stan Hugh , the head of our engineering and technical services and an inexhaustible source of knowledge on GitLab, found out that Unicorn instances of Git / SSH servers are under constant load from requests made to them. This could make a significant contribution to the three seconds required to authenticate requests. As a result, we realized that in the future we should investigate this issue. Perhaps we will increase the number of Unicorn (or Puma) instances on these nodes so that SSH servers do not have to wait to access them. However, there is a certain risk, so we need to be careful and be careful about collecting and analyzing system indicators. Work on productivity continues, but now, after the main problem is solved, things are going slower. We may be able to reduce the value of
MaxStartups
, but since its high level does not create the negative impact on the system that it seems to be creating, this is not particularly necessary. It will be much easier for everyone to live if OpenSSH can tell us at any time how close we are to the
MaxStartups
limits. It will be better if we can always be in the know. This is much nicer than finding out that the limits are exceeded when faced with disconnected connections.
In addition, we need some kind of notification system when HAProxy log entries appear, indicating a problem with disconnected connections. The fact is that this, in practice, should not happen at all. If this happens again, we will need to continue to increase
MaxStartups
values, or if we run into a lack of resources, we will need to add more Git / SSH nodes to the system.
Summary
Parts of complex systems interact in complex patterns. And in them, to solve various problems, one can often find far from one "lever". When dealing with such systems, it is useful to know about the tools present in them. The fact is that they all have their pros and cons. In addition, it should be noted that it may be risky to perform certain settings based on assumptions and estimated values. Now, looking at the path we have traveled, I would try to measure as accurately as possible the time required to complete the authentication of the request, which would lead to the approximate value of
T
that I deduced would be closer to the truth.
But the main lesson we learned from all of this is that when a lot of people plan tasks based on some nice time metrics, this, for centralized service providers like GitLab, leads to really unusual scaling problems.
If you are one of those who uses the scheduled task launch tools, then you might need to consider setting up the time for launching your tasks in a new way. For example, you can make the tasks “fall asleep” for a while, starting to really work only 30 seconds after launch. You can, for example, indicate random times within an hour in the task launch schedule (here you can add a random wait time before the actual execution of the task). This will help us all in the fight against the tyranny of watches.
Dear readers! Have you encountered problems similar to the one whose story this material is dedicated to?
All Articles