Locks in PostgreSQL: 4. Locks in memory
Let me remind you that we have already talked about relationship locks, row-level locks , locks on other objects (including predicate ones), and the relationship of different types of locks.
Today I end this series with an article on memory locks . We’ll talk about spinlocks, lightweight locks and buffer locking, as well as expectations monitoring and sampling tools.
Unlike ordinary, “heavy” locks, lighter and cheaper (in terms of overhead) locks are used to protect structures in shared RAM.
The simplest of them are spin-locks or spinlocks . They are designed to capture for a very short time (several processor instructions) and protect individual sections of memory from simultaneous changes.
Spin locks are implemented based on the atomic instructions of the processor, such as compare-and-swap. They support a single exclusive mode. If the lock is busy, the waiting process performs an active wait - the command is repeated (“spinning” in the loop, hence the name) until it is executed successfully. This makes sense, since spin locks are used when the probability of conflict is rated as very low.
Spin locks do not provide detection of deadlocks (PostgreSQL developers are monitoring this) and do not provide any monitoring tools. By and large, the only thing we can do with spin locks is to know about their existence.
Next come the so-called light locks (lightweight locks, lwlocks).
They are captured for the short time it takes to work with a data structure (for example, a hash table or a list of pointers). As a rule, a light lock is not held for long, but in some cases, a light lock protects the I / O operations, so in principle, the time can turn out to be significant.
Two modes are supported: exclusive (for changing data) and shared (read-only). As such, there is no waiting queue: if several processes are waiting for the lock to be released, one of them will gain access more or less randomly. In systems with a high degree of parallelism and heavy load, this can lead to unpleasant effects (see, for example, discussion ).
A mechanism for checking deadlocks is not provided, this remains on the conscience of the kernel developers. However, light locks have monitoring tools, therefore, unlike spin locks, they can be "seen" (a little later I will show how).
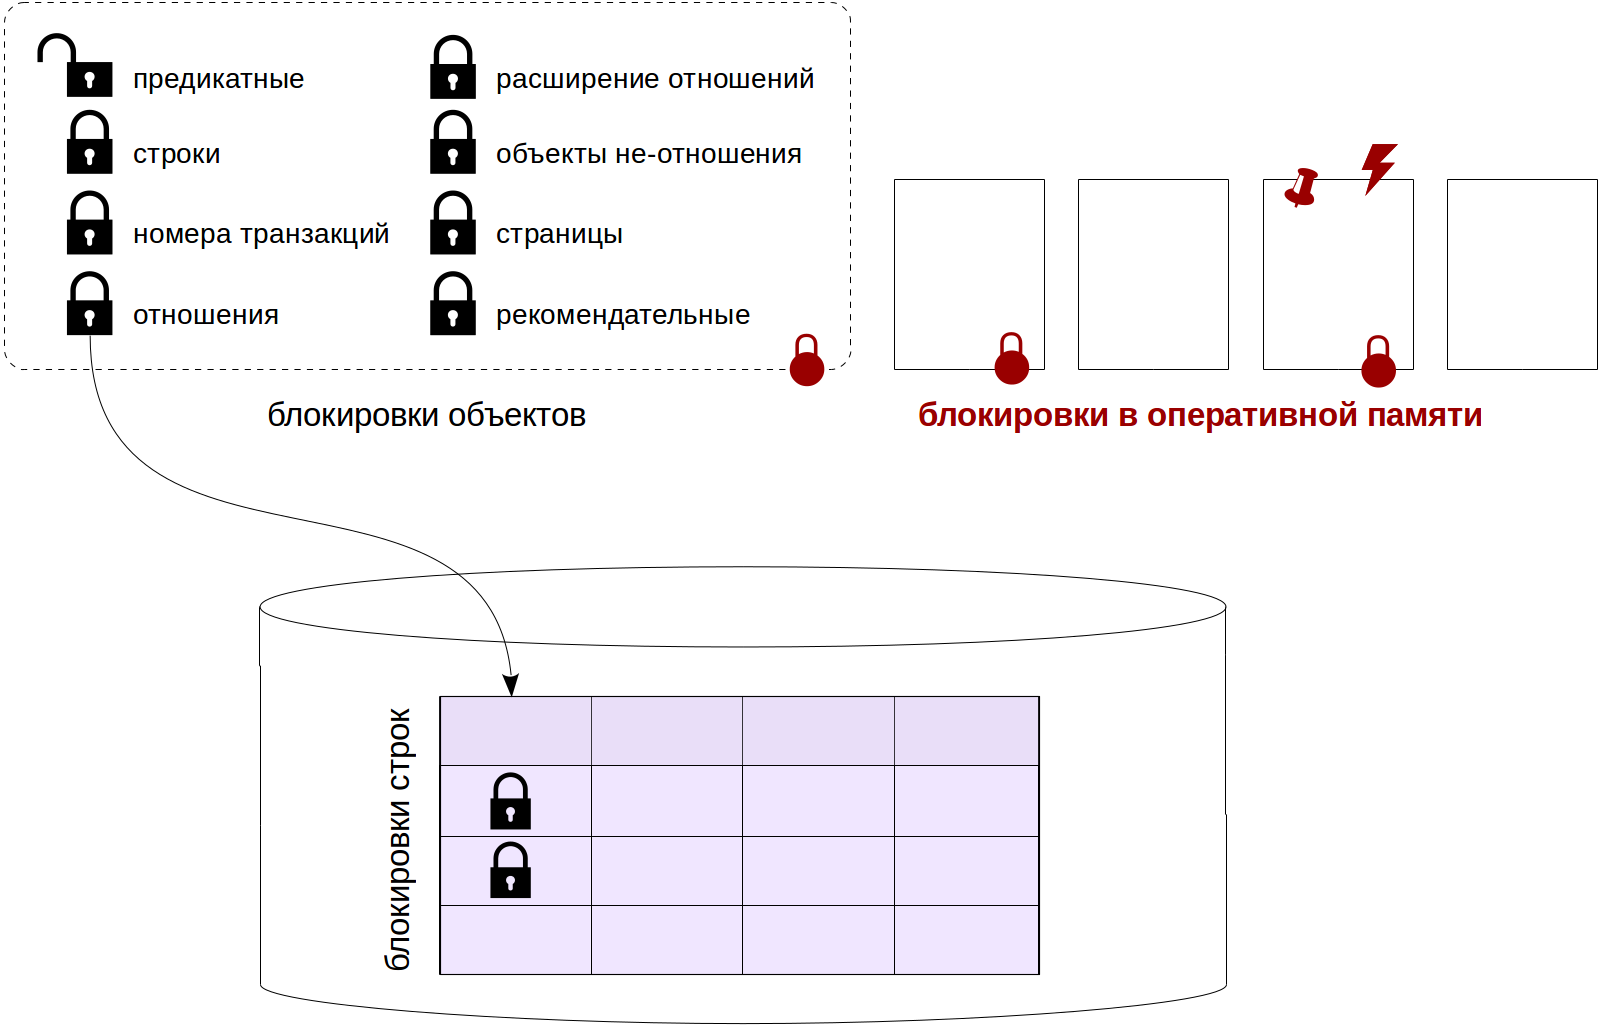
Another type of blocking that we have already discussed in the article about the buffer cache is buffer pinning .
With a fixed buffer, you can perform various actions, including changing data, but with the condition that these changes will not be visible to other processes due to multi-versioning. That is, say, you can add a new line to the page, but you cannot replace the page in the buffer with another.
If the process is hindered by the binding, it usually just skips such a buffer and selects another. But in some cases, when this particular buffer is required, the process queues and falls asleep - the system will wake it up when the binding is removed.
Consolidation expectations are available for monitoring.
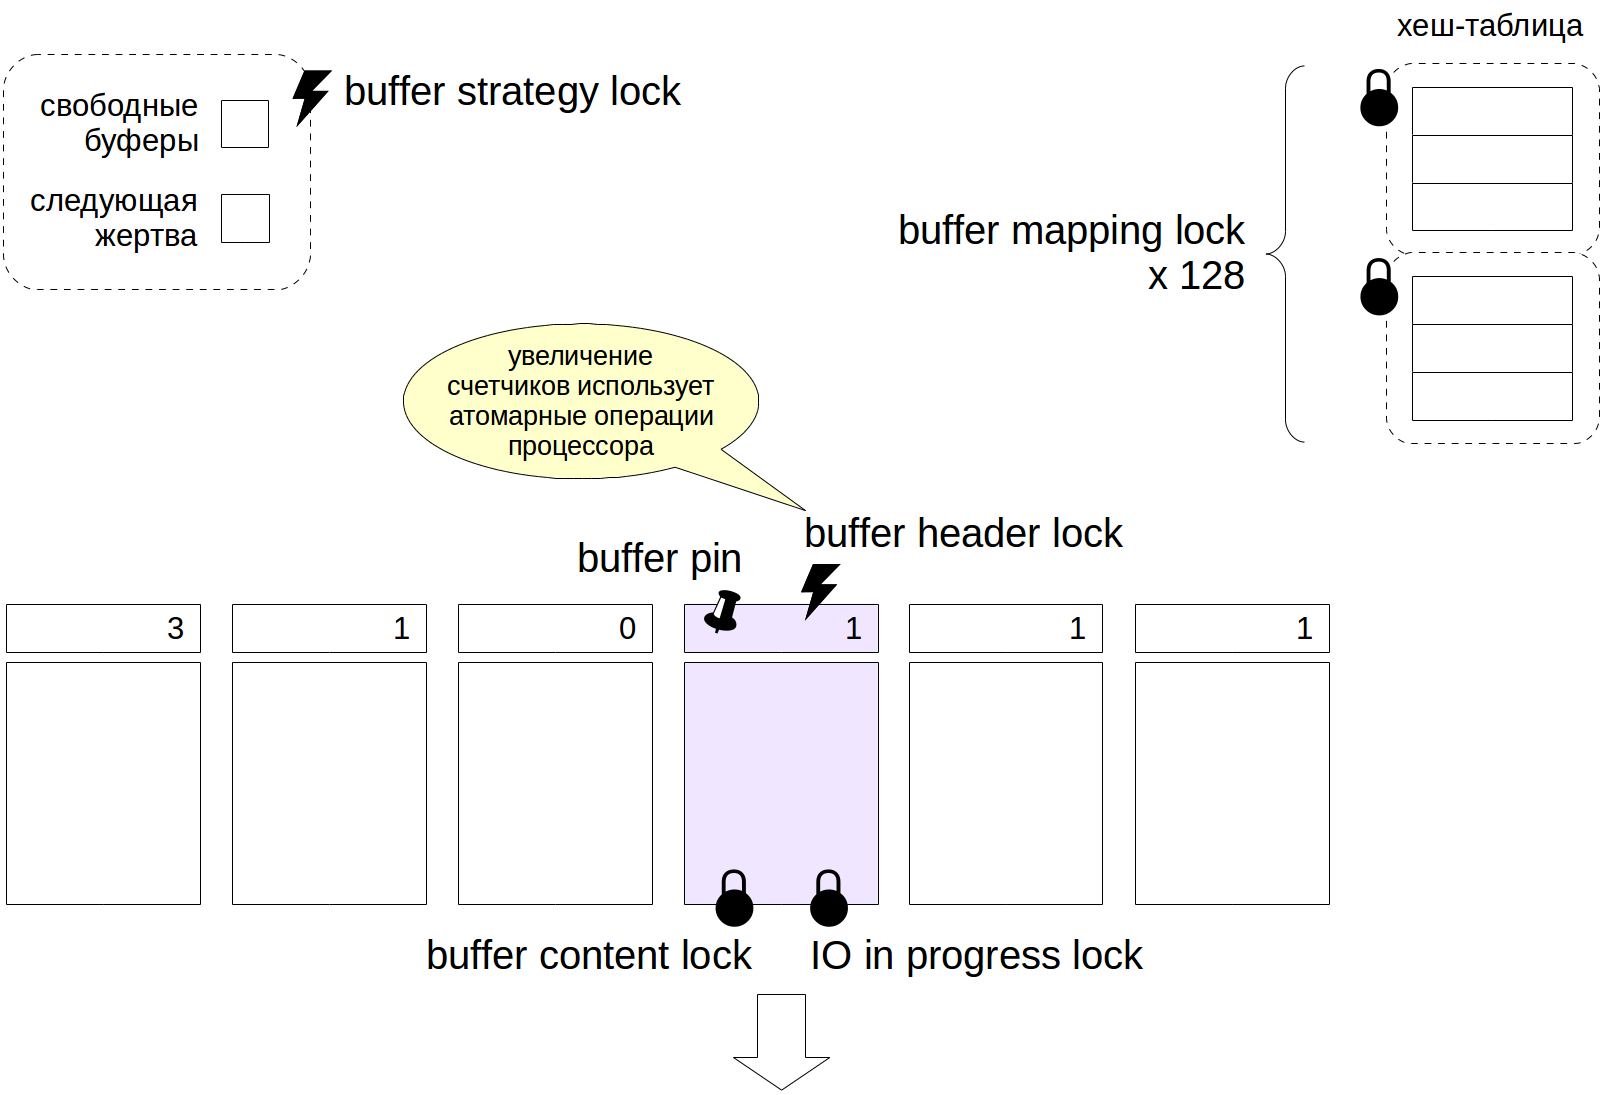
Now, to get some (incomplete!) Idea of how and where locks are used, consider an example of a buffer cache.
To access a hash table containing references to buffers, the process must capture a light buffer mapping lock in shared mode, and if the table needs to be changed, then in exceptional mode. To reduce granularity, this lock is arranged as a tranche , consisting of 128 separate locks, each of which protects its own part of the hash table.
The process gets access to the header of the buffer using spin-lock. Certain operations (such as increasing the counter) can also be performed without explicit locks using atomic instructions from the processor.
To read the contents of a buffer, a buffer content lock is required. Usually it is captured only for the time necessary to read the pointers to the version of the lines, and then the protection provided by the buffer clip is enough. To modify the contents of the buffer, this lock must be captured in exceptional mode.
When reading a buffer from disk (or writing to disk), the IO in progress lock is also captured, which signals other processes that the page is being read (or written) - they can queue if they also need to do something with this page.
Pointers to free buffers and to the next victim are protected by a single buffer strategy lock spin lock.
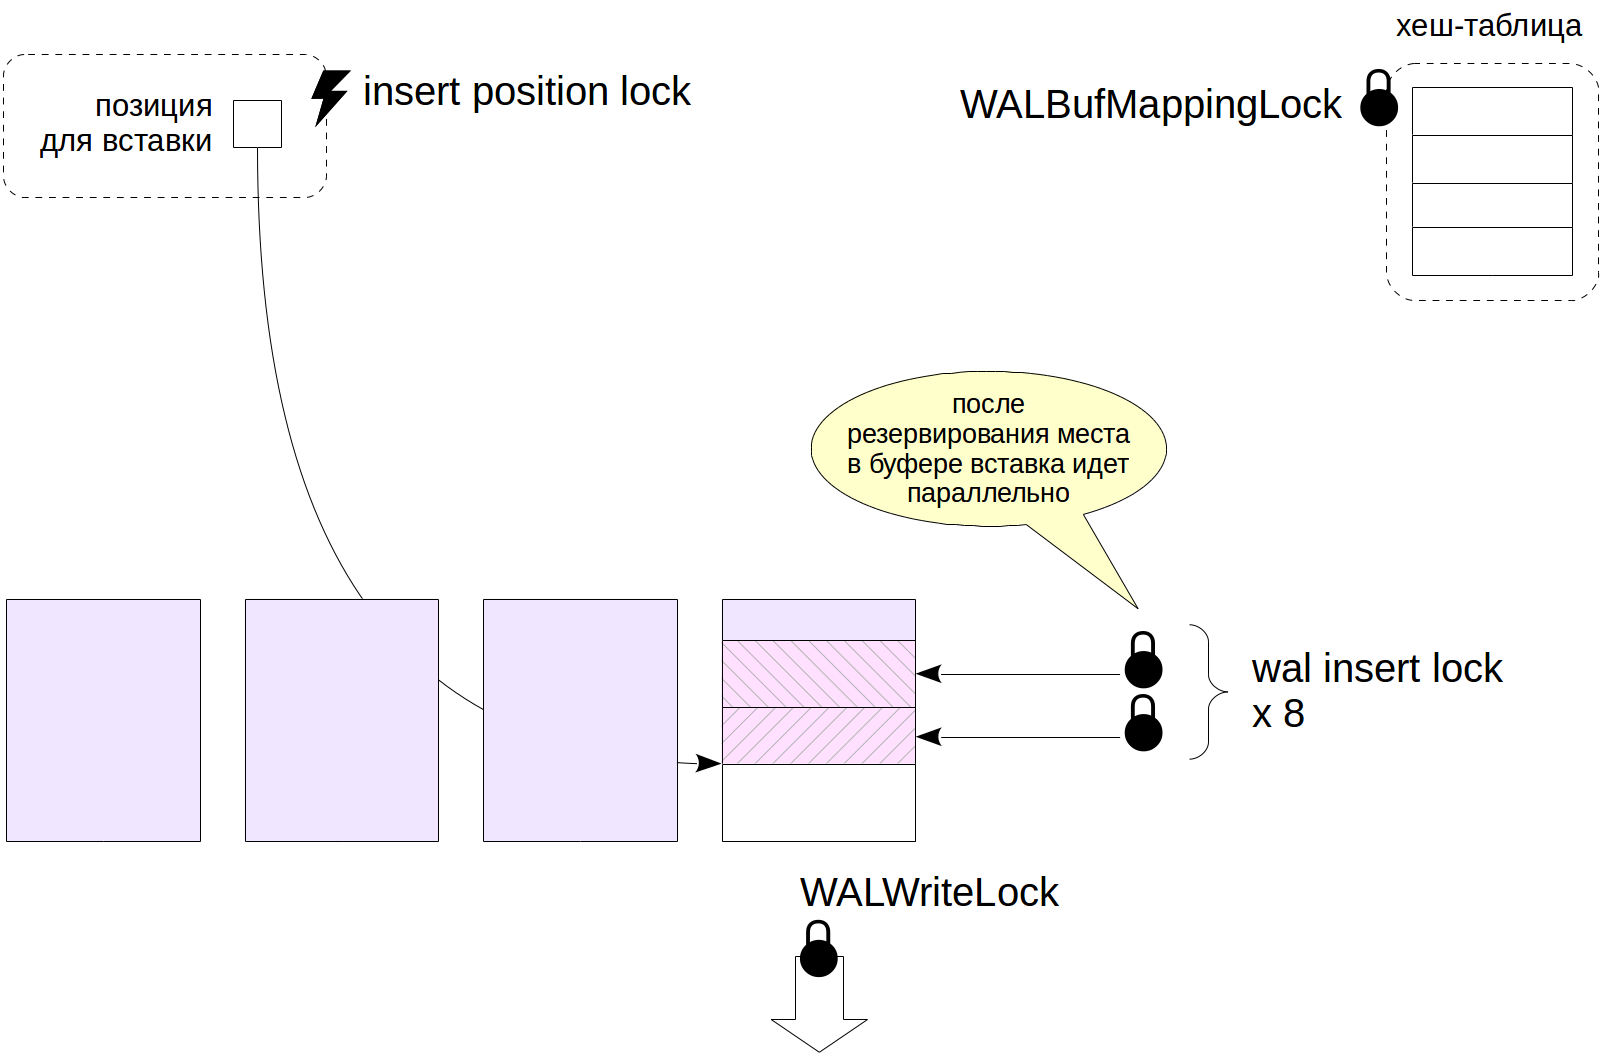
Another example: log buffers.
For the journal cache, a hash table is also used that contains the mapping of pages to buffers. Unlike the buffer cache, this hash table is protected by a single lightweight WALBufMappingLock lock, since the size of the journal cache is smaller (usually 1/32 of the buffer cache) and the access to buffers is more streamlined.
Writing pages to disk is protected by a lightweight WALWriteLock lock so that only one process can perform this operation at a time.
To create a journal entry, the process must first reserve a space on the WAL page. To do this, it captures the spin lock insert position lock. After a place is reserved, the process copies the contents of its record to the designated place. Copying can be performed by several processes at the same time, for which the record is protected by a tranche of 8 easy lock insert locks (the process must capture any of them).
The picture does not show all locks related to the prerecord log, but this and the previous example should give some idea about the use of locks in RAM.
Starting with PostgreSQL 9.6, wait monitoring tools are built into the pg_stat_activity view. When a process (system or service) cannot do its work and is waiting for something, this expectation can be seen in the view: the wait_event_type column indicates the type of expectation, and the wait_event column indicates the name of a specific expectation.
Keep in mind that a view shows only those expectations that are appropriately handled in the source code. If the view does not show the expectation, this generally does not mean with a 100 percent probability that the process really does not expect anything.
Unfortunately, the only information available about expectations is current information. No accumulated statistics are maintained. The only way to get a picture of expectations over time is to sample the state of a view at a specific interval. There is no built-in means for this, but you can use extensions, for example, pg_wait_sampling .
It is necessary to take into account the probabilistic nature of sampling. To get a more or less reliable picture, the number of measurements should be large enough. Sampling at a low frequency may not give a reliable picture, and increasing the frequency will lead to an increase in overhead. For the same reason, sampling is useless for analyzing short-lived sessions.
All expectations can be divided into several types.
Expectations of the considered locks make up a large category:
But processes can expect other events:
There are situations when a process simply does not do useful work. This category includes:
As a rule, such expectations are “normal” and do not indicate any problems.
The type of expectation is followed by the name of the particular expectation. The full table can be found in the documentation .
If no wait name is specified, the process is not in a wait state. Such a time should be considered unaccounted for , since in fact it is not known what exactly is happening at this moment.
However, it's time to look.
It can be seen that all background service processes are “messing around.” Empty values in wait_event_type and wait_event indicate that the process is waiting for nothing - in our case, the serving process is busy executing the request.
To get a more or less complete picture of expectations using sampling, we use the pg_wait_sampling extension. It must be compiled from source code; I will omit this part. Then we register the library in the shared_preload_libraries parameter and restart the server.
Now install the extension in the database.
The extension allows you to view the expectation history, which is stored in a circular buffer. But the most interesting thing is to see the profile of expectations - the accumulated statistics for the entire time of work.
Here's what we’ll see in about a few seconds:
Since nothing has happened since the server started, the main expectations are of the type Activity (service processes are waiting for work to appear) and Client (psql is waiting for the user to send the request).
With default settings ( pg_wait_sampling.profile_period parameter), the sampling period is 10 milliseconds, that is, the values are saved 100 times per second. Therefore, to estimate the duration of the wait in seconds, the value of count must be divided by 100.
To understand what process expectations belong to, we add the pg_stat_activity view to the request:
Let's load with pgbench and see how the picture changes.
We reset the collected profile to zero and run the test for 30 seconds in a separate process.
The request must be completed before the pgbench process has completed:
Of course, the expectations of the pgbench process will be slightly different depending on the specific system. In our case, it is very likely that waiting for a log entry (IO / WALWrite) will be presented, but most of the time the process was not idle, but was engaged in something supposedly useful.
You should always remember that the absence of any expectation when sampling does not mean that there was no expectation. If it was shorter than the sampling period (the hundredth of a second in our example), then it could simply not fall into the sample.
Therefore, light locks did not appear in the profile - but they will appear if you collect data for a long time. To guarantee a look at them, you can artificially slow down the file system, for example, use the slowfs project built on the FUSE file system.
This is what we can see on the same test if any I / O operation takes 1/10 of a second.
Now the main expectation of the pgbench process is related to I / O, or rather, to a log entry that is executed in synchronous mode with each commit. Since (as shown in the example above), writing a log to disk is protected by the WALWriteLock light lock, this lock is also present in the profile — we wanted to look at it.
To see the pinning of the buffer, we take advantage of the fact that open cursors hold the pin so that reading the next line is faster.
We start the transaction, open the cursor and select one row.
Check that the buffer is pinned (pinning_backends):
Now we will clear the table:
As we can see, the page was skipped (Skipped 1 page due to buffer pins). Indeed, cleaning cannot process it, because it is forbidden to physically delete row versions from a page in a pinned buffer. But cleaning will not wait - the page will be processed next time.
And now we will perform the cleaning with freezing :
With a clearly requested freeze, you cannot skip a single page that is not marked in the freeze map - otherwise it is impossible to reduce the maximum age of unfrozen transactions in pg_class.relfrozenxid. Therefore, the cleanup hangs until the cursor closes.
Well, let's look at the expectations profile of the second psql session in which the VACUUM commands were executed:
The wait type BufferPin indicates that the flush was waiting for the buffer to be freed.
On this we will assume that we have completed the locks. Thank you all for your attention and comments!
Today I end this series with an article on memory locks . We’ll talk about spinlocks, lightweight locks and buffer locking, as well as expectations monitoring and sampling tools.
Spin lock
Unlike ordinary, “heavy” locks, lighter and cheaper (in terms of overhead) locks are used to protect structures in shared RAM.
The simplest of them are spin-locks or spinlocks . They are designed to capture for a very short time (several processor instructions) and protect individual sections of memory from simultaneous changes.
Spin locks are implemented based on the atomic instructions of the processor, such as compare-and-swap. They support a single exclusive mode. If the lock is busy, the waiting process performs an active wait - the command is repeated (“spinning” in the loop, hence the name) until it is executed successfully. This makes sense, since spin locks are used when the probability of conflict is rated as very low.
Spin locks do not provide detection of deadlocks (PostgreSQL developers are monitoring this) and do not provide any monitoring tools. By and large, the only thing we can do with spin locks is to know about their existence.
Light locks
Next come the so-called light locks (lightweight locks, lwlocks).
They are captured for the short time it takes to work with a data structure (for example, a hash table or a list of pointers). As a rule, a light lock is not held for long, but in some cases, a light lock protects the I / O operations, so in principle, the time can turn out to be significant.
Two modes are supported: exclusive (for changing data) and shared (read-only). As such, there is no waiting queue: if several processes are waiting for the lock to be released, one of them will gain access more or less randomly. In systems with a high degree of parallelism and heavy load, this can lead to unpleasant effects (see, for example, discussion ).
A mechanism for checking deadlocks is not provided, this remains on the conscience of the kernel developers. However, light locks have monitoring tools, therefore, unlike spin locks, they can be "seen" (a little later I will show how).
Clip buffer
Another type of blocking that we have already discussed in the article about the buffer cache is buffer pinning .
With a fixed buffer, you can perform various actions, including changing data, but with the condition that these changes will not be visible to other processes due to multi-versioning. That is, say, you can add a new line to the page, but you cannot replace the page in the buffer with another.
If the process is hindered by the binding, it usually just skips such a buffer and selects another. But in some cases, when this particular buffer is required, the process queues and falls asleep - the system will wake it up when the binding is removed.
Consolidation expectations are available for monitoring.
Example: buffer cache
Now, to get some (incomplete!) Idea of how and where locks are used, consider an example of a buffer cache.
To access a hash table containing references to buffers, the process must capture a light buffer mapping lock in shared mode, and if the table needs to be changed, then in exceptional mode. To reduce granularity, this lock is arranged as a tranche , consisting of 128 separate locks, each of which protects its own part of the hash table.
The process gets access to the header of the buffer using spin-lock. Certain operations (such as increasing the counter) can also be performed without explicit locks using atomic instructions from the processor.
To read the contents of a buffer, a buffer content lock is required. Usually it is captured only for the time necessary to read the pointers to the version of the lines, and then the protection provided by the buffer clip is enough. To modify the contents of the buffer, this lock must be captured in exceptional mode.
When reading a buffer from disk (or writing to disk), the IO in progress lock is also captured, which signals other processes that the page is being read (or written) - they can queue if they also need to do something with this page.
Pointers to free buffers and to the next victim are protected by a single buffer strategy lock spin lock.
Example: log buffers
Another example: log buffers.
For the journal cache, a hash table is also used that contains the mapping of pages to buffers. Unlike the buffer cache, this hash table is protected by a single lightweight WALBufMappingLock lock, since the size of the journal cache is smaller (usually 1/32 of the buffer cache) and the access to buffers is more streamlined.
Writing pages to disk is protected by a lightweight WALWriteLock lock so that only one process can perform this operation at a time.
To create a journal entry, the process must first reserve a space on the WAL page. To do this, it captures the spin lock insert position lock. After a place is reserved, the process copies the contents of its record to the designated place. Copying can be performed by several processes at the same time, for which the record is protected by a tranche of 8 easy lock insert locks (the process must capture any of them).
The picture does not show all locks related to the prerecord log, but this and the previous example should give some idea about the use of locks in RAM.
Expectation monitoring
Starting with PostgreSQL 9.6, wait monitoring tools are built into the pg_stat_activity view. When a process (system or service) cannot do its work and is waiting for something, this expectation can be seen in the view: the wait_event_type column indicates the type of expectation, and the wait_event column indicates the name of a specific expectation.
Keep in mind that a view shows only those expectations that are appropriately handled in the source code. If the view does not show the expectation, this generally does not mean with a 100 percent probability that the process really does not expect anything.
Unfortunately, the only information available about expectations is current information. No accumulated statistics are maintained. The only way to get a picture of expectations over time is to sample the state of a view at a specific interval. There is no built-in means for this, but you can use extensions, for example, pg_wait_sampling .
It is necessary to take into account the probabilistic nature of sampling. To get a more or less reliable picture, the number of measurements should be large enough. Sampling at a low frequency may not give a reliable picture, and increasing the frequency will lead to an increase in overhead. For the same reason, sampling is useless for analyzing short-lived sessions.
All expectations can be divided into several types.
Expectations of the considered locks make up a large category:
- waiting for object locks (Lock value in the wait_event_type column);
- waiting for light locks (LWLock);
- waiting for a pinned buffer (BufferPin).
But processes can expect other events:
- I / O expectations (IO) occur when a process needs to write or read data;
- the process can wait for the data necessary for work from the client (Client) or from another process (IPC);
- extensions can register their specific expectations (Extension).
There are situations when a process simply does not do useful work. This category includes:
- waiting for background processes in its main loop (Activity);
- waiting for a timer (Timeout).
As a rule, such expectations are “normal” and do not indicate any problems.
The type of expectation is followed by the name of the particular expectation. The full table can be found in the documentation .
If no wait name is specified, the process is not in a wait state. Such a time should be considered unaccounted for , since in fact it is not known what exactly is happening at this moment.
However, it's time to look.
=> SELECT pid, backend_type, wait_event_type, wait_event FROM pg_stat_activity;
pid | backend_type | wait_event_type | wait_event -------+------------------------------+-----------------+--------------------- 28739 | logical replication launcher | Activity | LogicalLauncherMain 28736 | autovacuum launcher | Activity | AutoVacuumMain 28963 | client backend | | 28734 | background writer | Activity | BgWriterMain 28733 | checkpointer | Activity | CheckpointerMain 28735 | walwriter | Activity | WalWriterMain (6 rows)
It can be seen that all background service processes are “messing around.” Empty values in wait_event_type and wait_event indicate that the process is waiting for nothing - in our case, the serving process is busy executing the request.
Sampling
To get a more or less complete picture of expectations using sampling, we use the pg_wait_sampling extension. It must be compiled from source code; I will omit this part. Then we register the library in the shared_preload_libraries parameter and restart the server.
=> ALTER SYSTEM SET shared_preload_libraries = 'pg_wait_sampling';
student$ sudo pg_ctlcluster 11 main restart
Now install the extension in the database.
=> CREATE EXTENSION pg_wait_sampling;
The extension allows you to view the expectation history, which is stored in a circular buffer. But the most interesting thing is to see the profile of expectations - the accumulated statistics for the entire time of work.
Here's what we’ll see in about a few seconds:
=> SELECT * FROM pg_wait_sampling_profile;
pid | event_type | event | queryid | count -------+------------+---------------------+---------+------- 29074 | Activity | LogicalLauncherMain | 0 | 220 29070 | Activity | WalWriterMain | 0 | 220 29071 | Activity | AutoVacuumMain | 0 | 219 29069 | Activity | BgWriterMain | 0 | 220 29111 | Client | ClientRead | 0 | 3 29068 | Activity | CheckpointerMain | 0 | 220 (6 rows)
Since nothing has happened since the server started, the main expectations are of the type Activity (service processes are waiting for work to appear) and Client (psql is waiting for the user to send the request).
With default settings ( pg_wait_sampling.profile_period parameter), the sampling period is 10 milliseconds, that is, the values are saved 100 times per second. Therefore, to estimate the duration of the wait in seconds, the value of count must be divided by 100.
To understand what process expectations belong to, we add the pg_stat_activity view to the request:
=> SELECT p.pid, a.backend_type, a.application_name AS app, p.event_type, p.event, p.count FROM pg_wait_sampling_profile p LEFT JOIN pg_stat_activity a ON p.pid = a.pid ORDER BY p.pid, p.count DESC;
pid | backend_type | app | event_type | event | count -------+------------------------------+------+------------+----------------------+------- 29068 | checkpointer | | Activity | CheckpointerMain | 222 29069 | background writer | | Activity | BgWriterMain | 222 29070 | walwriter | | Activity | WalWriterMain | 222 29071 | autovacuum launcher | | Activity | AutoVacuumMain | 221 29074 | logical replication launcher | | Activity | LogicalLauncherMain | 222 29111 | client backend | psql | Client | ClientRead | 4 29111 | client backend | psql | IPC | MessageQueueInternal | 1 (7 rows)
Let's load with pgbench and see how the picture changes.
student$ pgbench -i test
We reset the collected profile to zero and run the test for 30 seconds in a separate process.
=> SELECT pg_wait_sampling_reset_profile();
student$ pgbench -T 30 test
The request must be completed before the pgbench process has completed:
=> SELECT p.pid, a.backend_type, a.application_name AS app, p.event_type, p.event, p.count FROM pg_wait_sampling_profile p LEFT JOIN pg_stat_activity a ON p.pid = a.pid WHERE a.application_name = 'pgbench' ORDER BY p.pid, p.count DESC;
pid | backend_type | app | event_type | event | count -------+----------------+---------+------------+------------+------- 29148 | client backend | pgbench | IO | WALWrite | 8 29148 | client backend | pgbench | Client | ClientRead | 1 (2 rows)
Of course, the expectations of the pgbench process will be slightly different depending on the specific system. In our case, it is very likely that waiting for a log entry (IO / WALWrite) will be presented, but most of the time the process was not idle, but was engaged in something supposedly useful.
Light locks
You should always remember that the absence of any expectation when sampling does not mean that there was no expectation. If it was shorter than the sampling period (the hundredth of a second in our example), then it could simply not fall into the sample.
Therefore, light locks did not appear in the profile - but they will appear if you collect data for a long time. To guarantee a look at them, you can artificially slow down the file system, for example, use the slowfs project built on the FUSE file system.
This is what we can see on the same test if any I / O operation takes 1/10 of a second.
=> SELECT pg_wait_sampling_reset_profile();
student$ pgbench -T 30 test
=> SELECT p.pid, a.backend_type, a.application_name AS app, p.event_type, p.event, p.count FROM pg_wait_sampling_profile p LEFT JOIN pg_stat_activity a ON p.pid = a.pid WHERE a.application_name = 'pgbench' ORDER BY p.pid, p.count DESC;
pid | backend_type | app | event_type | event | count -------+----------------+---------+------------+----------------+------- 29240 | client backend | pgbench | IO | WALWrite | 1445 29240 | client backend | pgbench | LWLock | WALWriteLock | 803 29240 | client backend | pgbench | IO | DataFileExtend | 20 (3 rows)
Now the main expectation of the pgbench process is related to I / O, or rather, to a log entry that is executed in synchronous mode with each commit. Since (as shown in the example above), writing a log to disk is protected by the WALWriteLock light lock, this lock is also present in the profile — we wanted to look at it.
Clip buffer
To see the pinning of the buffer, we take advantage of the fact that open cursors hold the pin so that reading the next line is faster.
We start the transaction, open the cursor and select one row.
=> BEGIN; => DECLARE c CURSOR FOR SELECT * FROM pgbench_history; => FETCH c;
tid | bid | aid | delta | mtime | filler -----+-----+-------+-------+----------------------------+-------- 9 | 1 | 35092 | 477 | 2019-09-04 16:16:18.596564 | (1 row)
Check that the buffer is pinned (pinning_backends):
=> SELECT * FROM pg_buffercache WHERE relfilenode = pg_relation_filenode('pgbench_history') AND relforknumber = 0 \gx
-[ RECORD 1 ]----+------ bufferid | 190 relfilenode | 47050 reltablespace | 1663 reldatabase | 16386 relforknumber | 0 relblocknumber | 0 isdirty | t usagecount | 1 pinning_backends | 1 <-- 1
Now we will clear the table:
| => SELECT pg_backend_pid();
| pg_backend_pid | ---------------- | 29367 | (1 row)
| => VACUUM VERBOSE pgbench_history;
| INFO: vacuuming "public.pgbench_history" | INFO: "pgbench_history": found 0 removable, 0 nonremovable row versions in 1 out of 1 pages | DETAIL: 0 dead row versions cannot be removed yet, oldest xmin: 732651 | There were 0 unused item pointers.
| Skipped 1 page due to buffer pins, 0 frozen pages.
| 0 pages are entirely empty. | CPU: user: 0.00 s, system: 0.00 s, elapsed: 0.00 s. | VACUUM
As we can see, the page was skipped (Skipped 1 page due to buffer pins). Indeed, cleaning cannot process it, because it is forbidden to physically delete row versions from a page in a pinned buffer. But cleaning will not wait - the page will be processed next time.
And now we will perform the cleaning with freezing :
| => VACUUM FREEZE VERBOSE pgbench_history;
With a clearly requested freeze, you cannot skip a single page that is not marked in the freeze map - otherwise it is impossible to reduce the maximum age of unfrozen transactions in pg_class.relfrozenxid. Therefore, the cleanup hangs until the cursor closes.
=> SELECT age(relfrozenxid) FROM pg_class WHERE oid = 'pgbench_history'::regclass;
age ----- 27 (1 row)
=> COMMIT; --
| INFO: aggressively vacuuming "public.pgbench_history" | INFO: "pgbench_history": found 0 removable, 26 nonremovable row versions in 1 out of 1 pages | DETAIL: 0 dead row versions cannot be removed yet, oldest xmin: 732651 | There were 0 unused item pointers.
| Skipped 0 pages due to buffer pins, 0 frozen pages.
| 0 pages are entirely empty. | CPU: user: 0.00 s, system: 0.00 s, elapsed: 3.01 s. | VACUUM
=> SELECT age(relfrozenxid) FROM pg_class WHERE oid = 'pgbench_history'::regclass;
age ----- 0 (1 row)
Well, let's look at the expectations profile of the second psql session in which the VACUUM commands were executed:
=> SELECT p.pid, a.backend_type, a.application_name AS app, p.event_type, p.event, p.count FROM pg_wait_sampling_profile p LEFT JOIN pg_stat_activity a ON p.pid = a.pid WHERE p.pid = 29367 ORDER BY p.pid, p.count DESC;
pid | backend_type | app | event_type | event | count -------+----------------+------+------------+------------+------- 29367 | client backend | psql | BufferPin | BufferPin | 294 29367 | client backend | psql | Client | ClientRead | 10 (2 rows)
The wait type BufferPin indicates that the flush was waiting for the buffer to be freed.
On this we will assume that we have completed the locks. Thank you all for your attention and comments!
All Articles