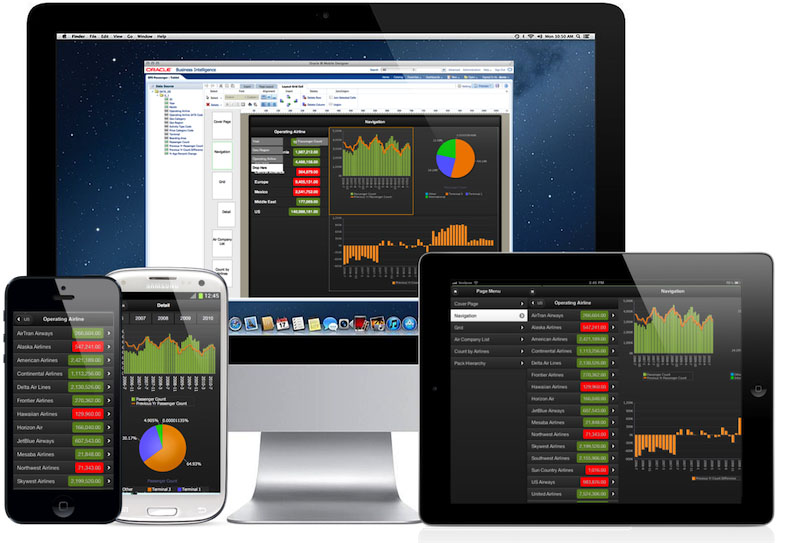
Mobile reports on Oracle BI EE 12c - one, two, three. Methodology from Oracle BI EE 12c CAD Course
Many companies that use Oracle BI 12c have a common problem: their developers, for various reasons, do not want to get involved with mobile reporting.
In our BI courses, this issue was covered in a full version in the new version, so we are putting out a practically ready recipe for how to transfer a set of existing reports to a mobile application in a few hours.
About this - a few words and a lot of pictures.
We do not repeat the general point associated with the need to install a mobile client from the App Store or Google Play , as we consider this a natural step. Each of these applications has its own history and support group, on the pages of stores there are reviews and ratings. Both the App Store and Google Play have customers for other Oracle products.
1. Take the source for BI Publisher based on the page in the Excel workbook and take the screenshots below. If there is no source, then it must be created.
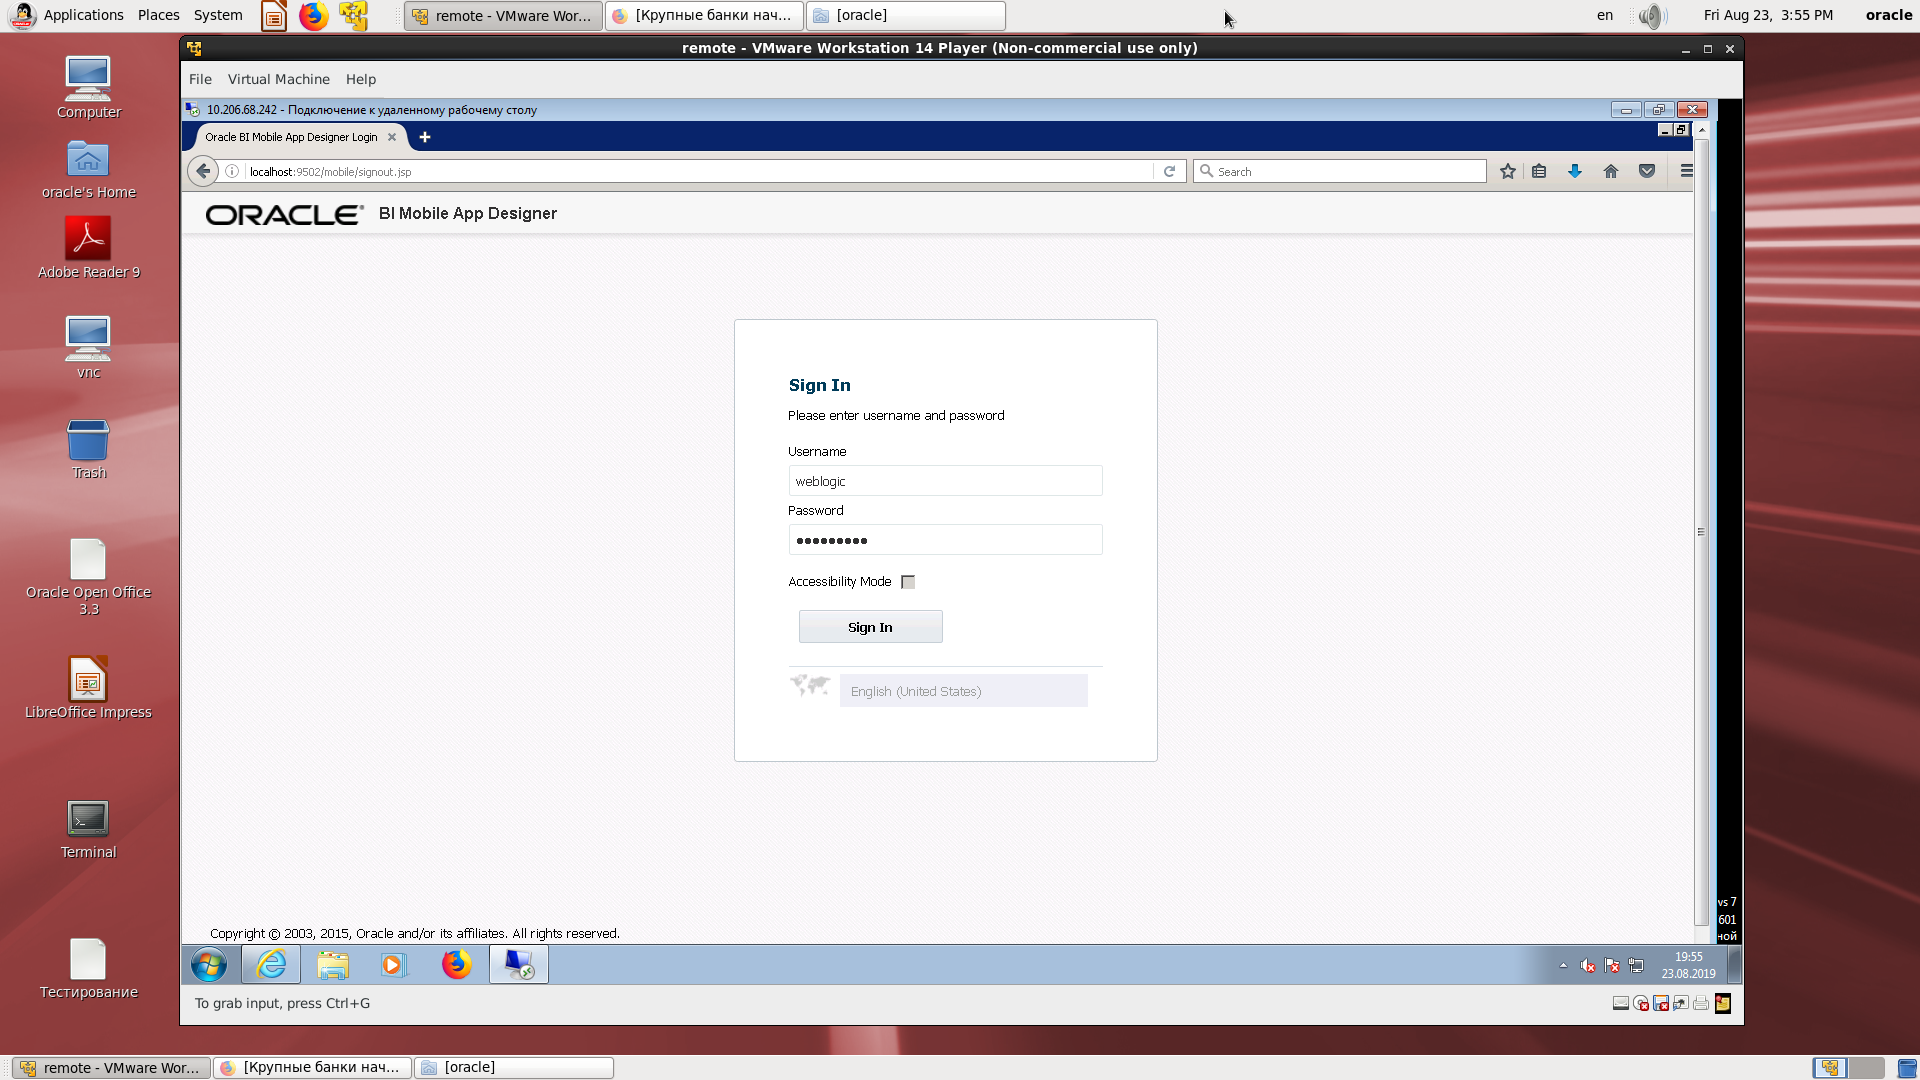
The initial screen for entering the designer of the mobile application.
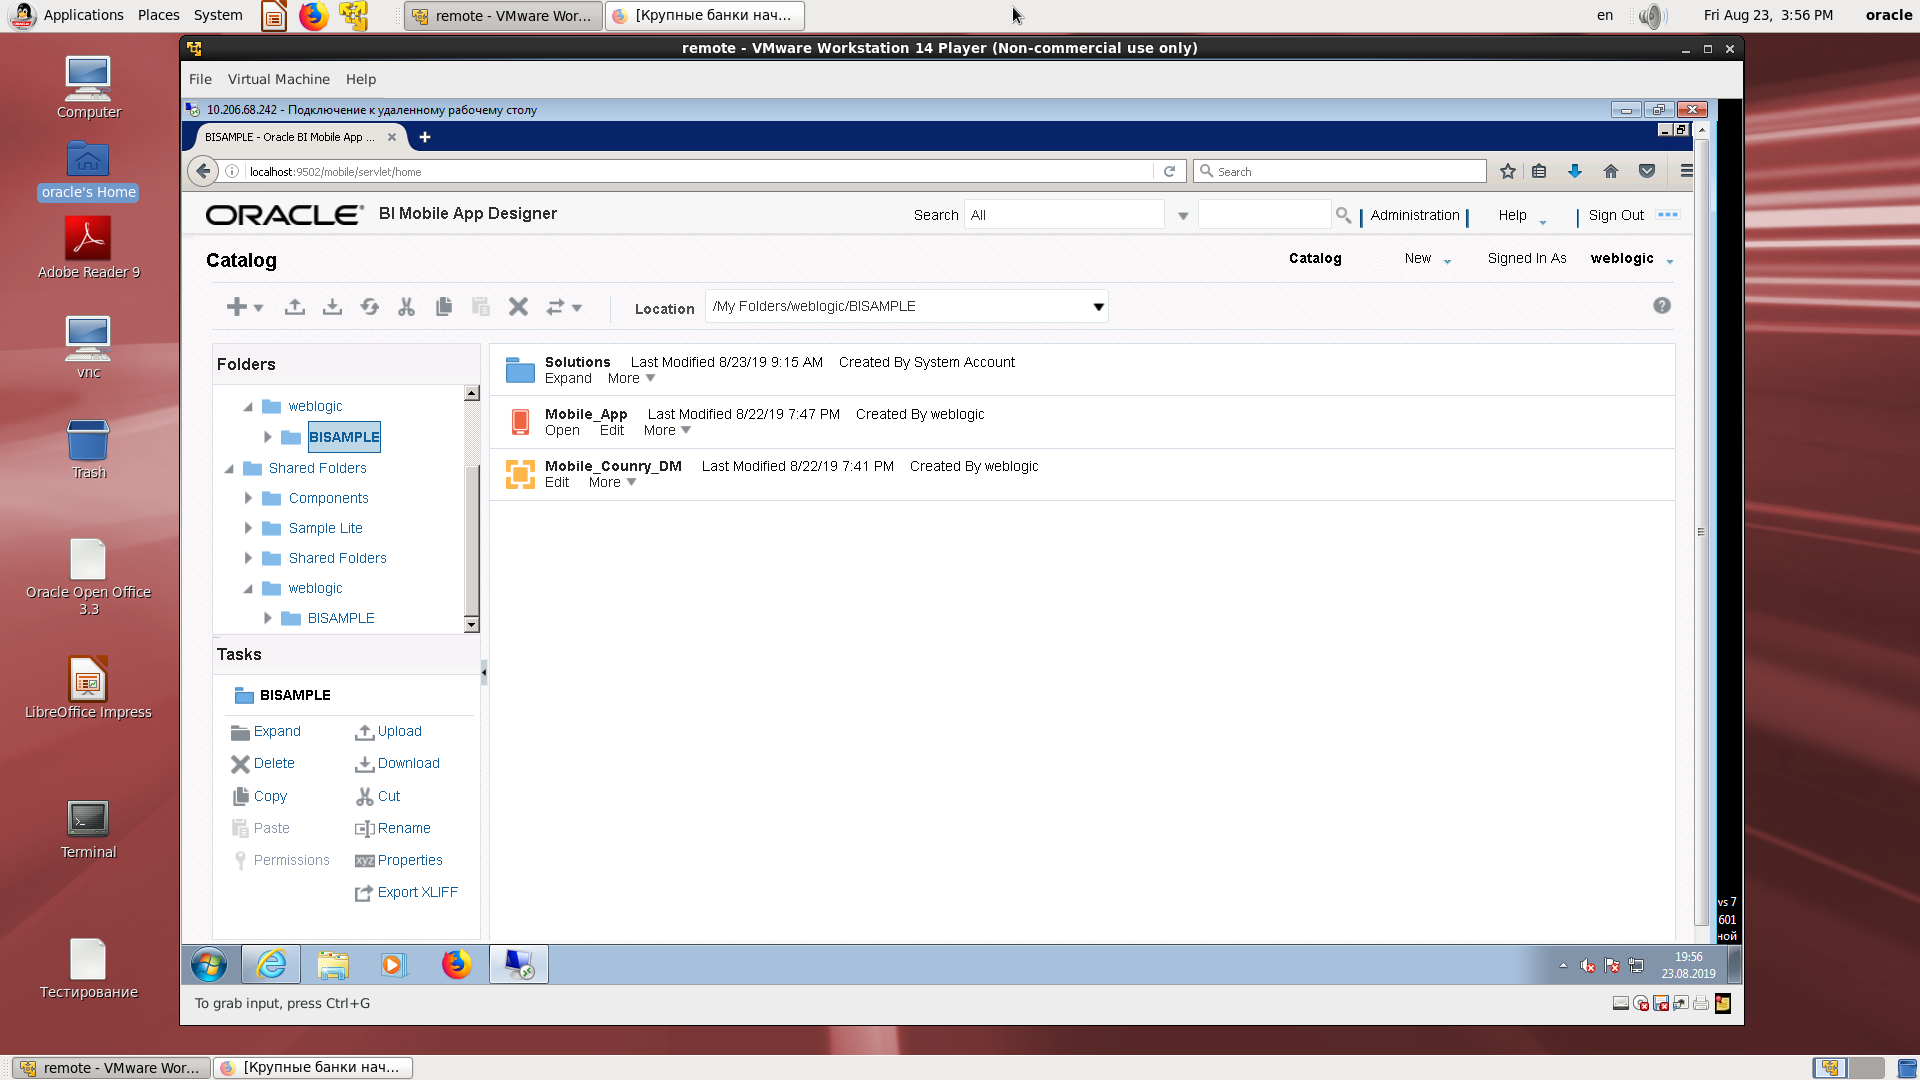
A regular BI directory with a mobile application.
Scheme of a source made on the basis of XLS according to BI Publisher technique (just load the file into the source creation wizard and save a sample XML data)

Suppose the source is created.

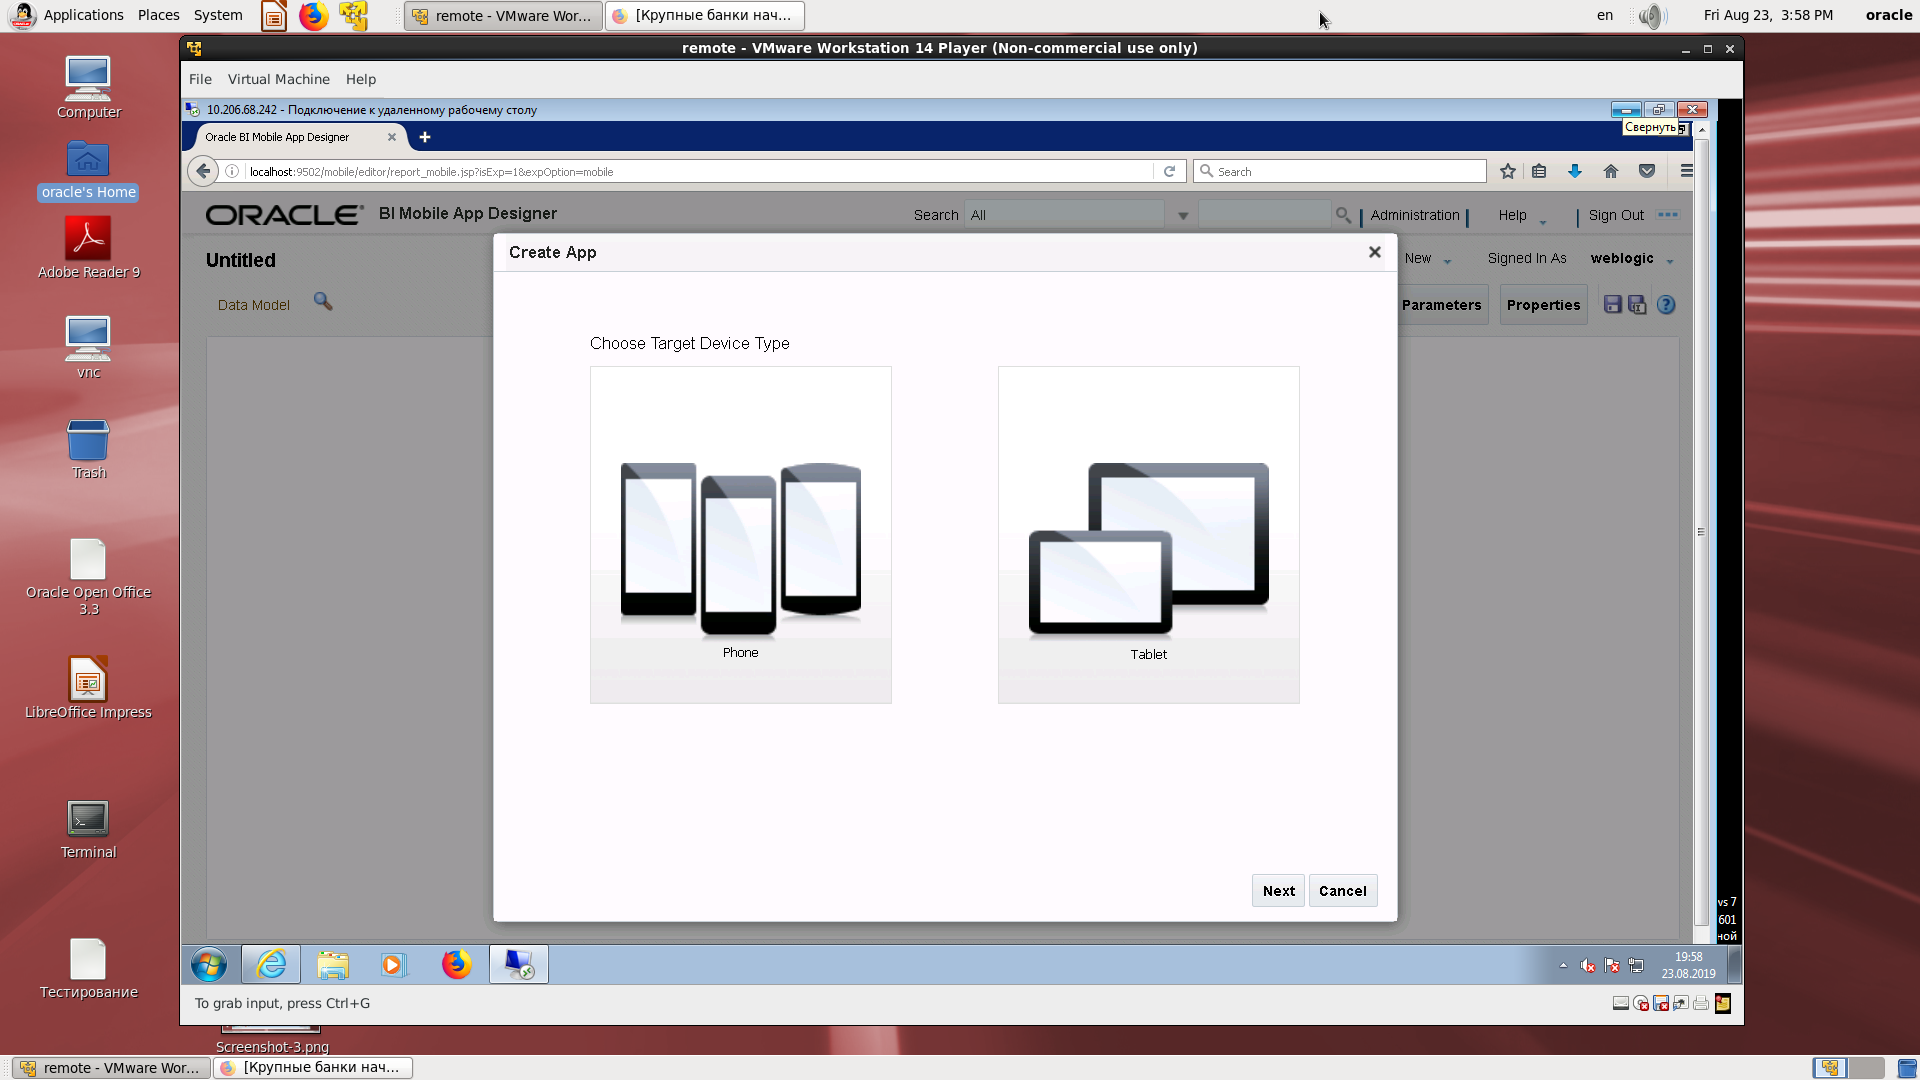
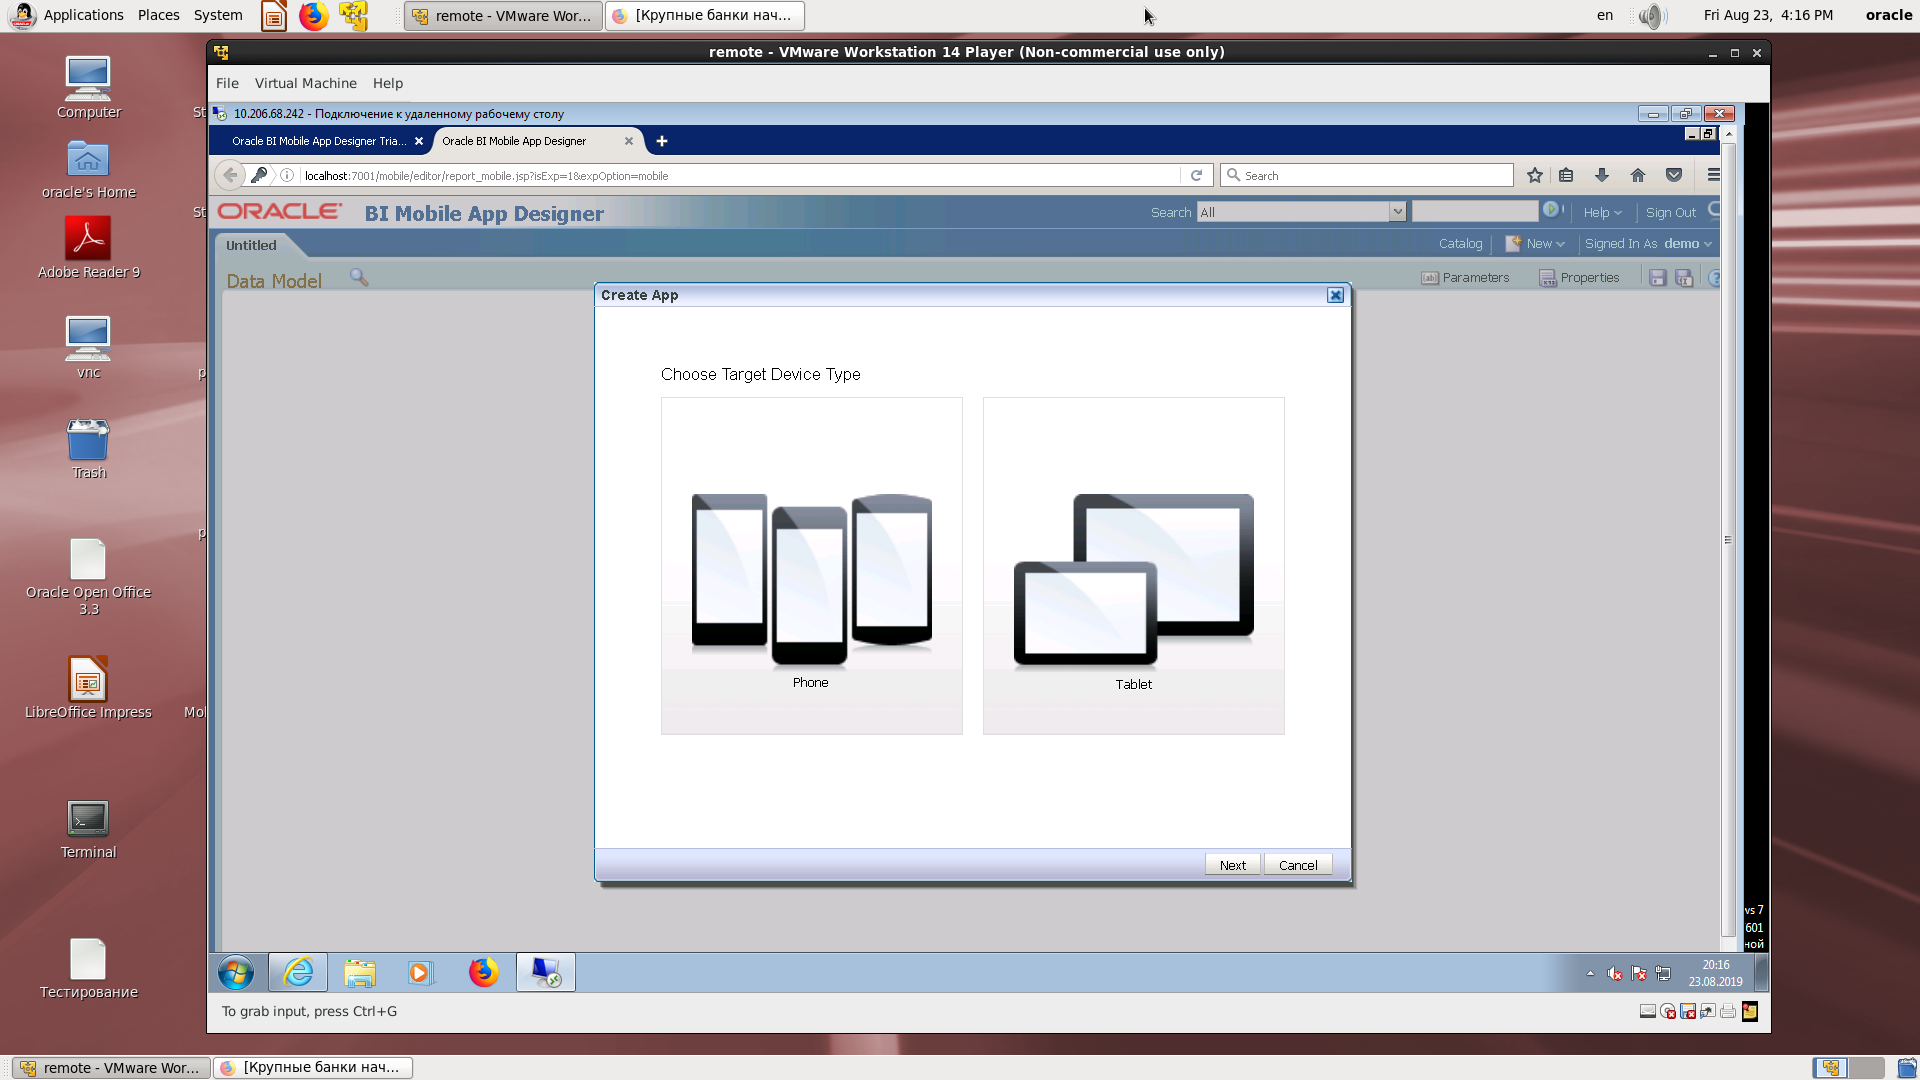
Select the type of mobile device.
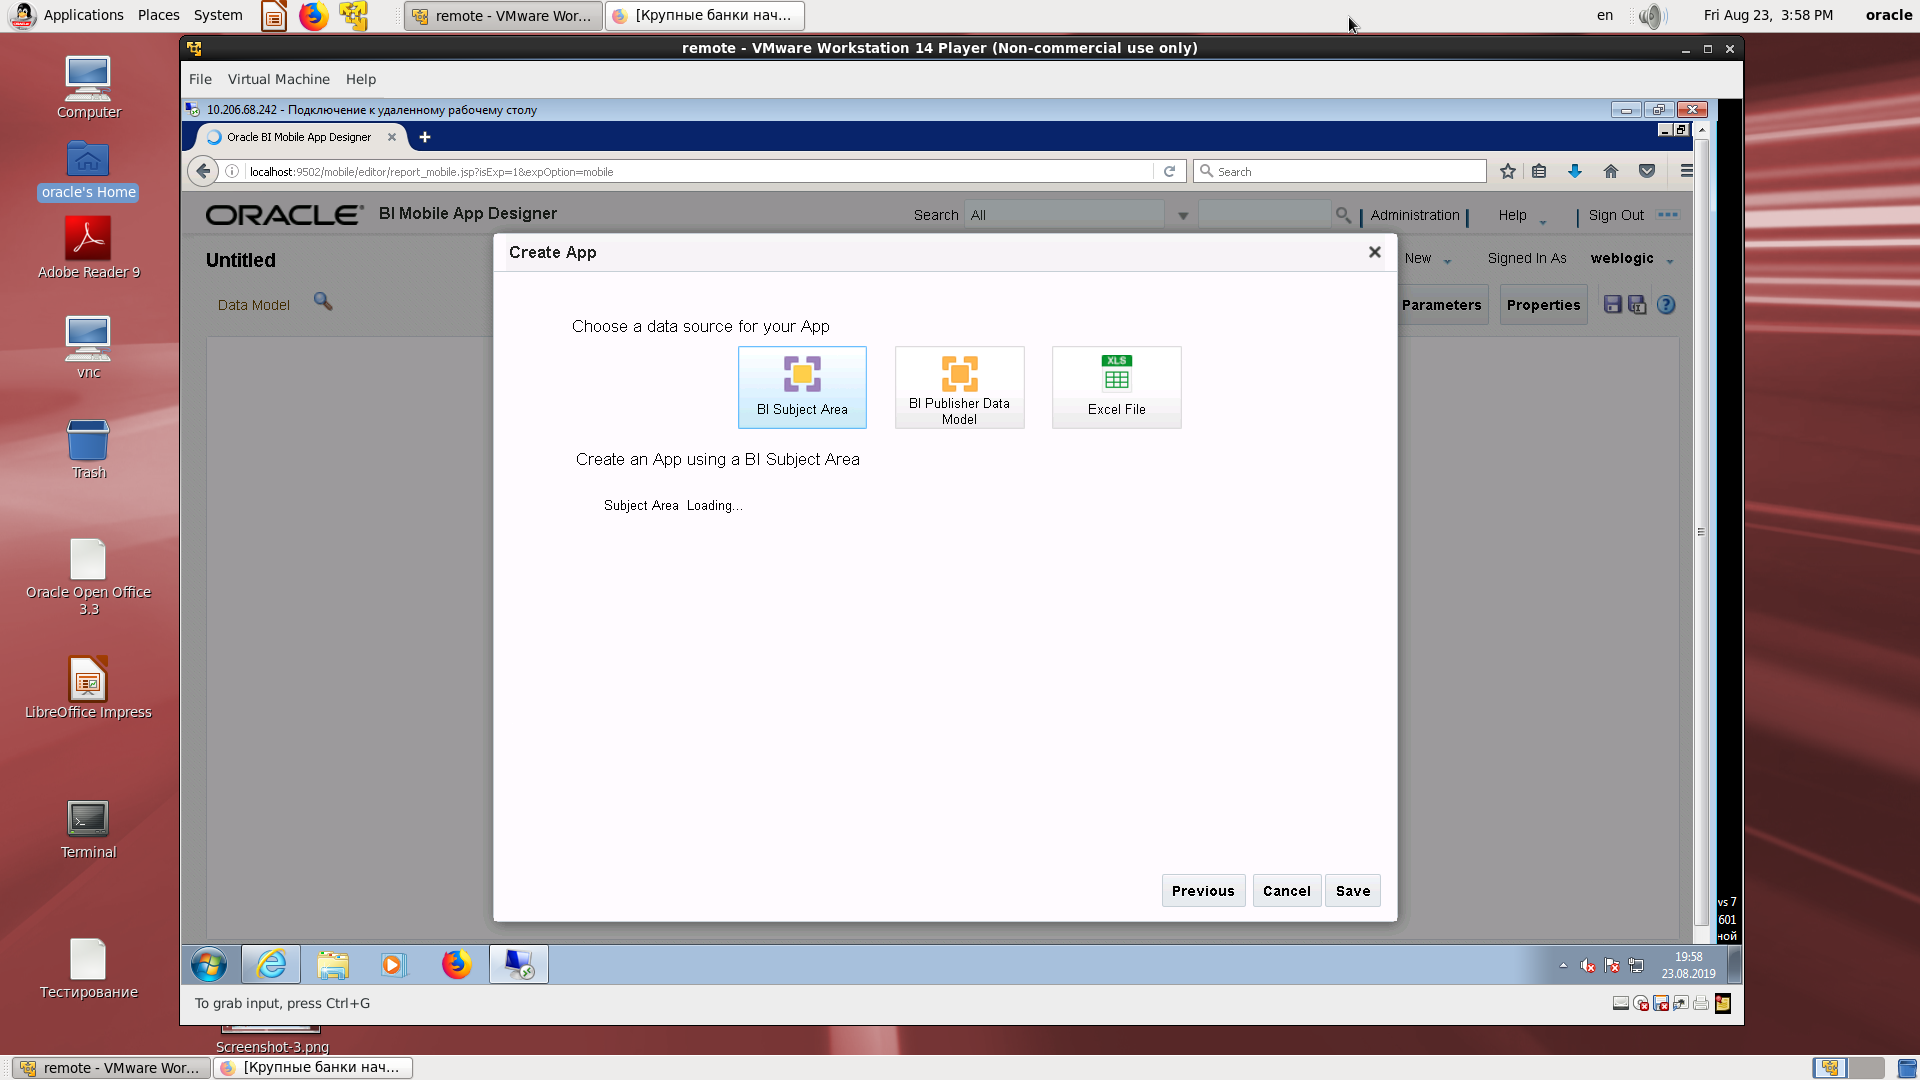
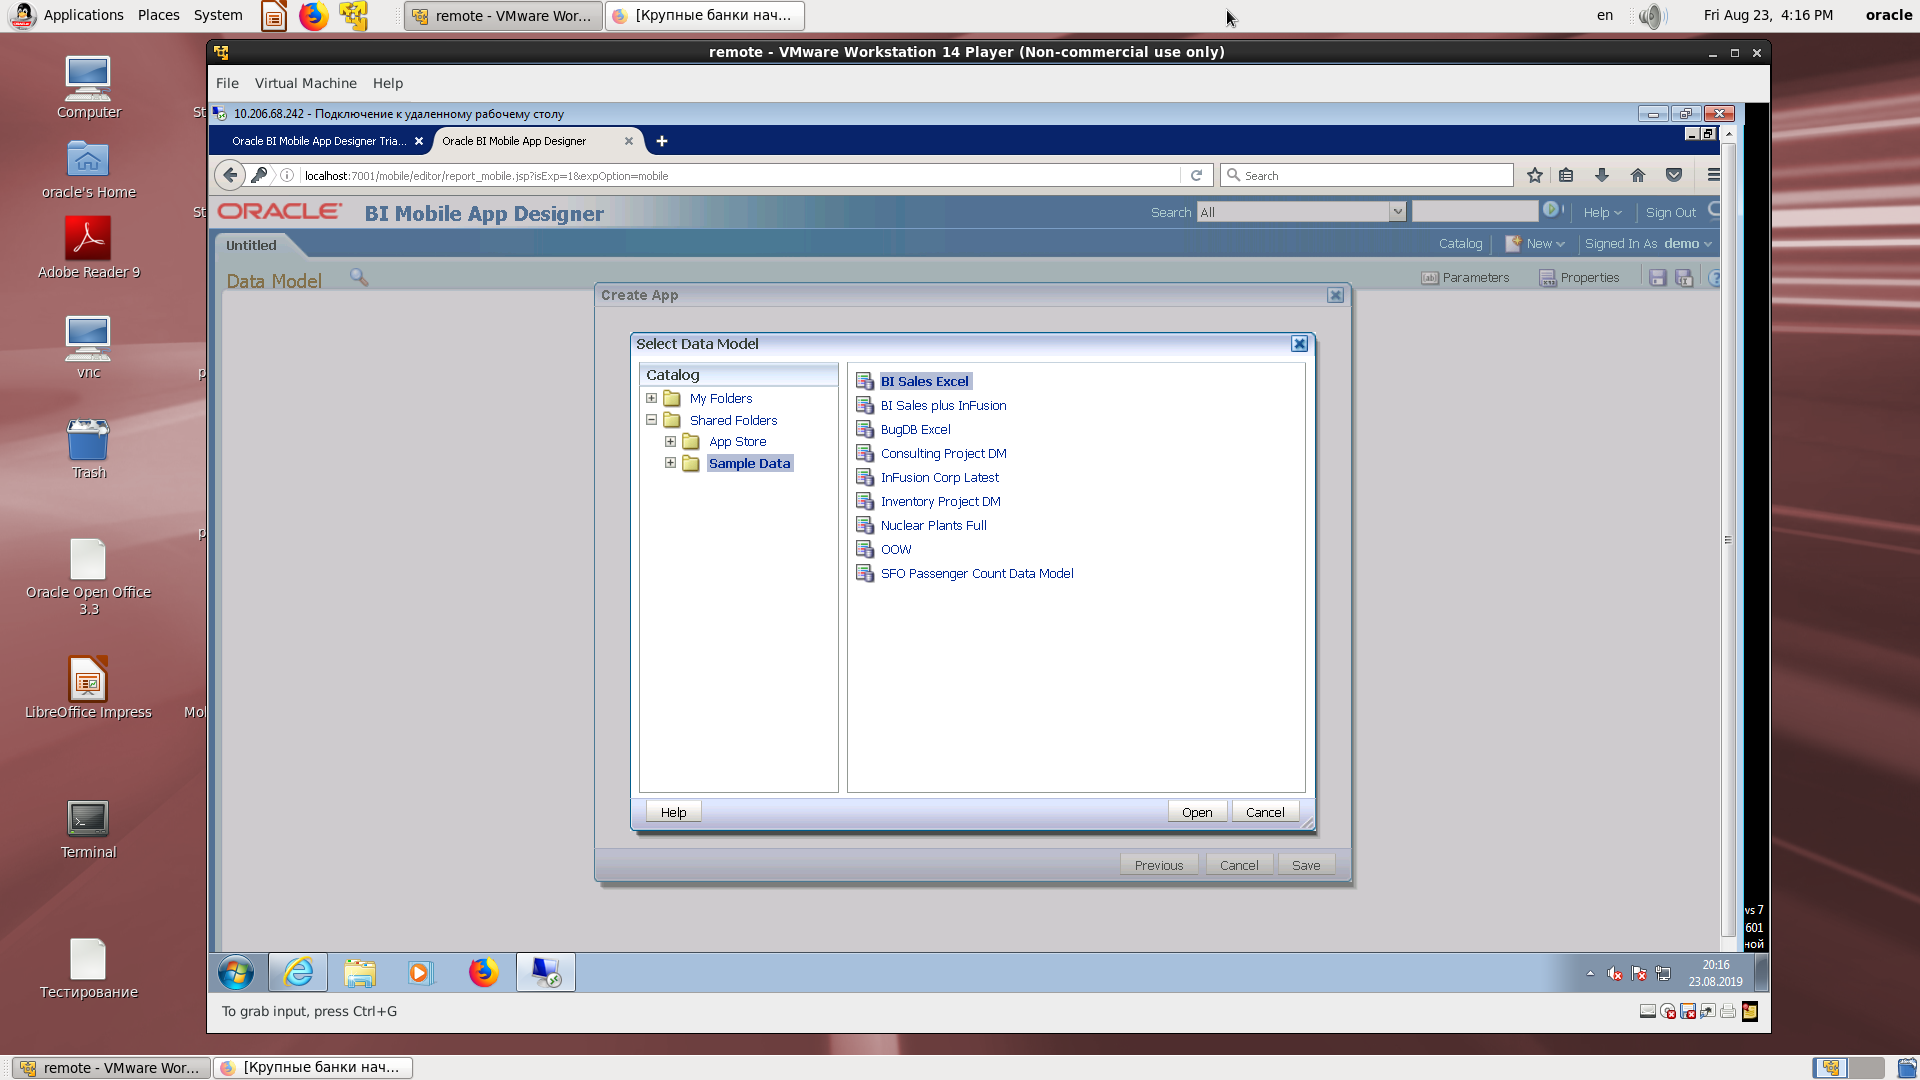
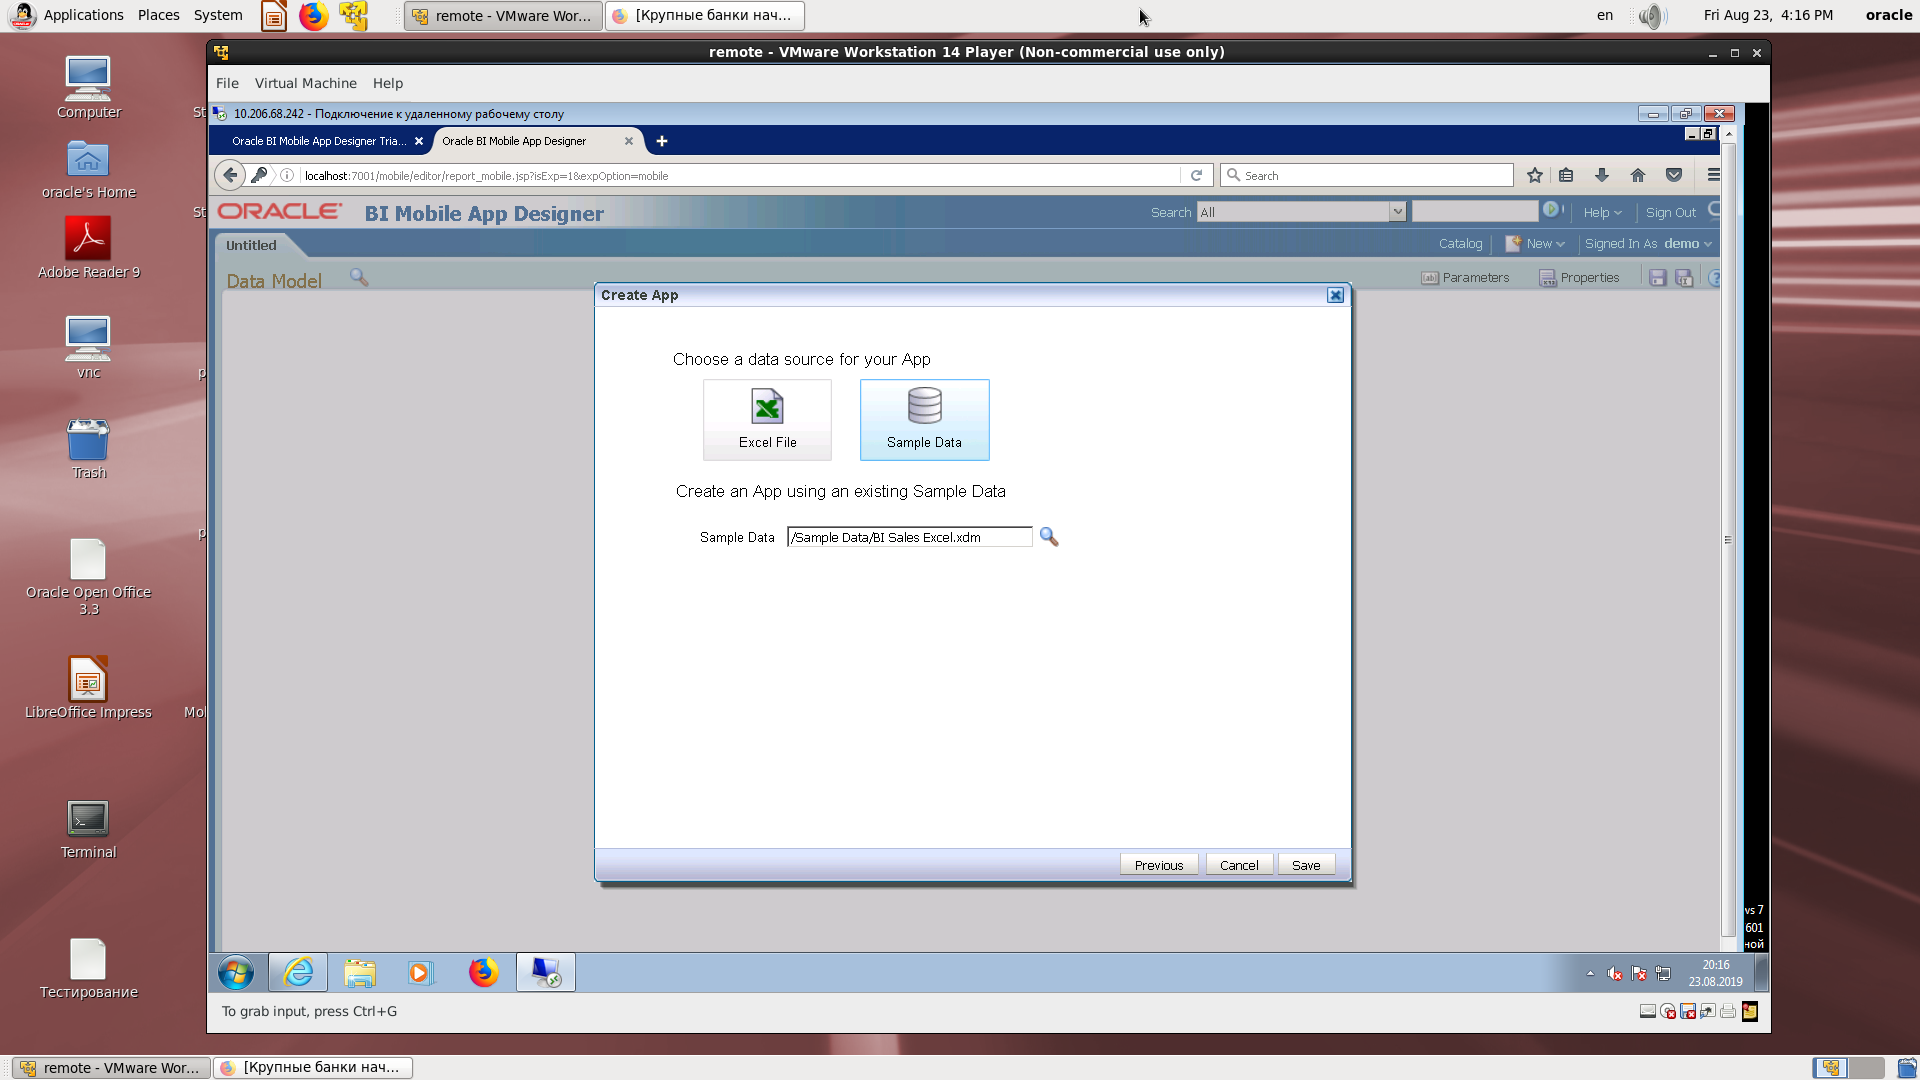
Source type selection.
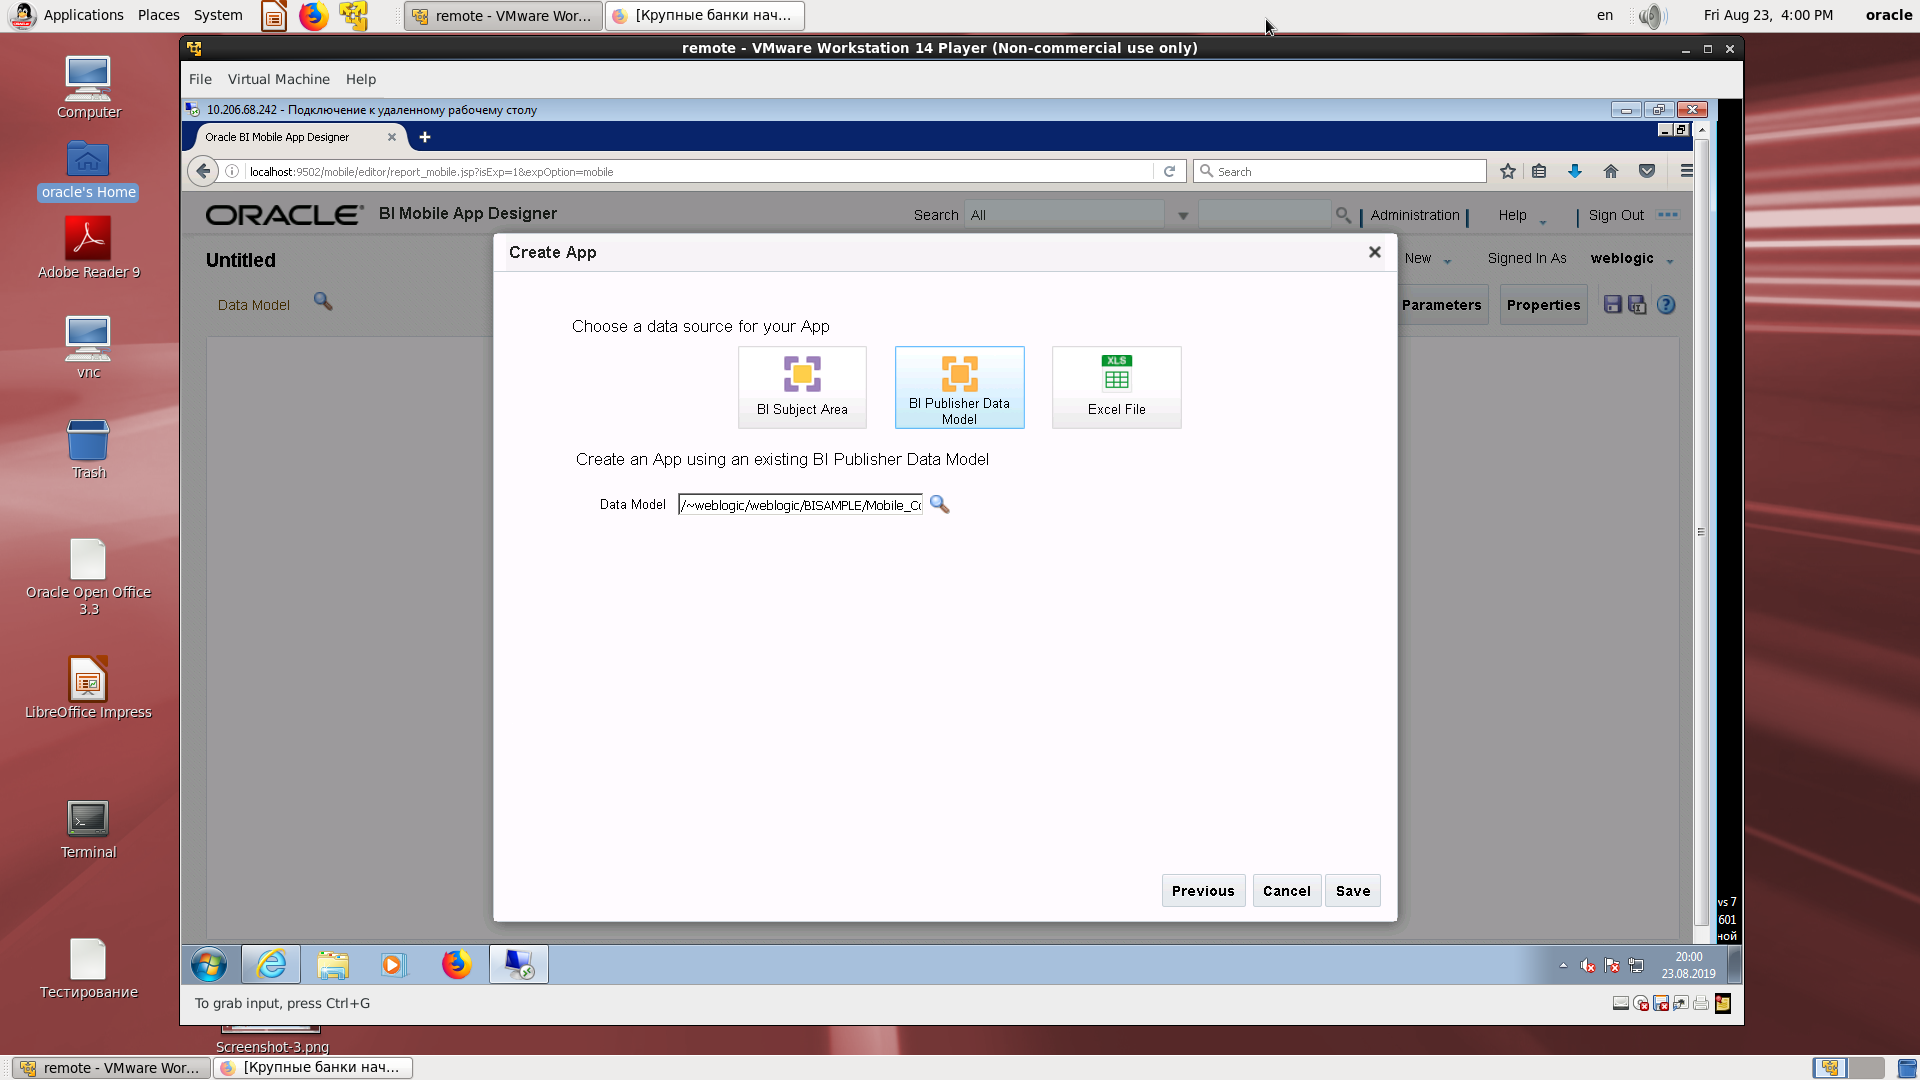
Source selection - BI Publisher and assignment to the desired field.

The first step in creating an application.
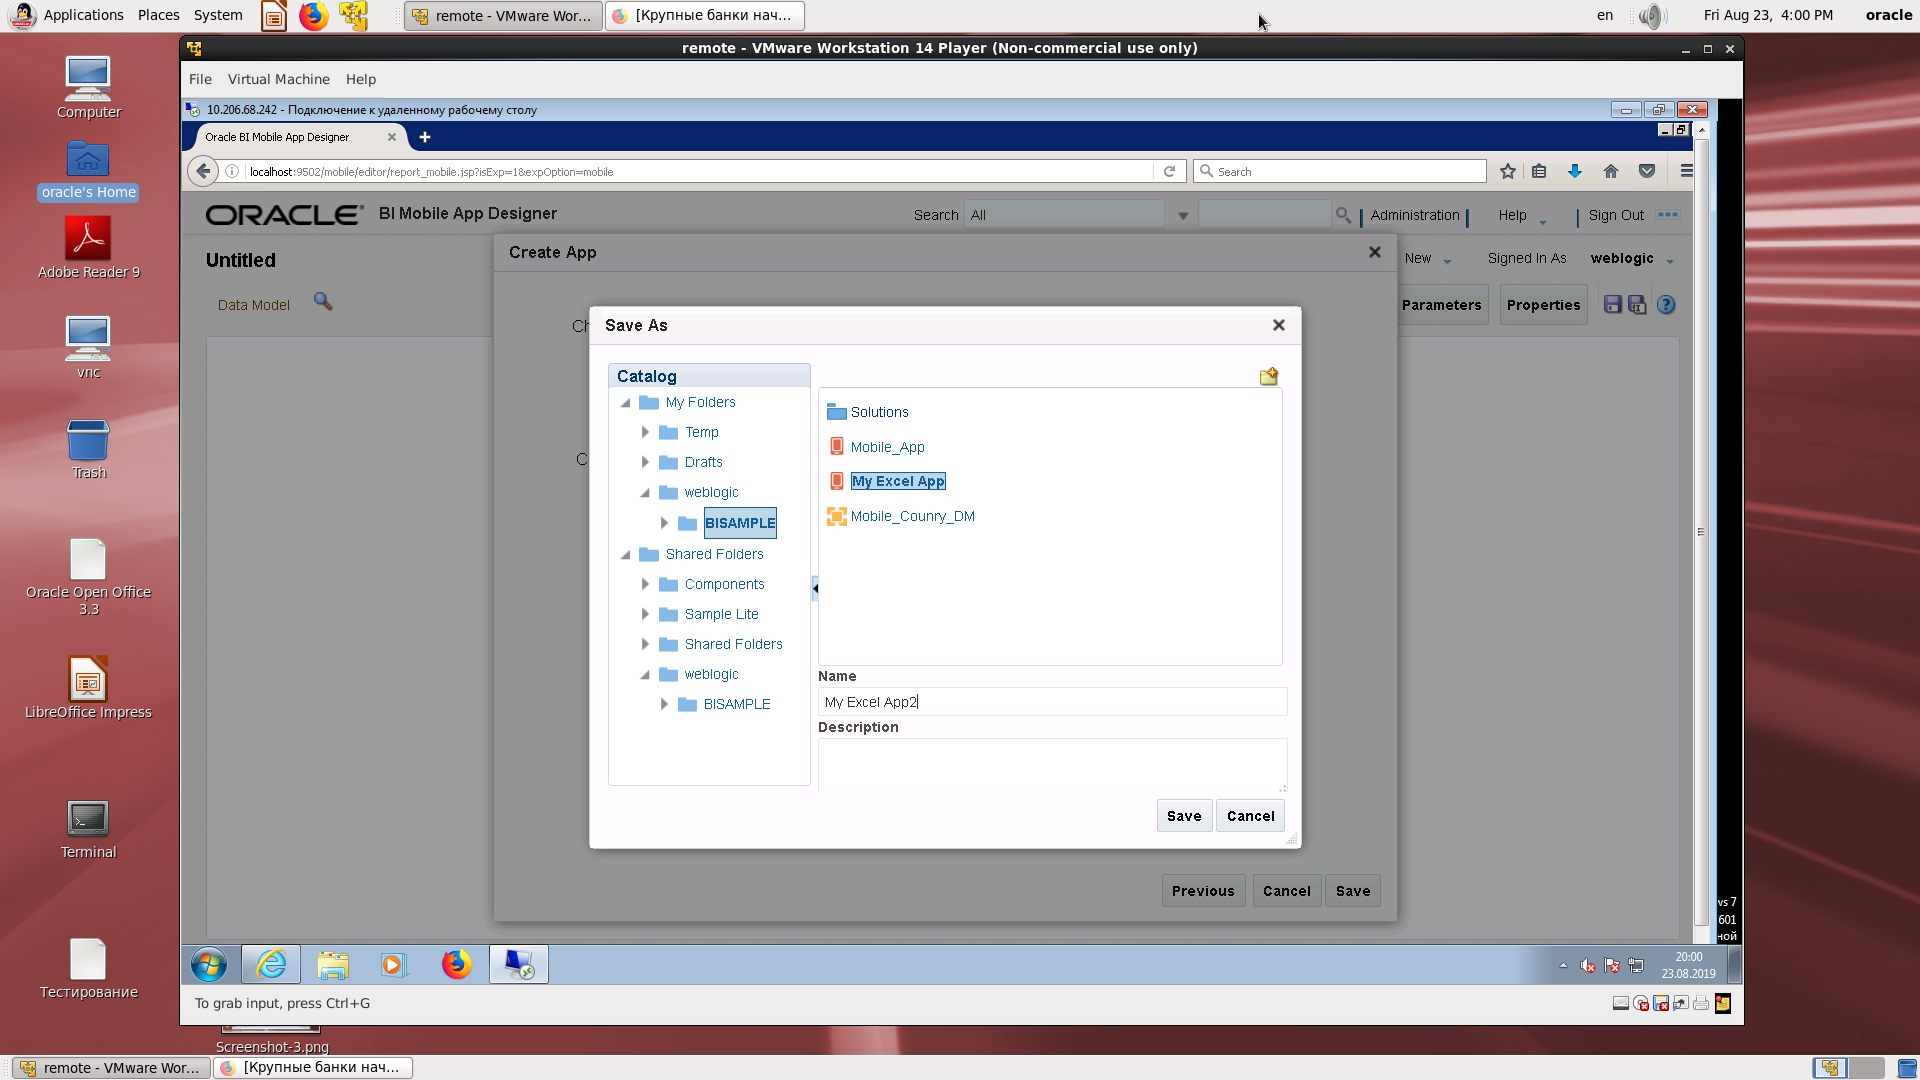
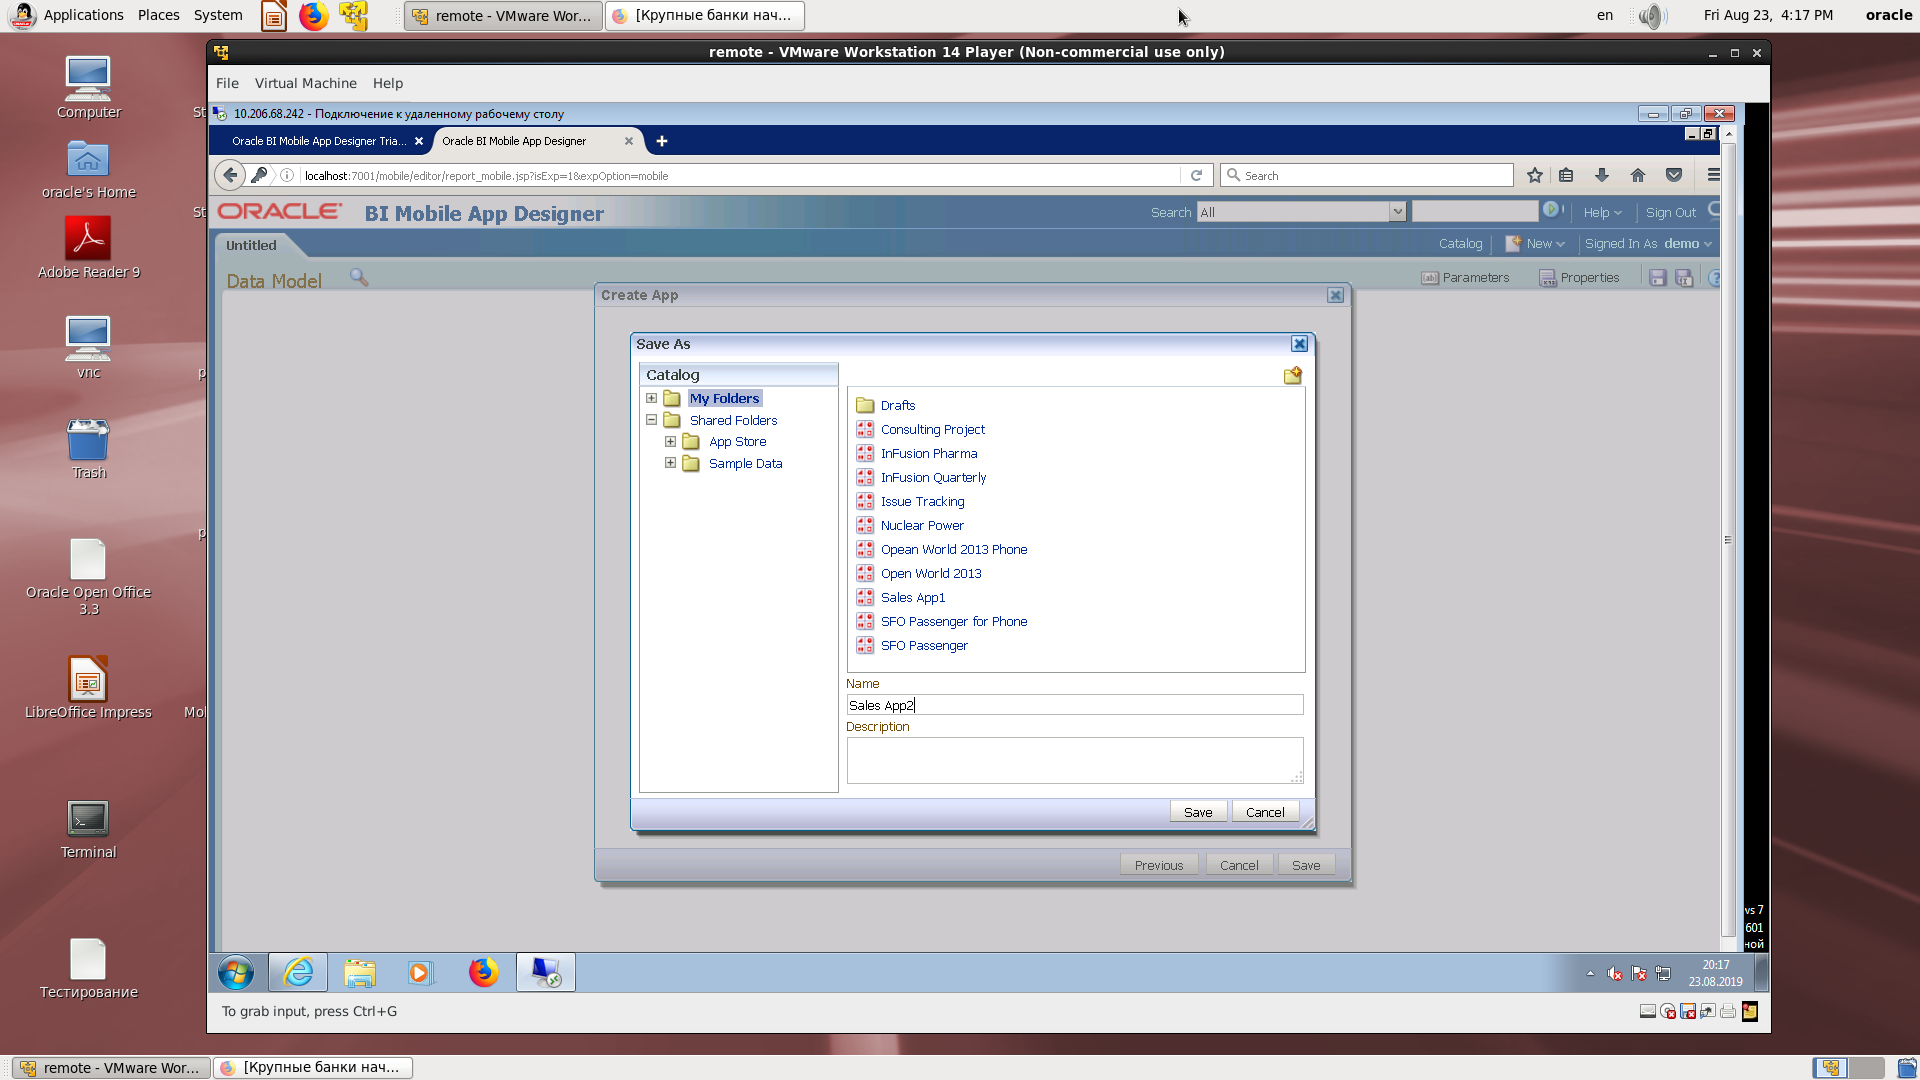
Saving the application with a name.
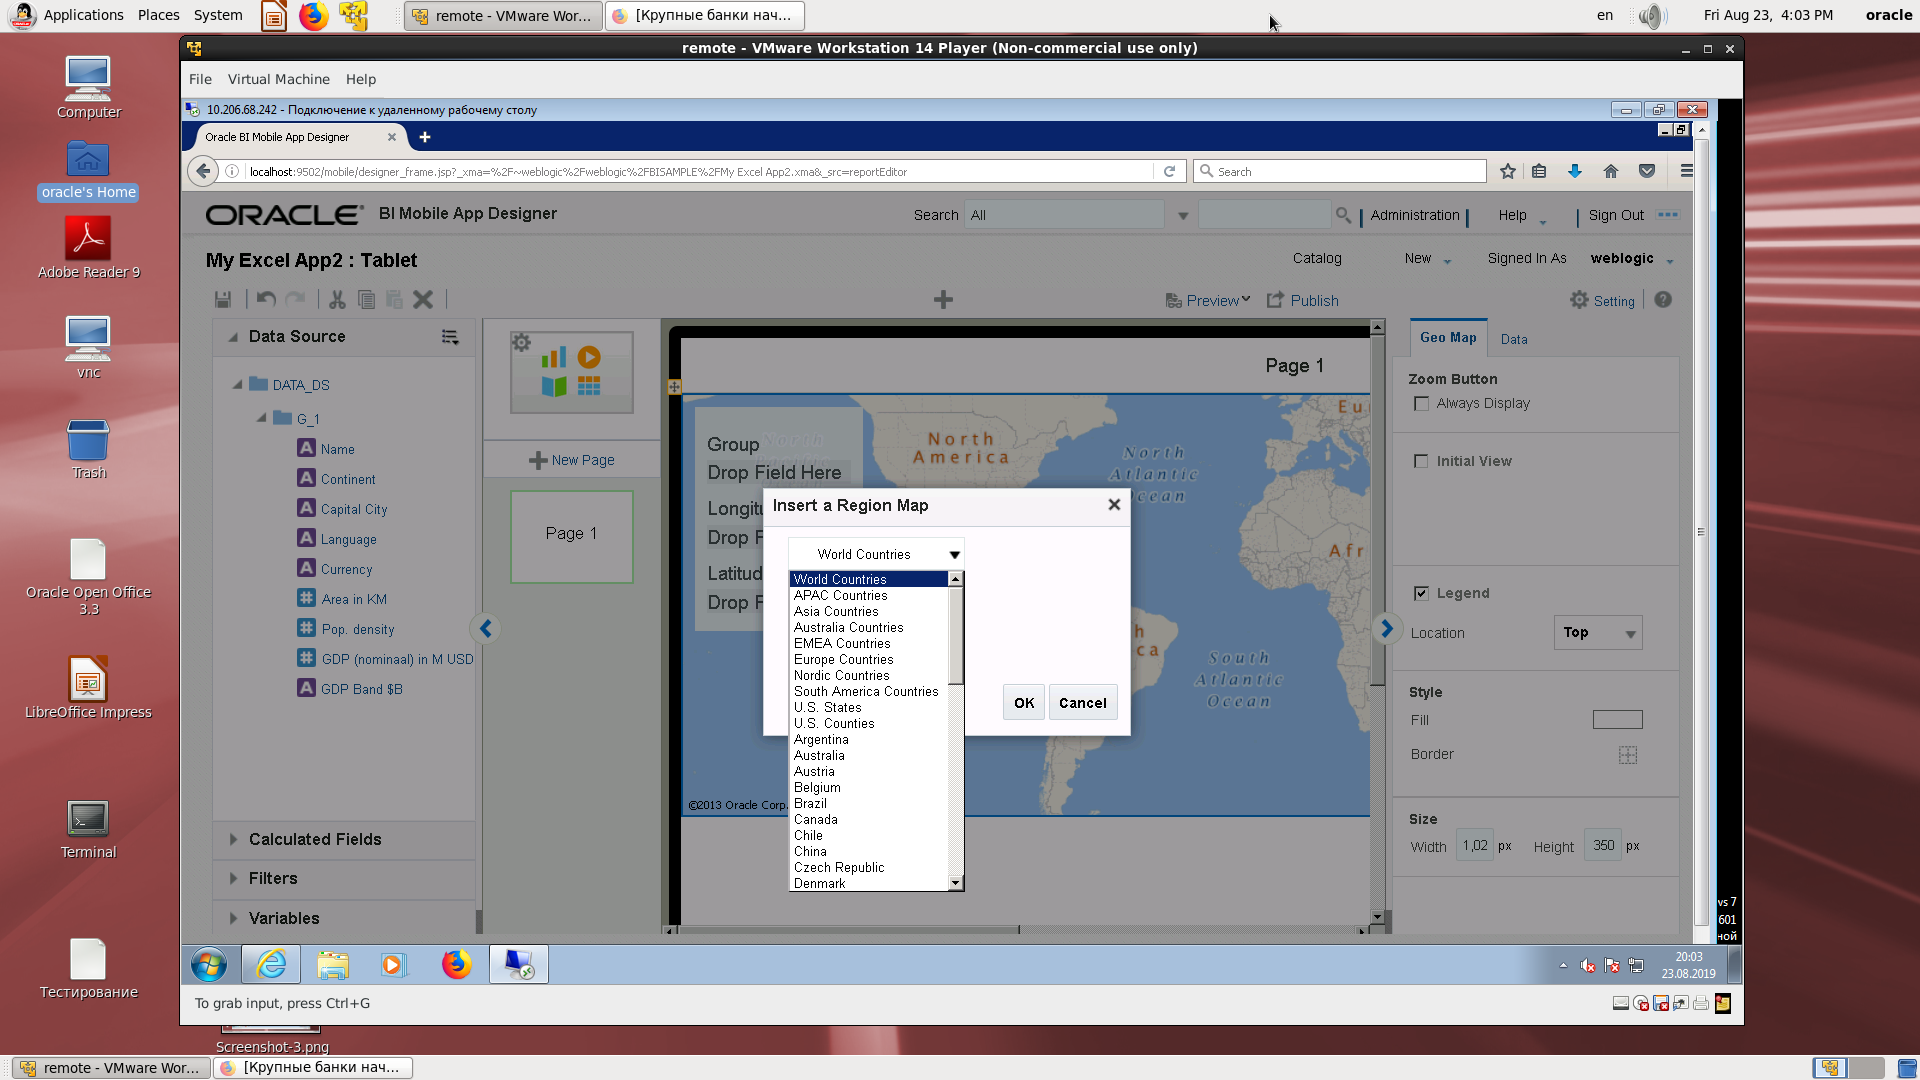
An example of the ability to insert a card.
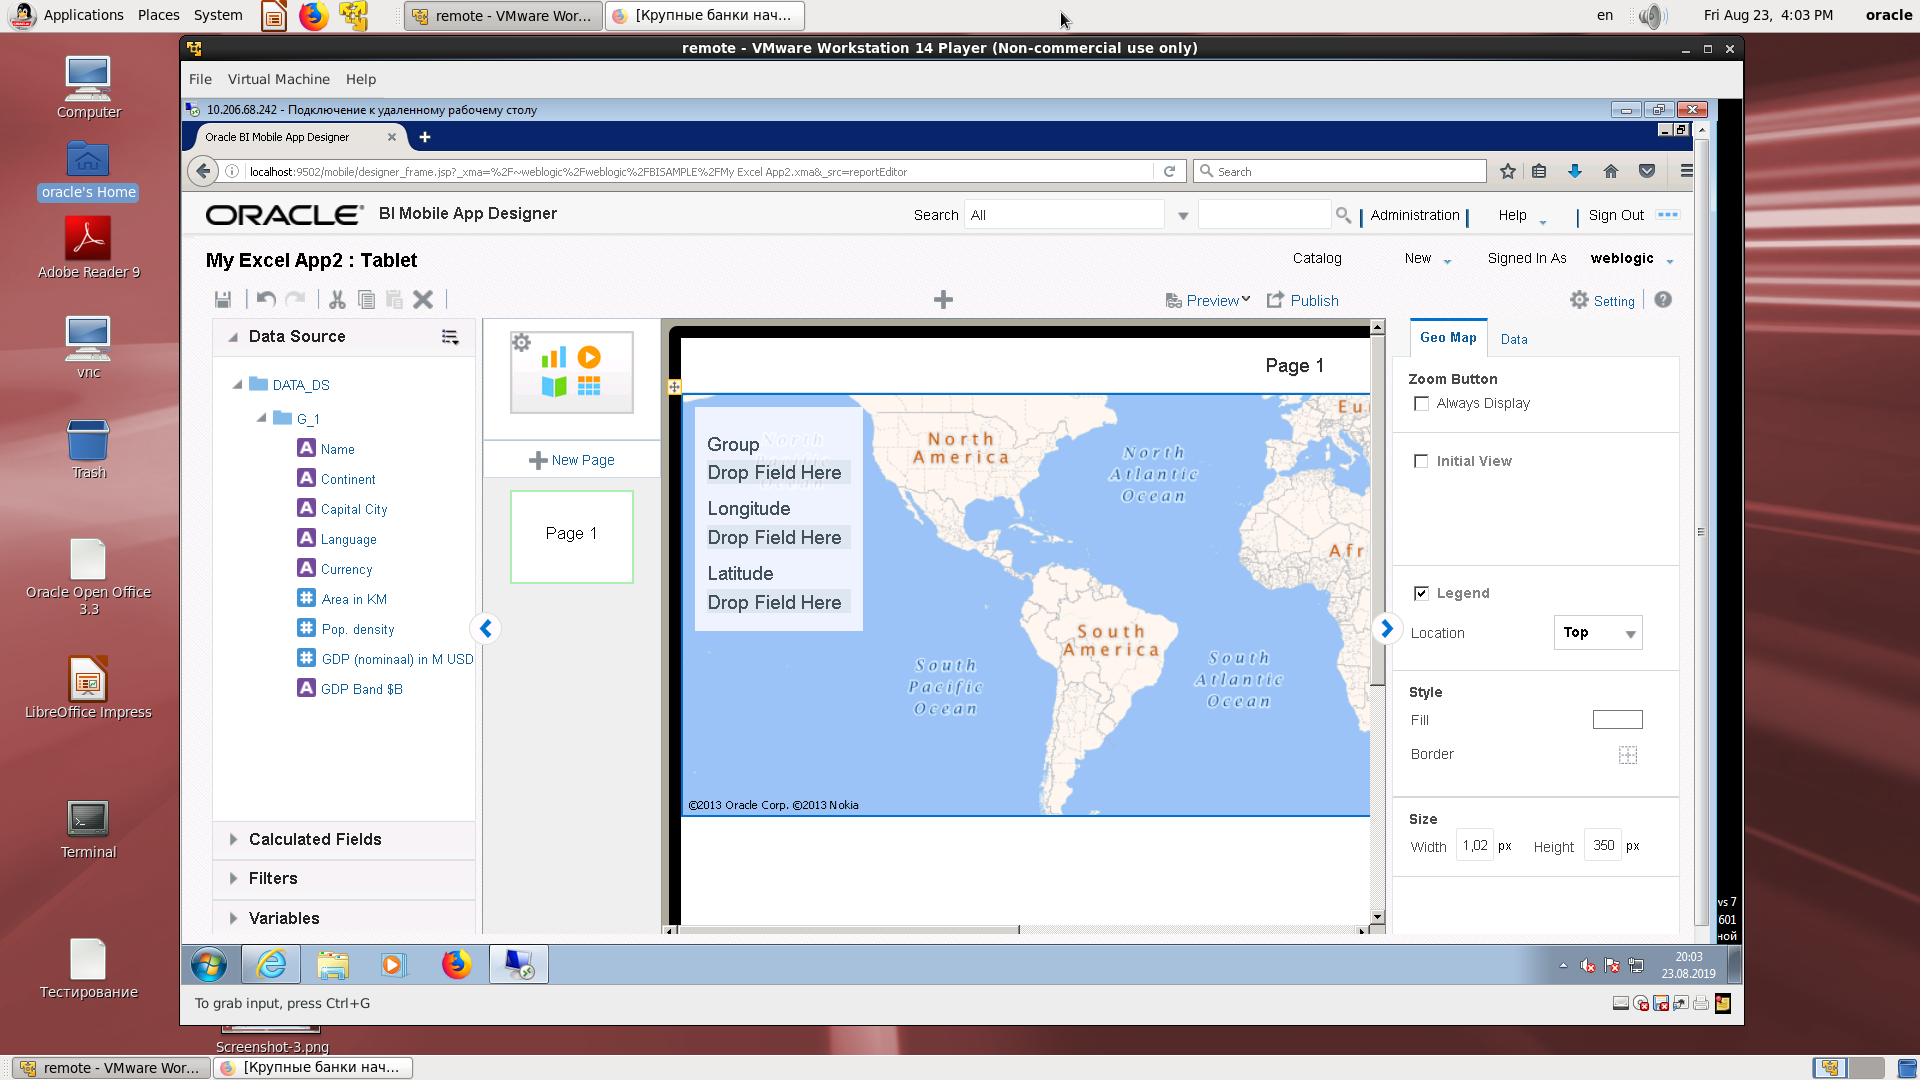
A rich set of mapped regions.
Blank world map.
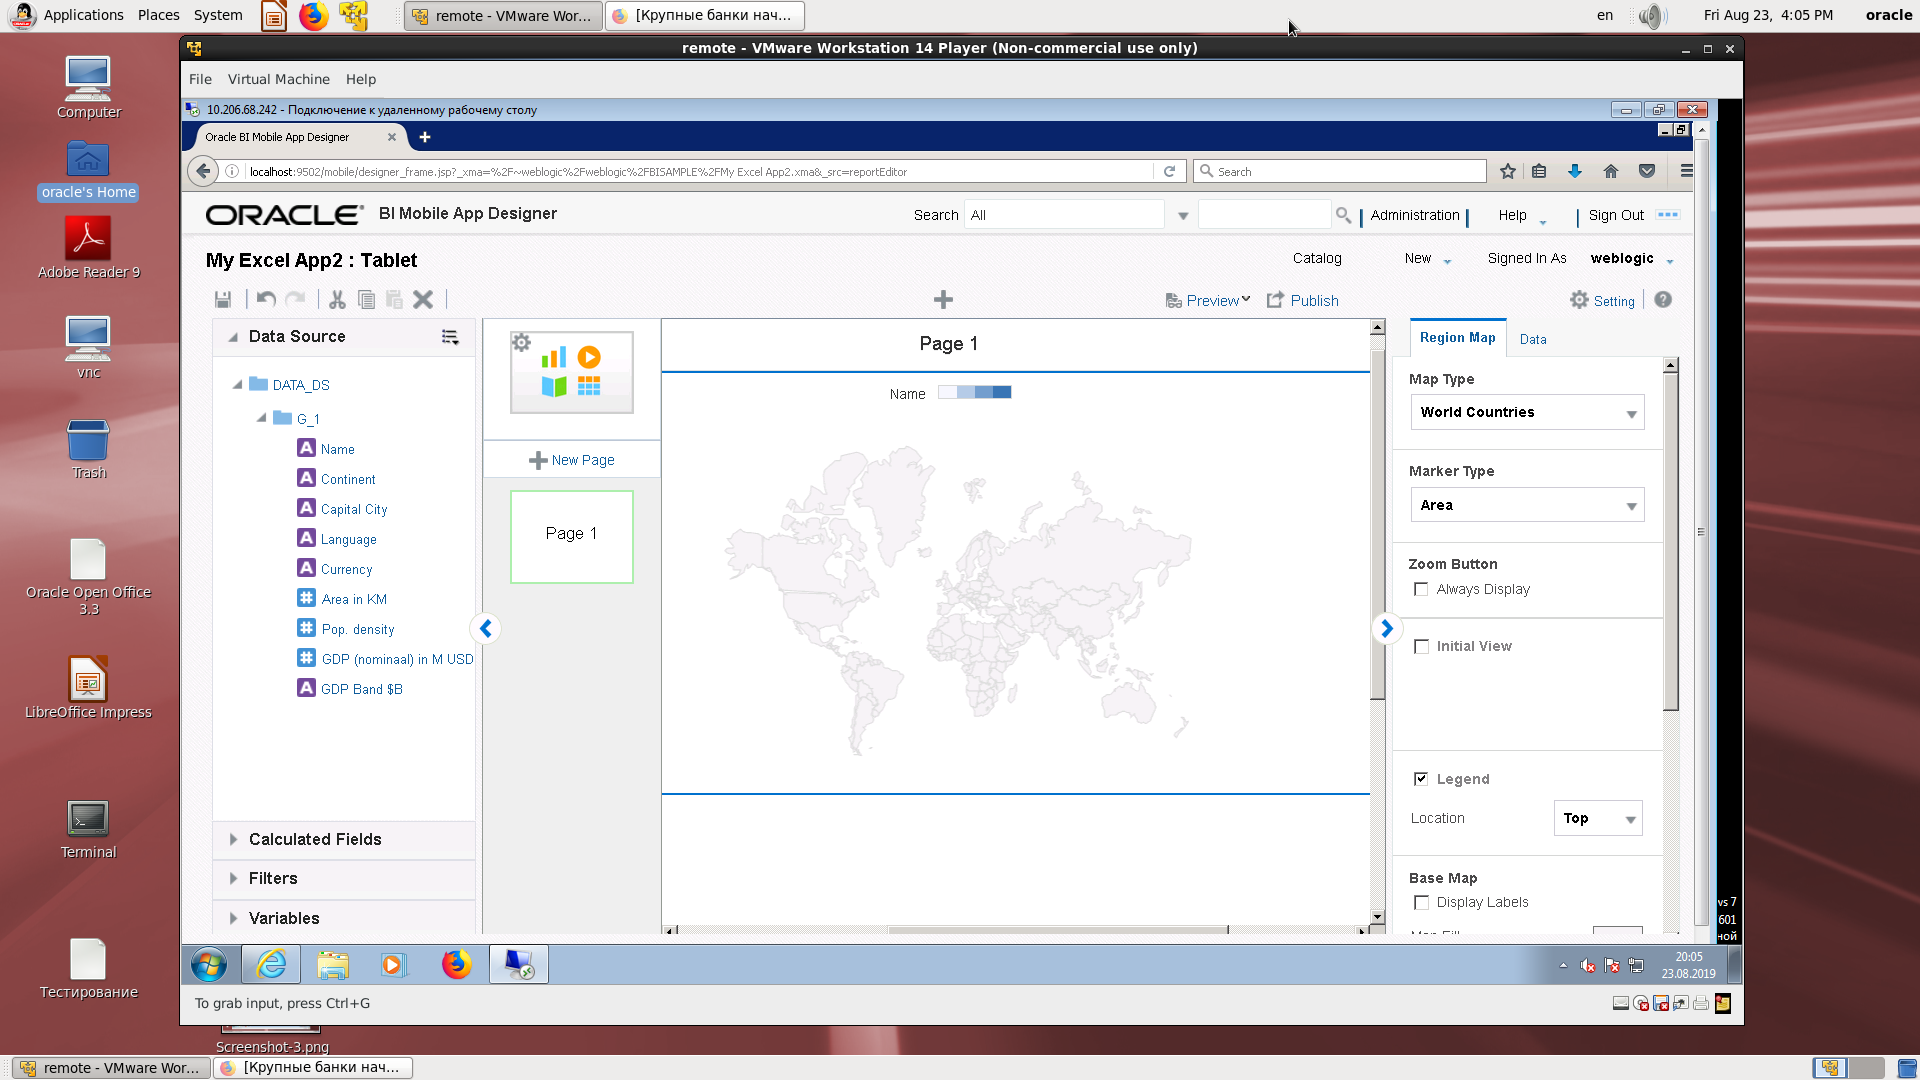
The simplest country-language report (one country, one language).

Repetition of the previous one.
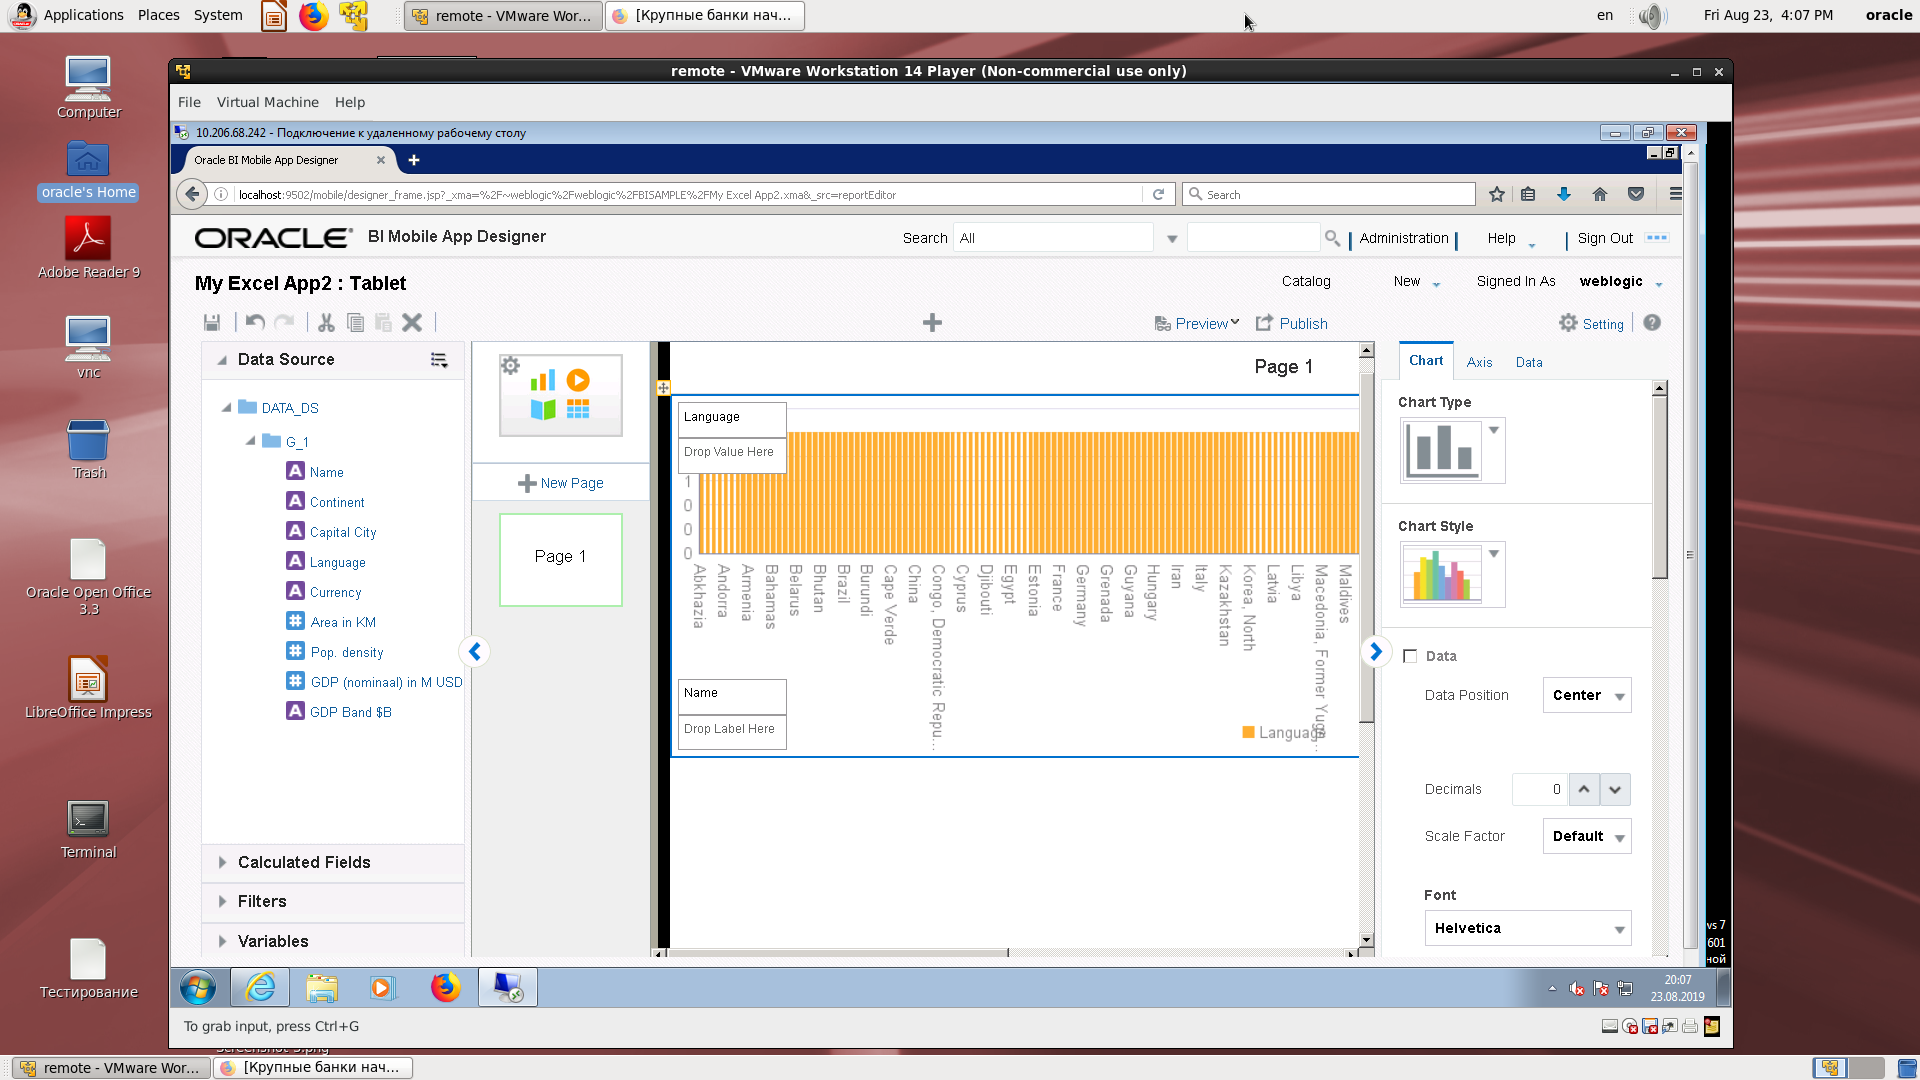
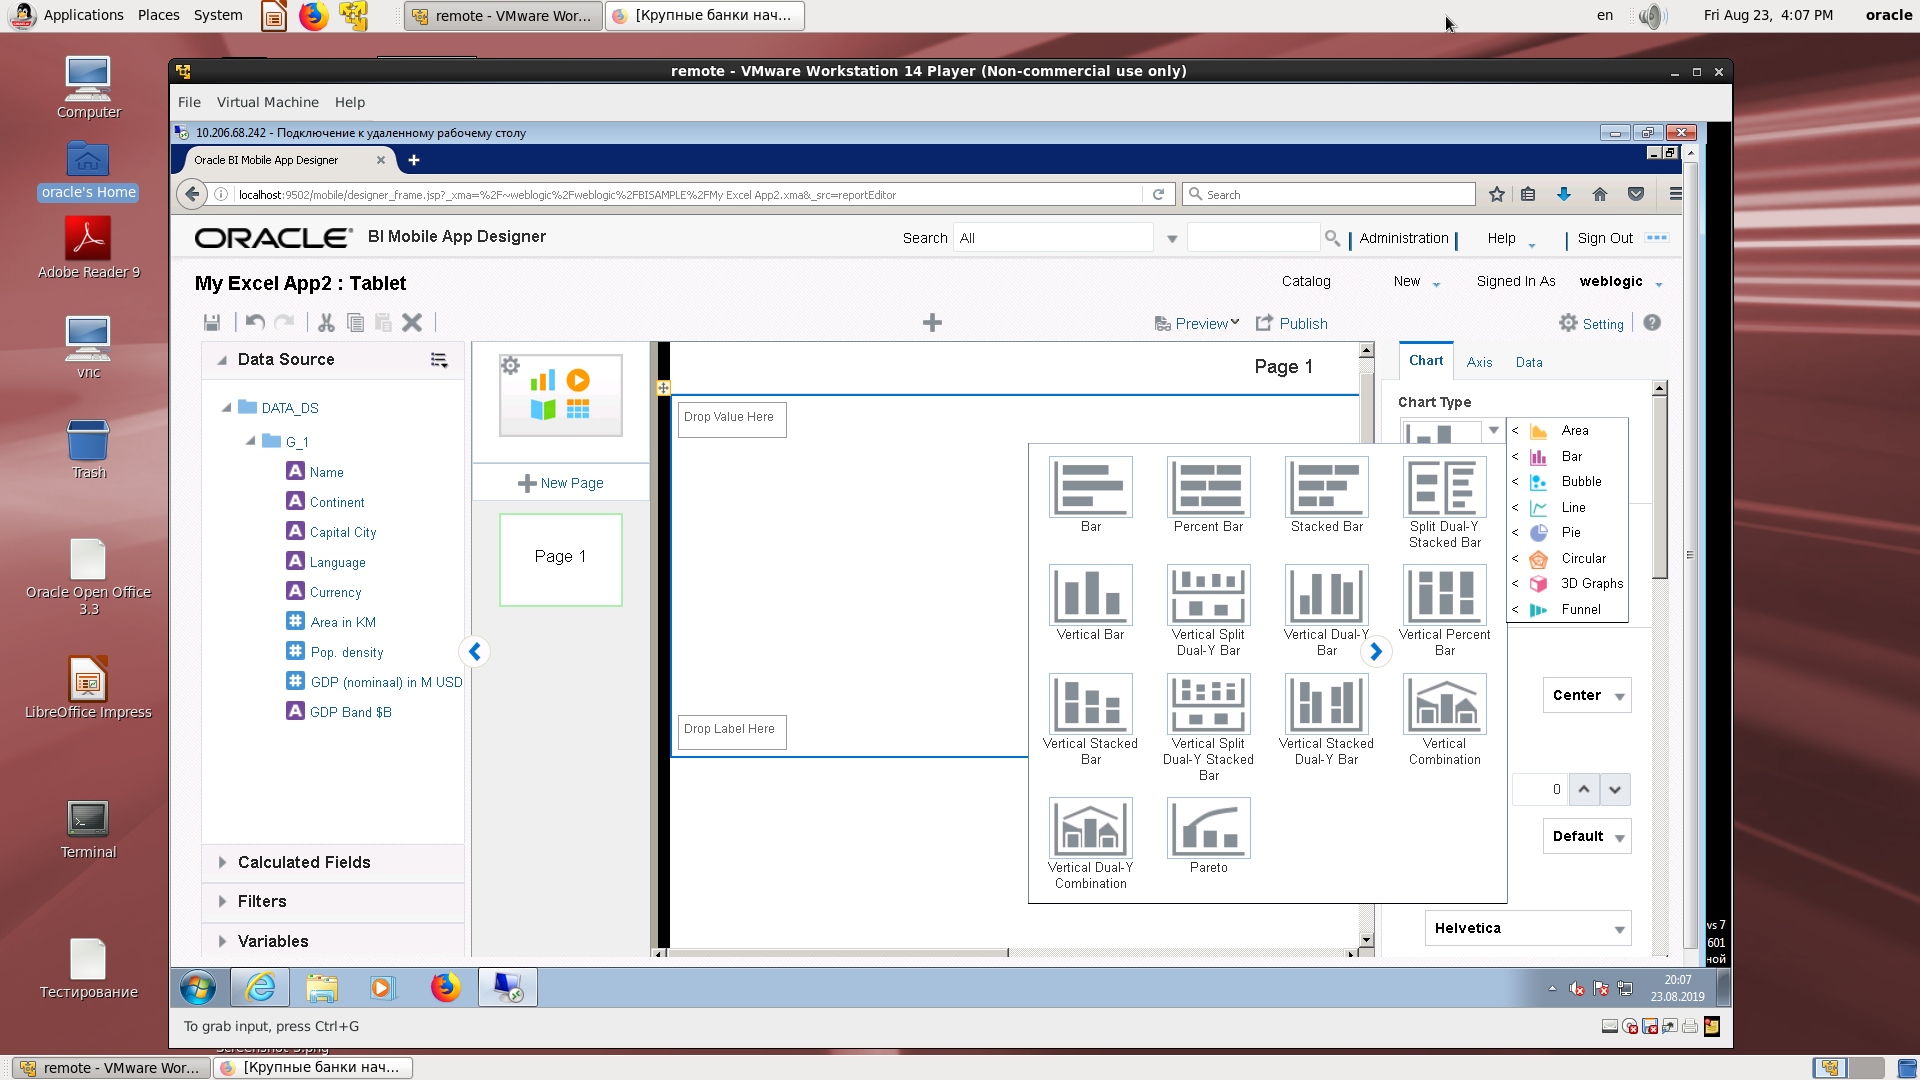
An example of the possibility of choosing the type of diagrams.
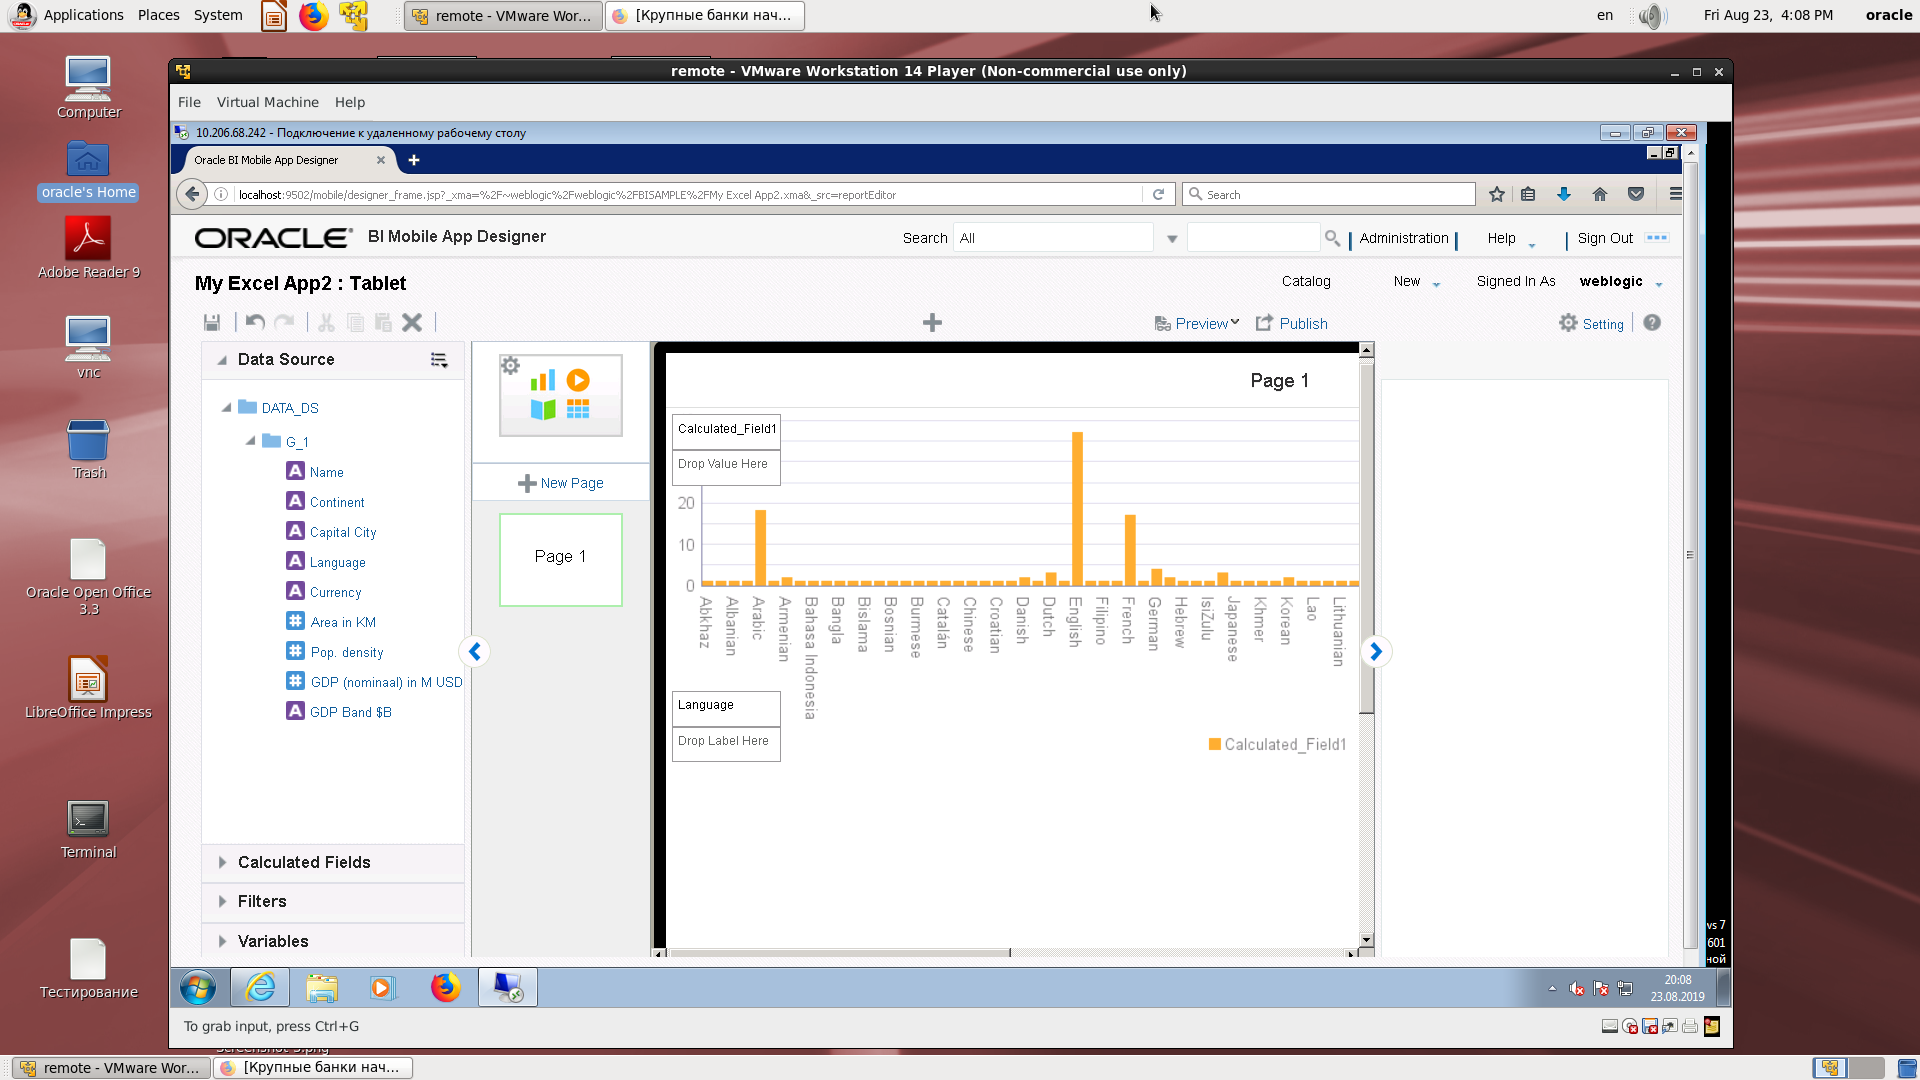
Display of a computable field by the number of languages (language, number of references).
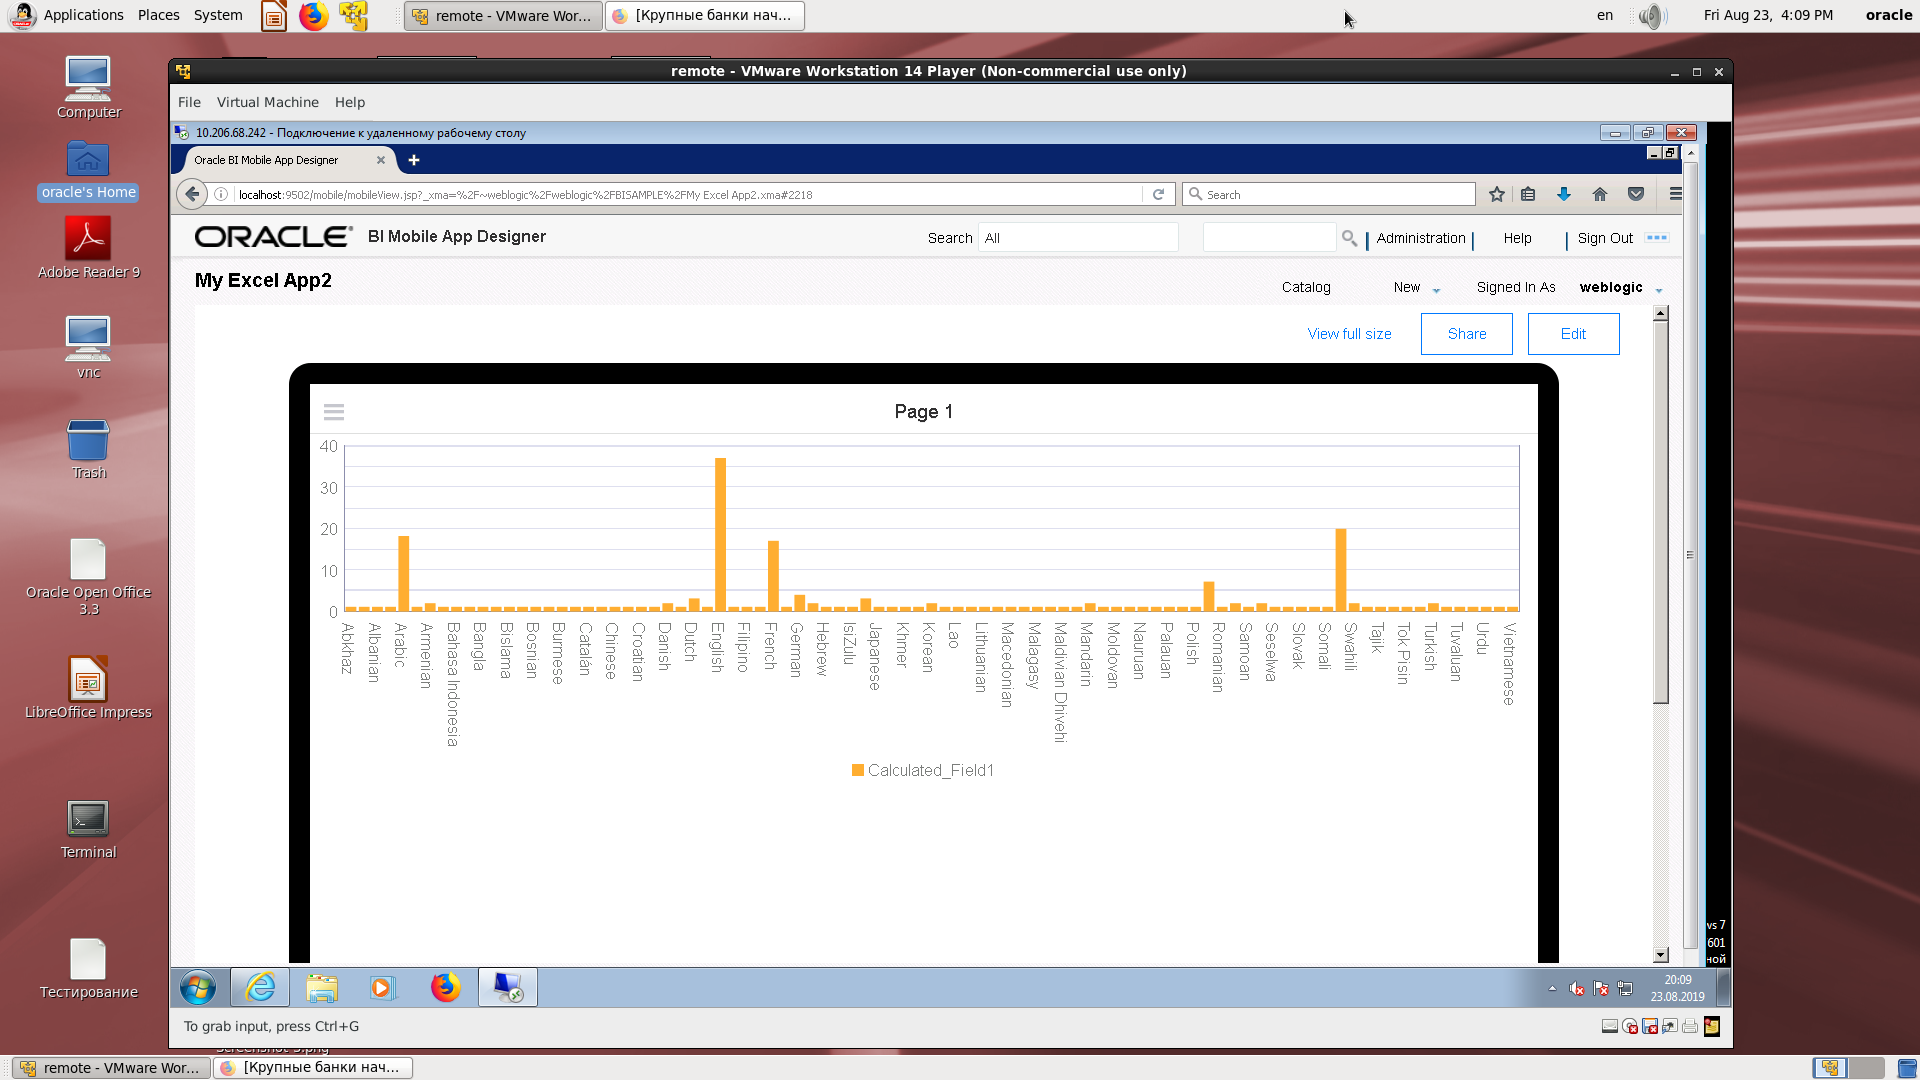
View on a mobile device.
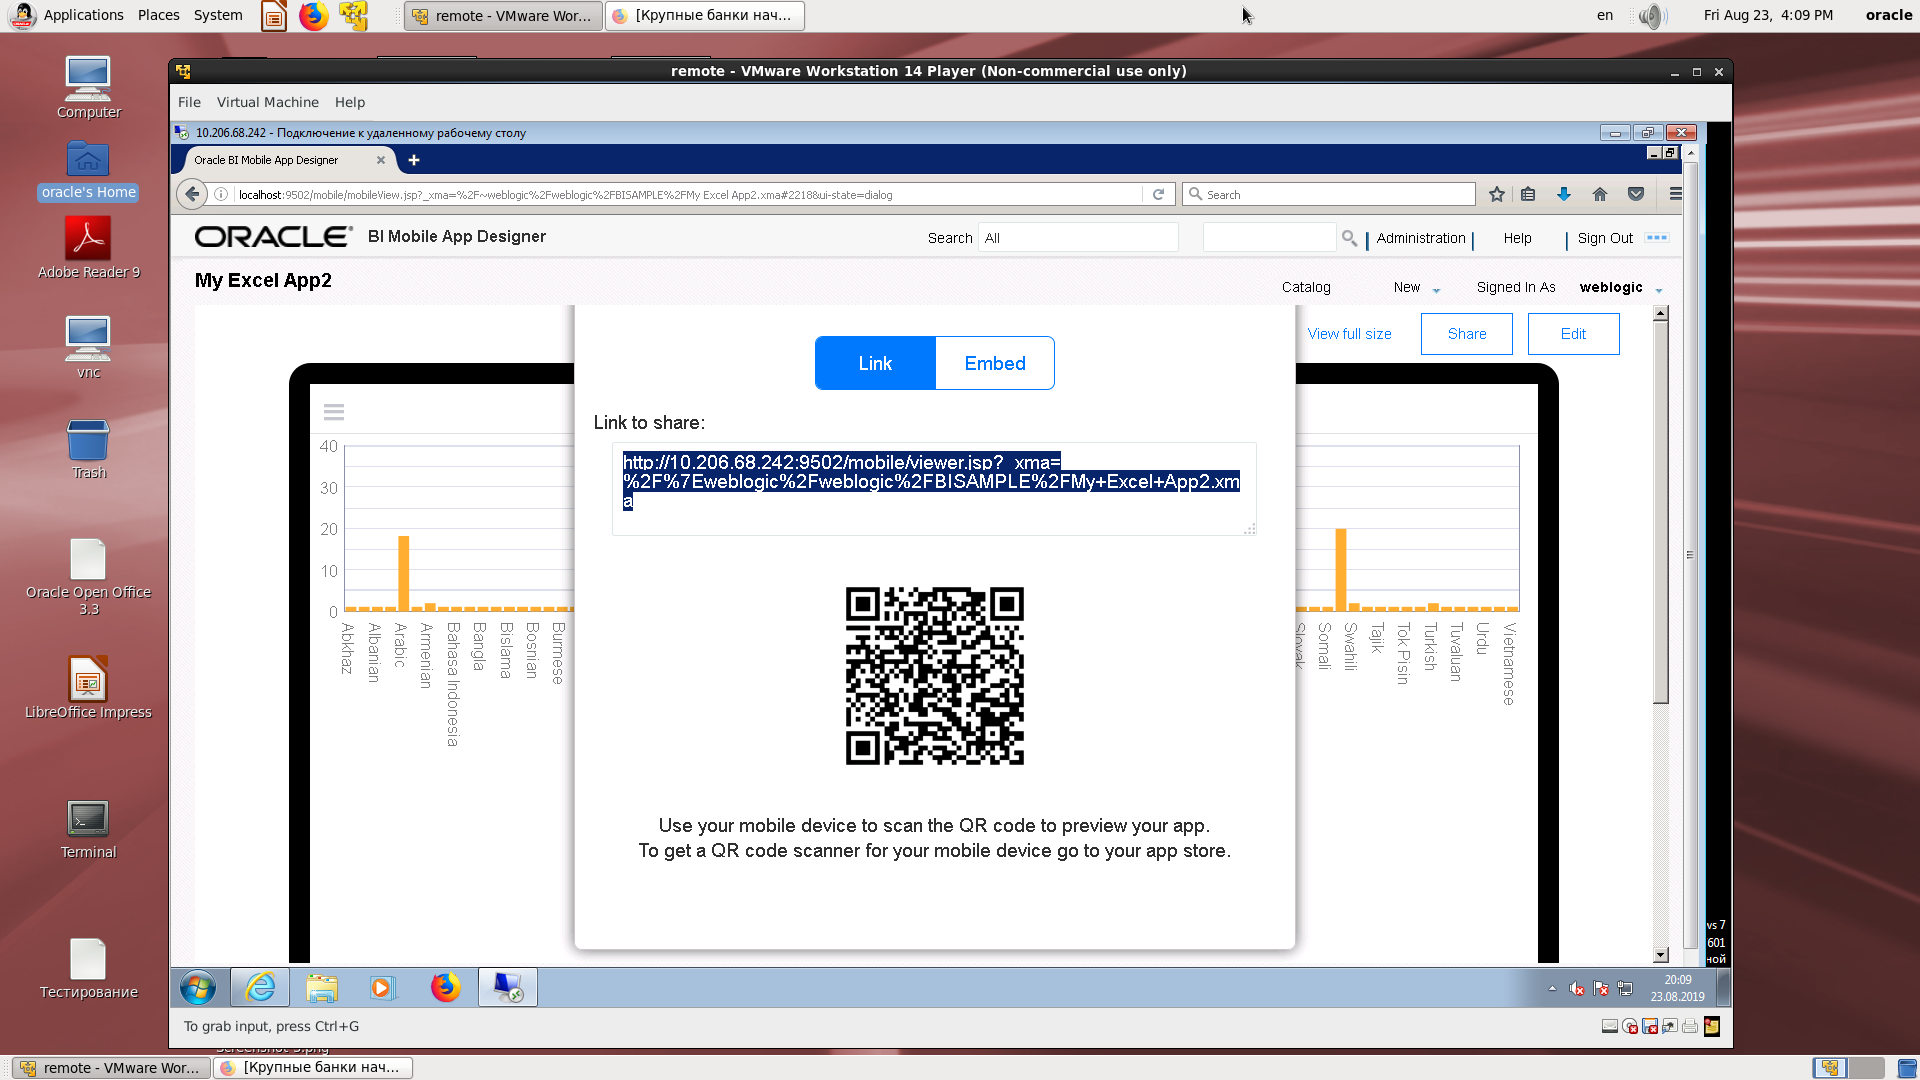
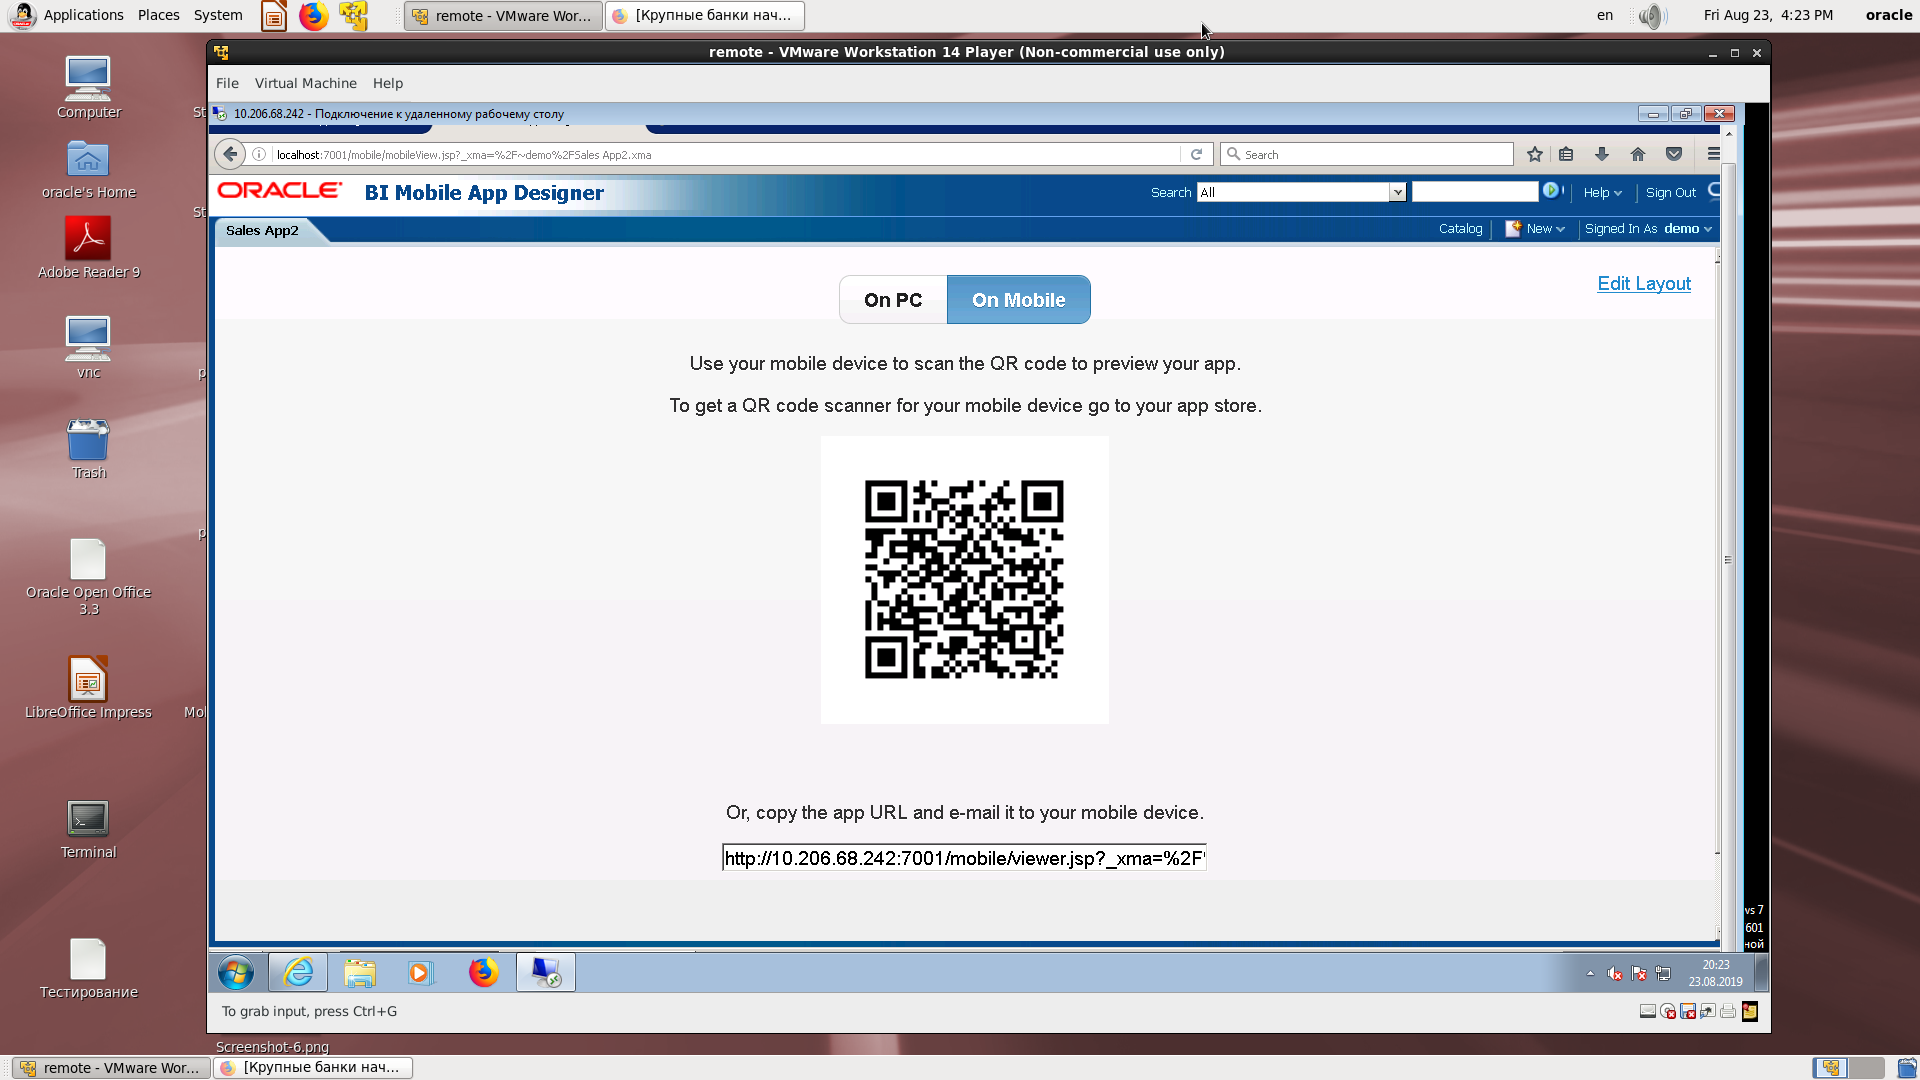
A QR code to open on a mobile device.
Code for embedded applications.

2. We take the existing subject area on Excel and repeat.
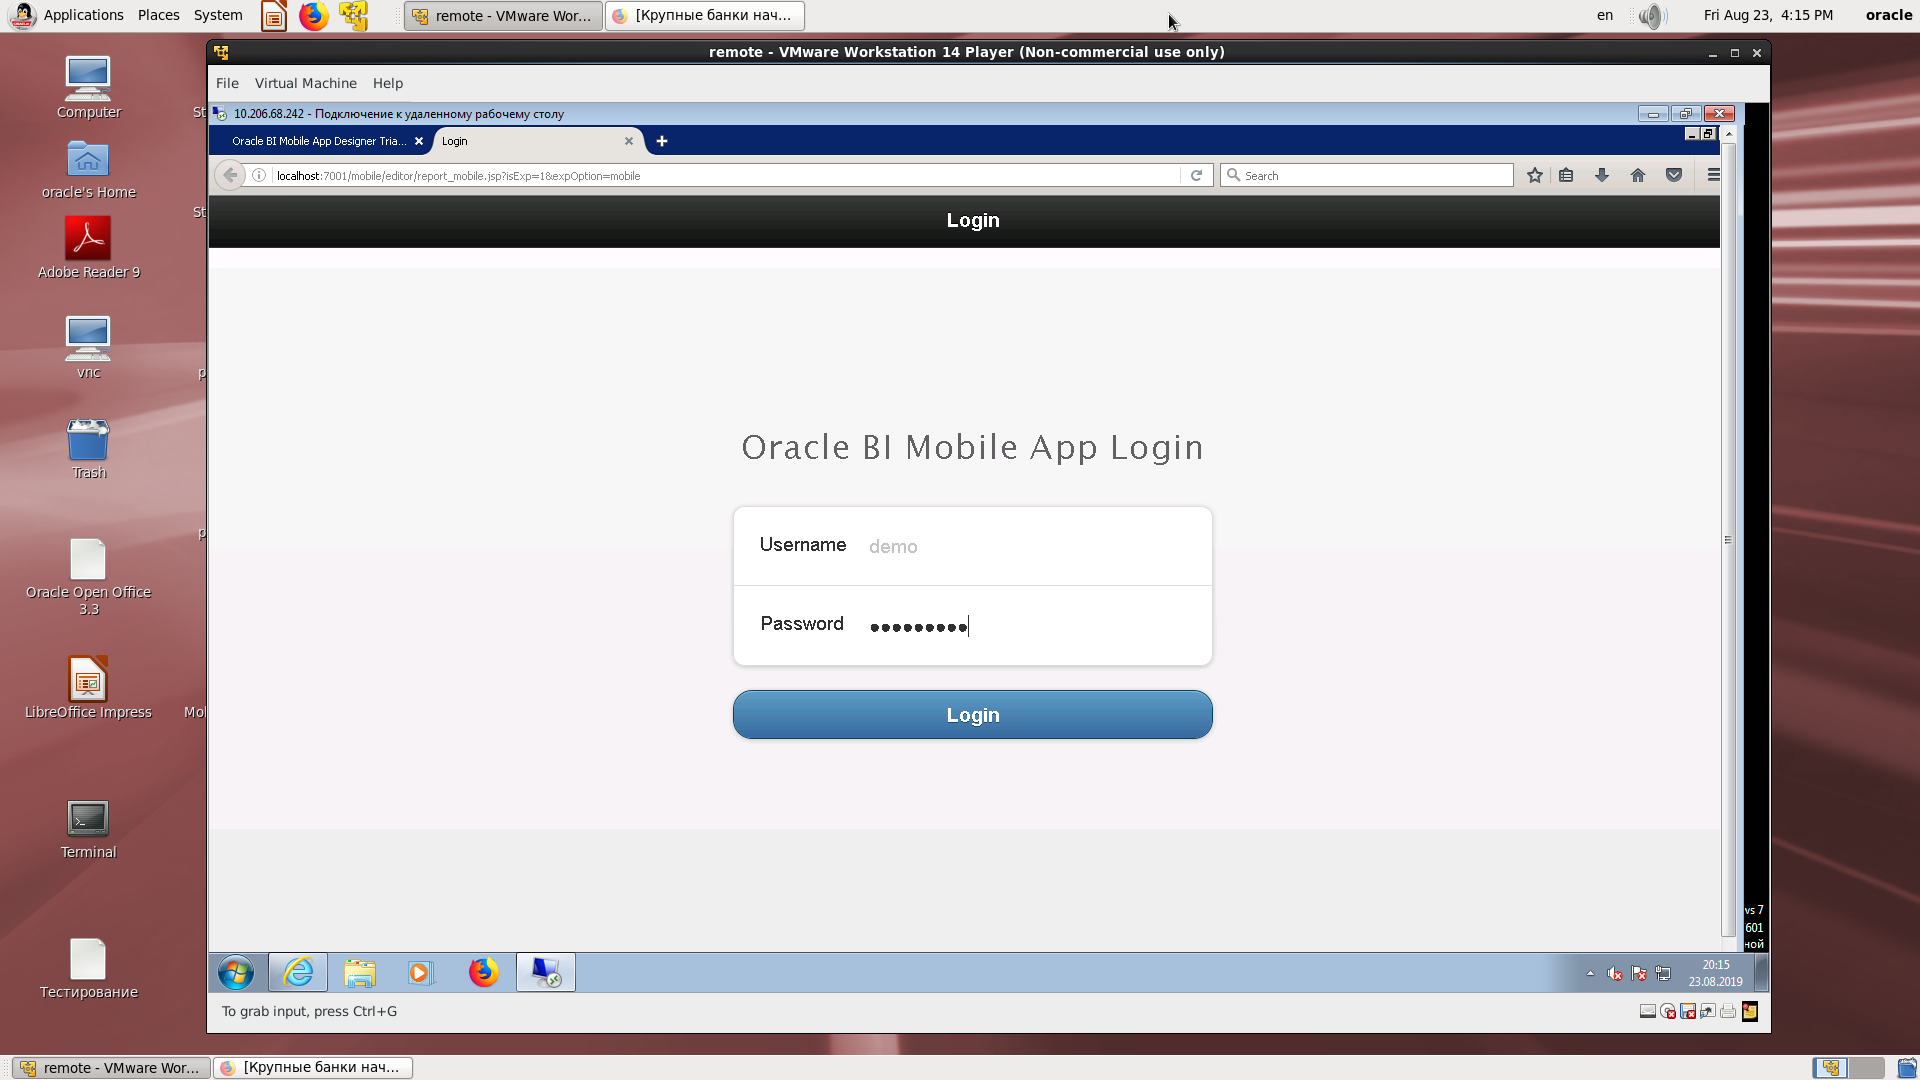
Login to a mobile development demo.
Select the type of mobile device.
Discovery of the source.

Search in the catalog.
Assigning the desired field in the wizard.
Saving the application with the specified name in the BI directory.
The designer of the screen form. It's incredible, as if we were in the on-line BI Publisher pegging editor.
Select page structure.
Select a page break item to insert a visual item.
Insert a bar chart.

Assignment of display field names to physical fields.
Scale the cell to fill the break.

The final look.
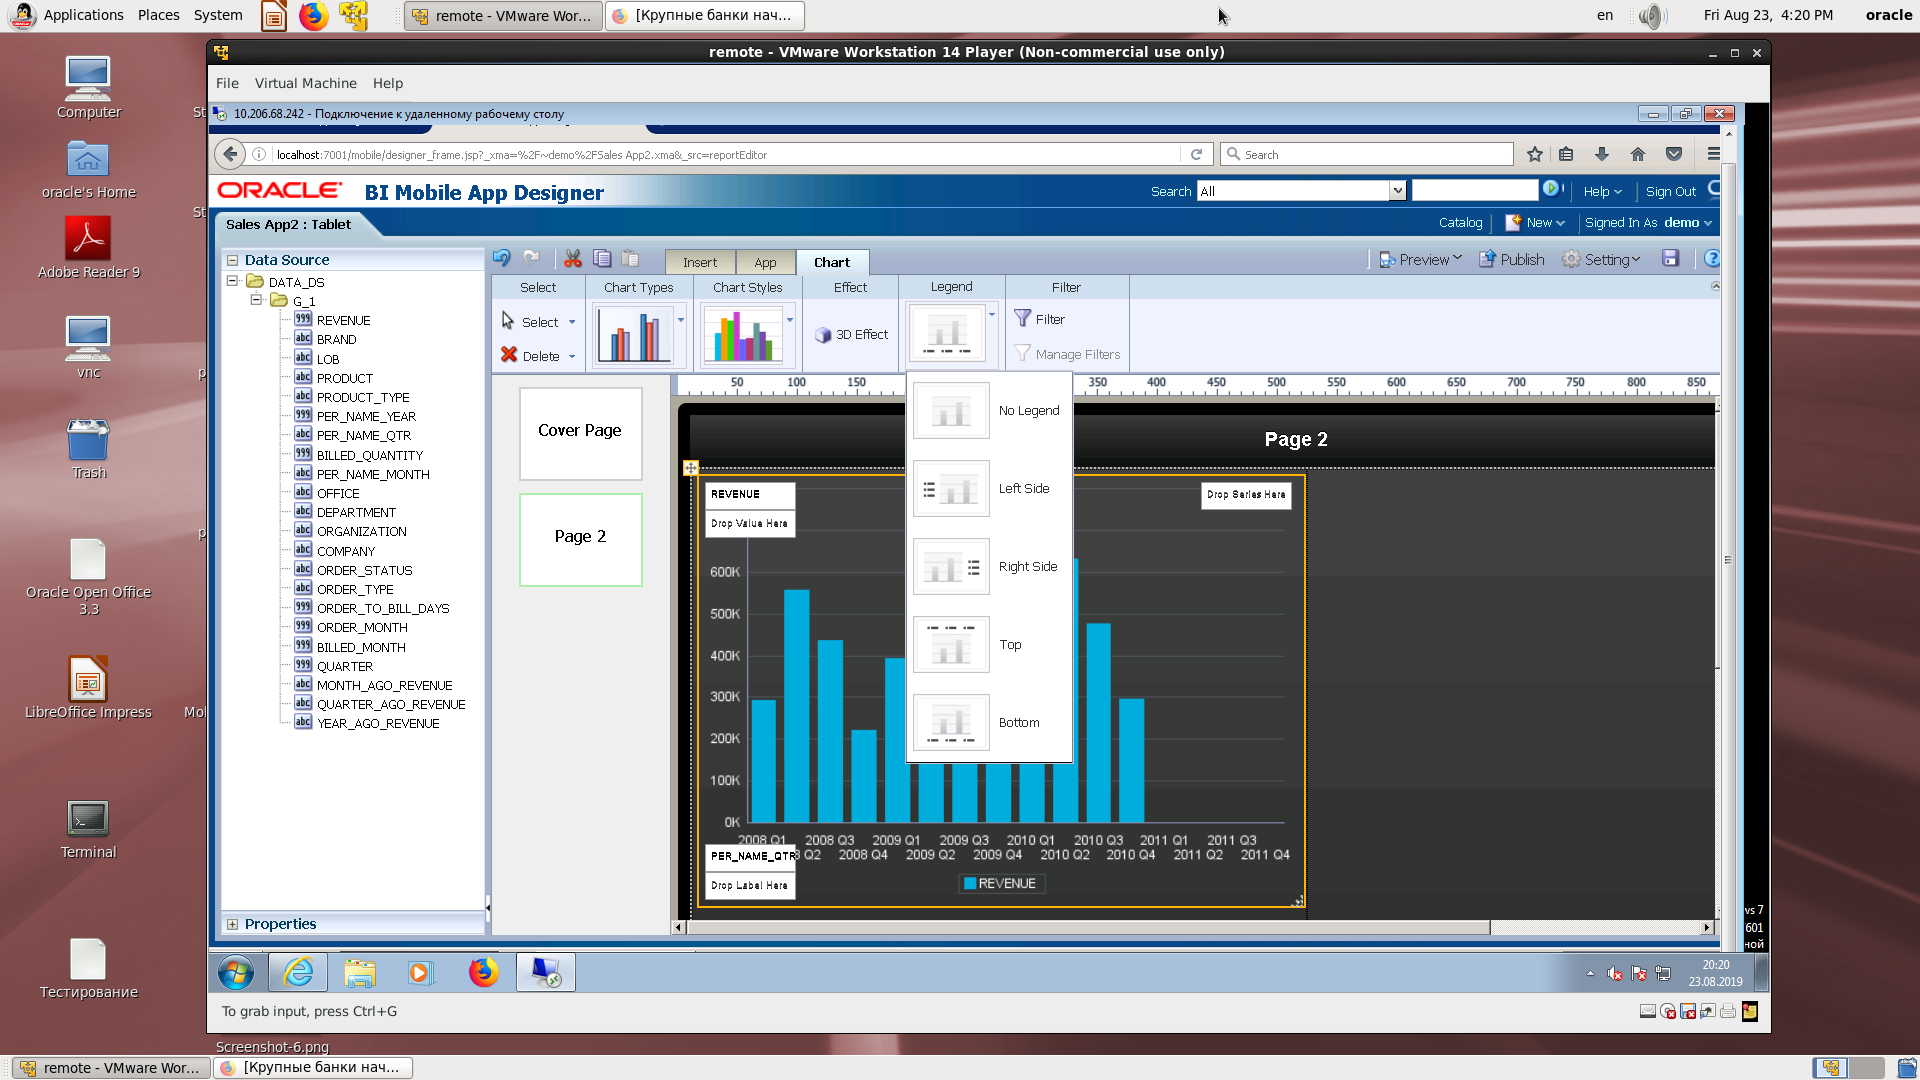
Choosing a place for a legend.
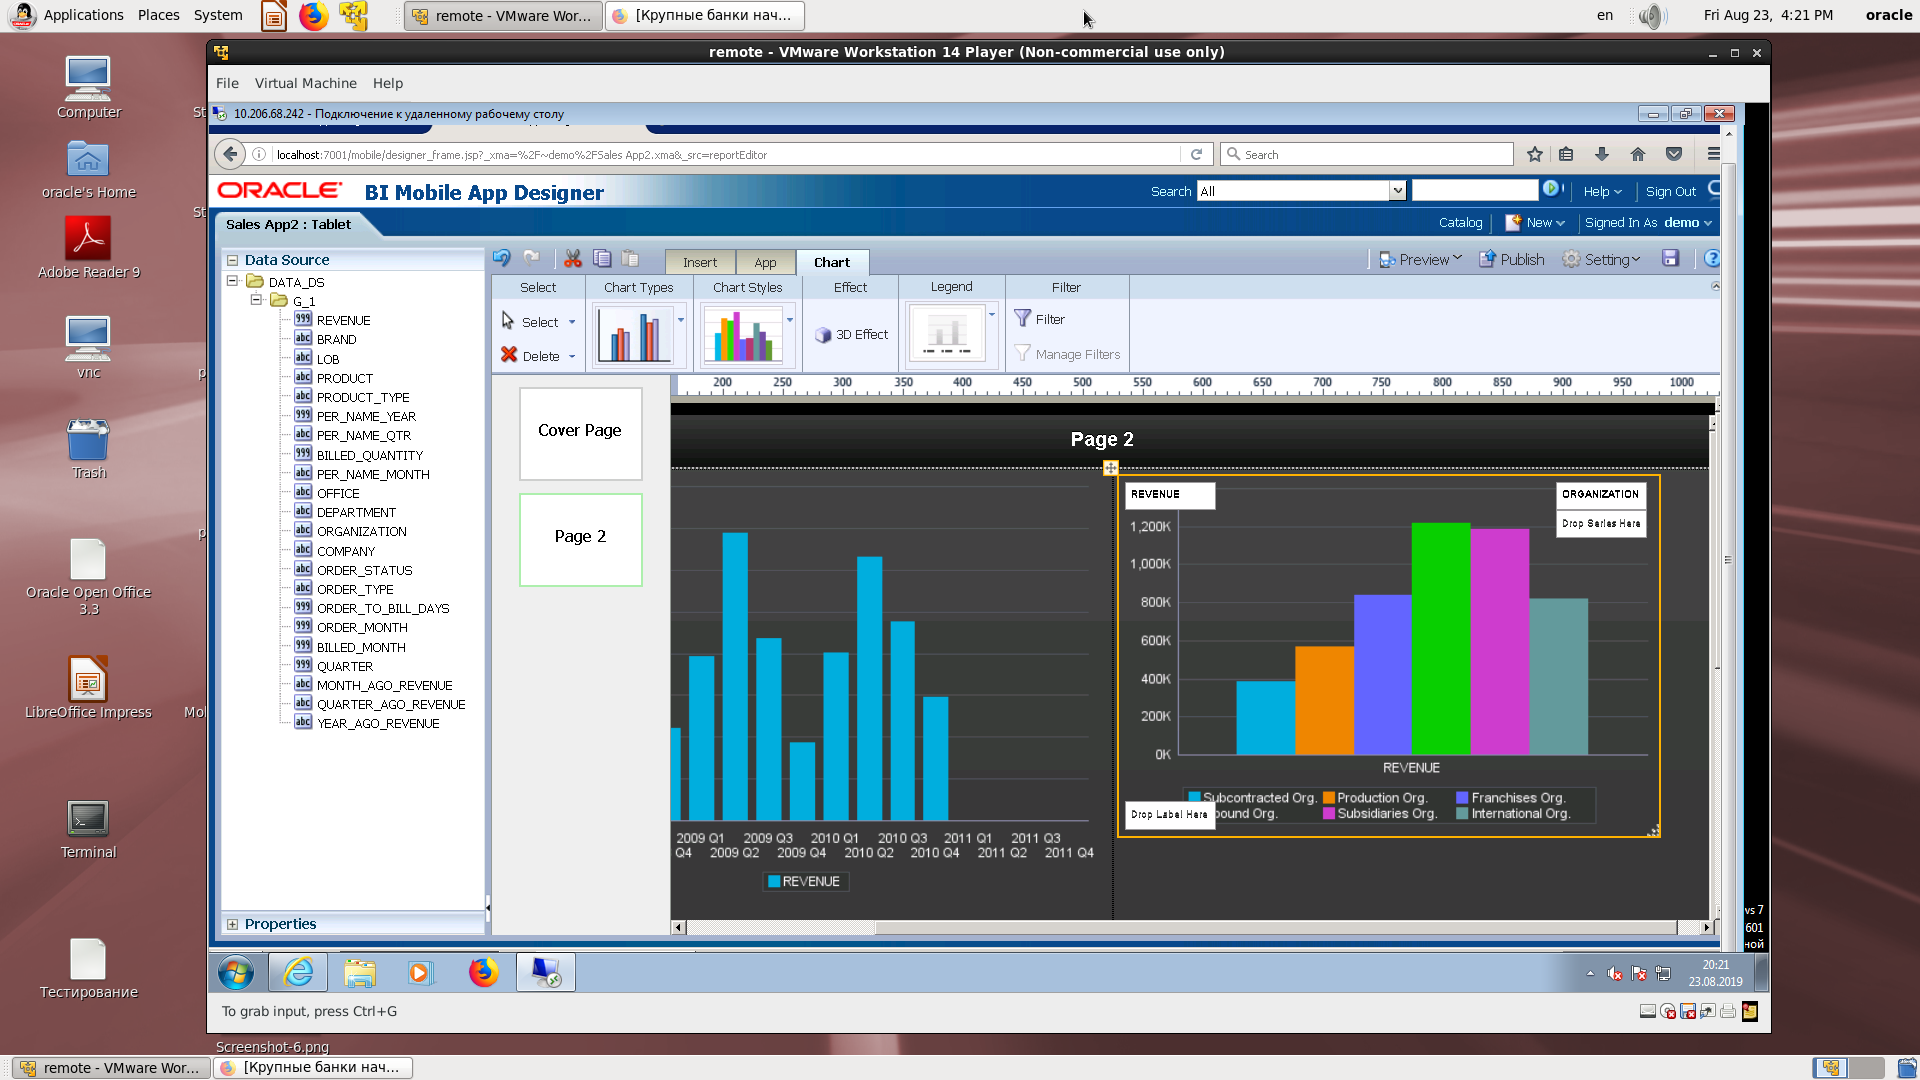
Insert another chart and assign fields.
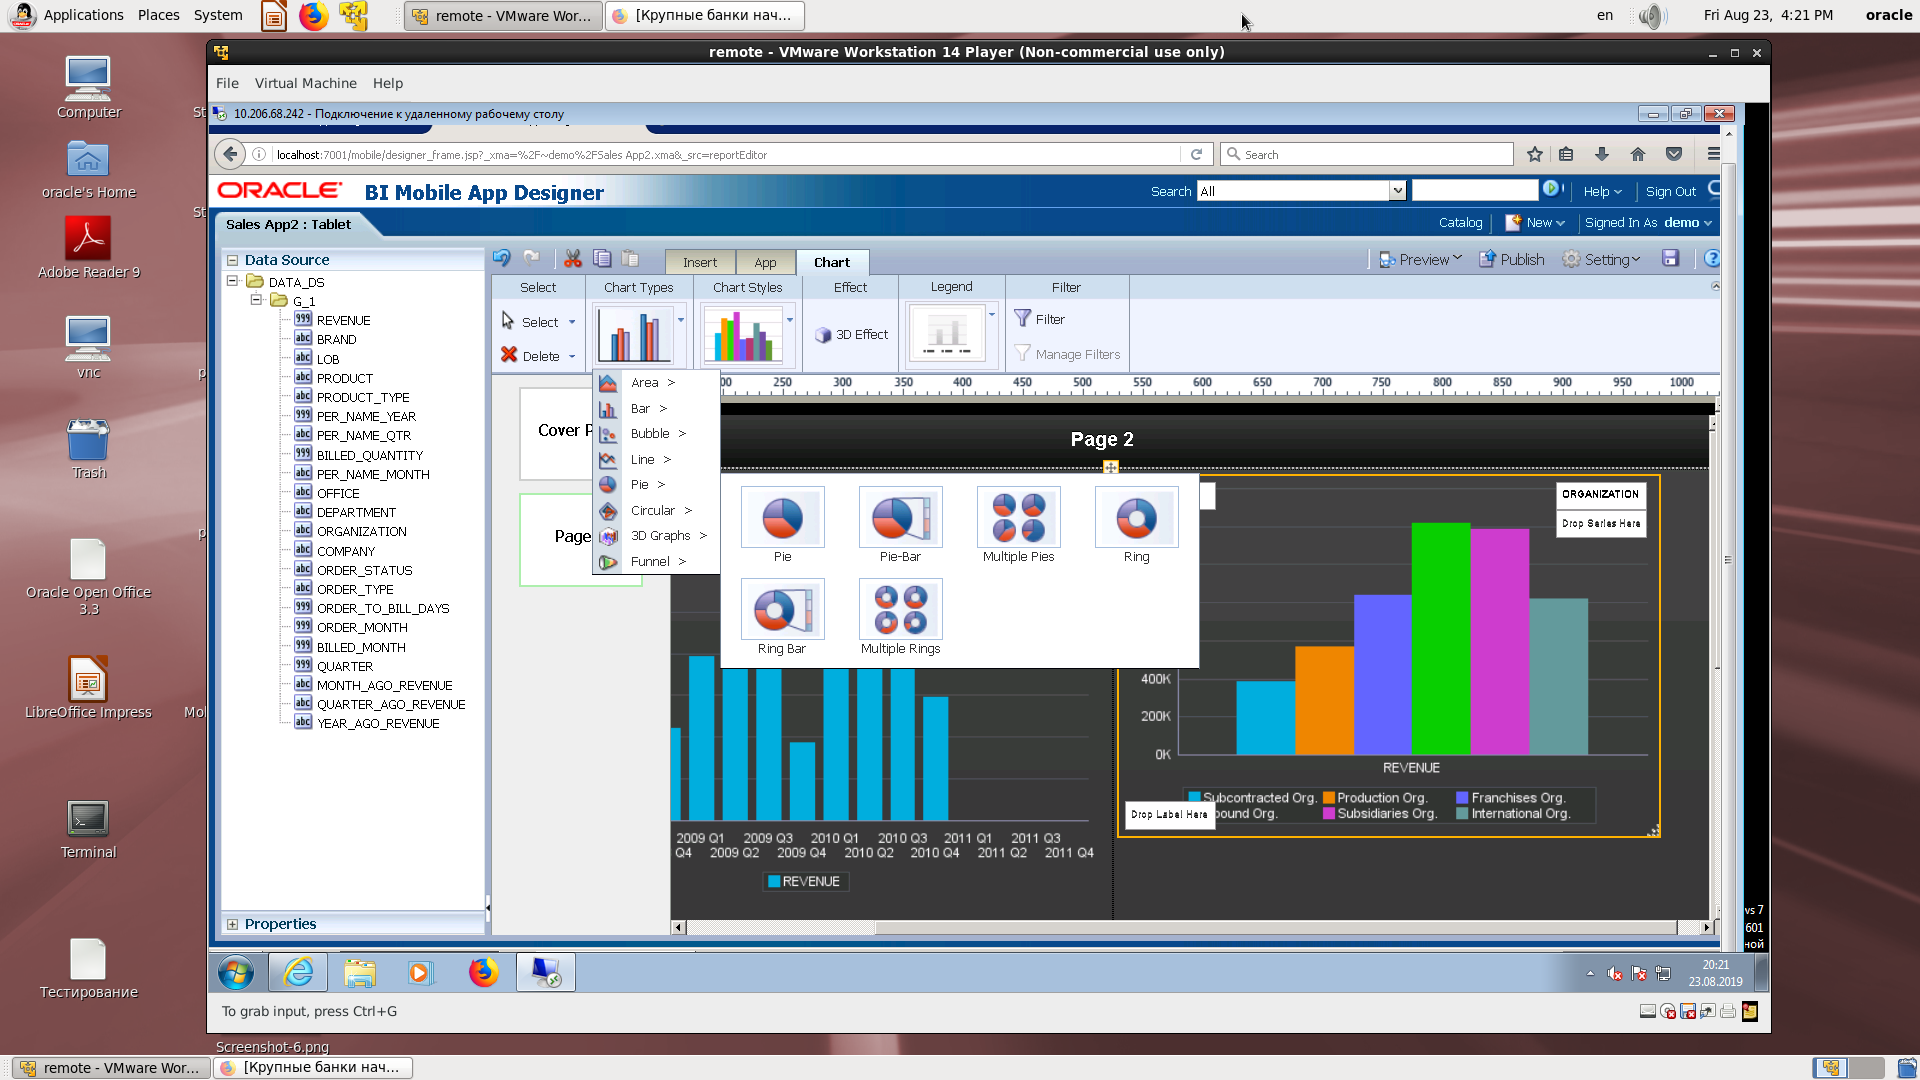
Change the type of chart.
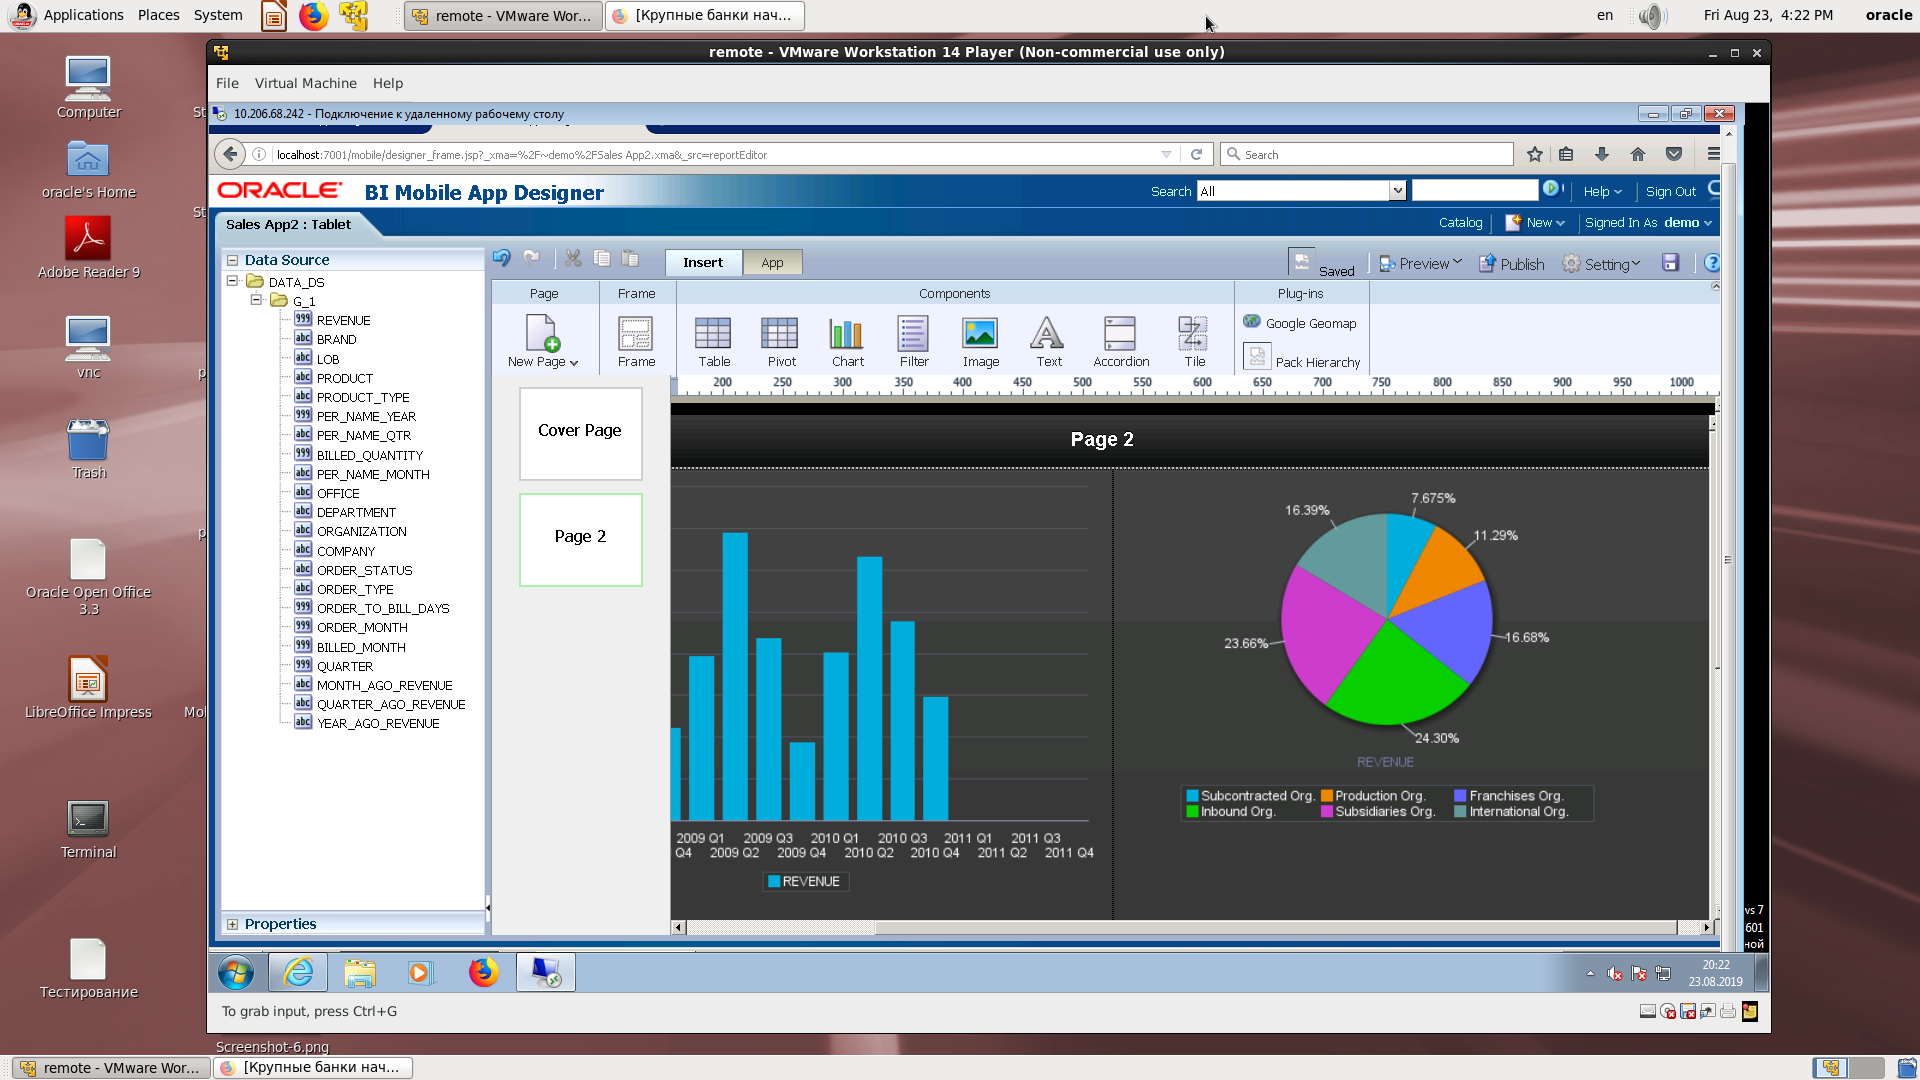
Beautiful pie chart.
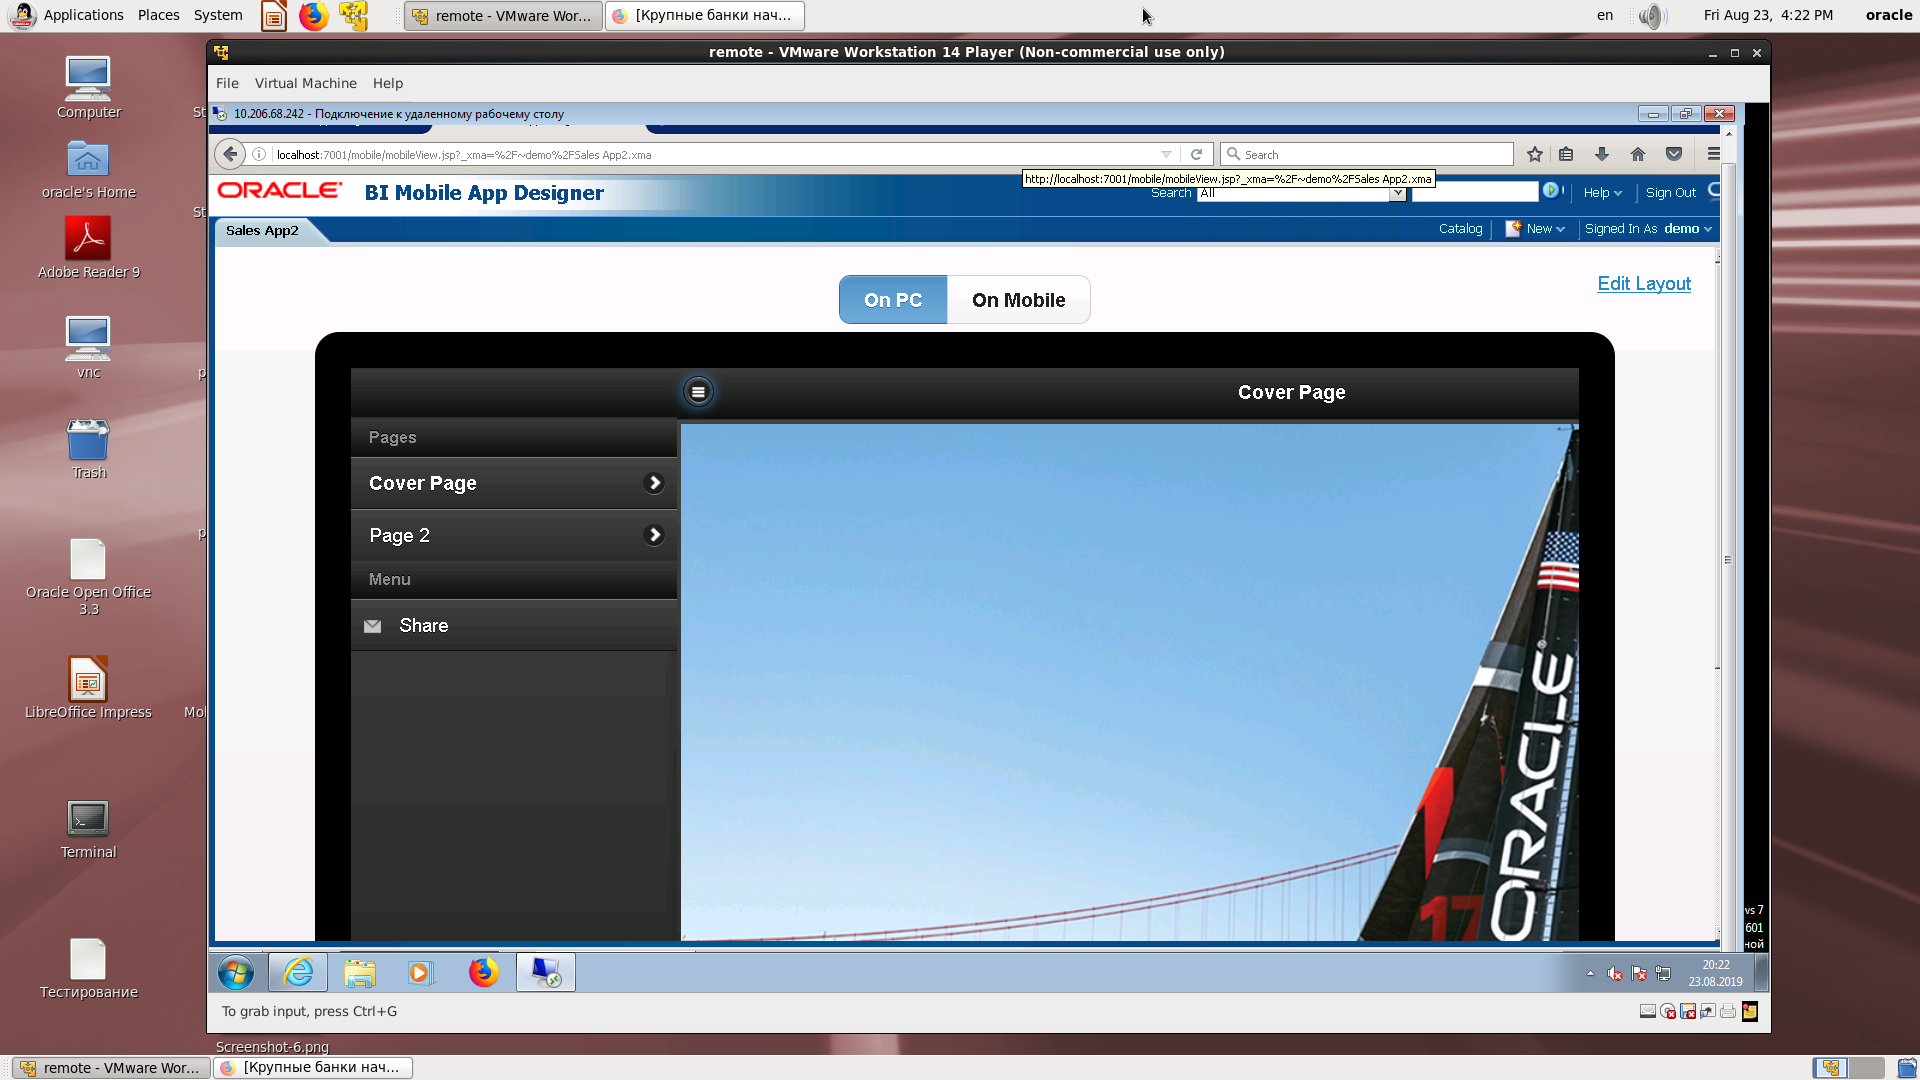
View on a mobile device with an example of practicing clicks on the menu.
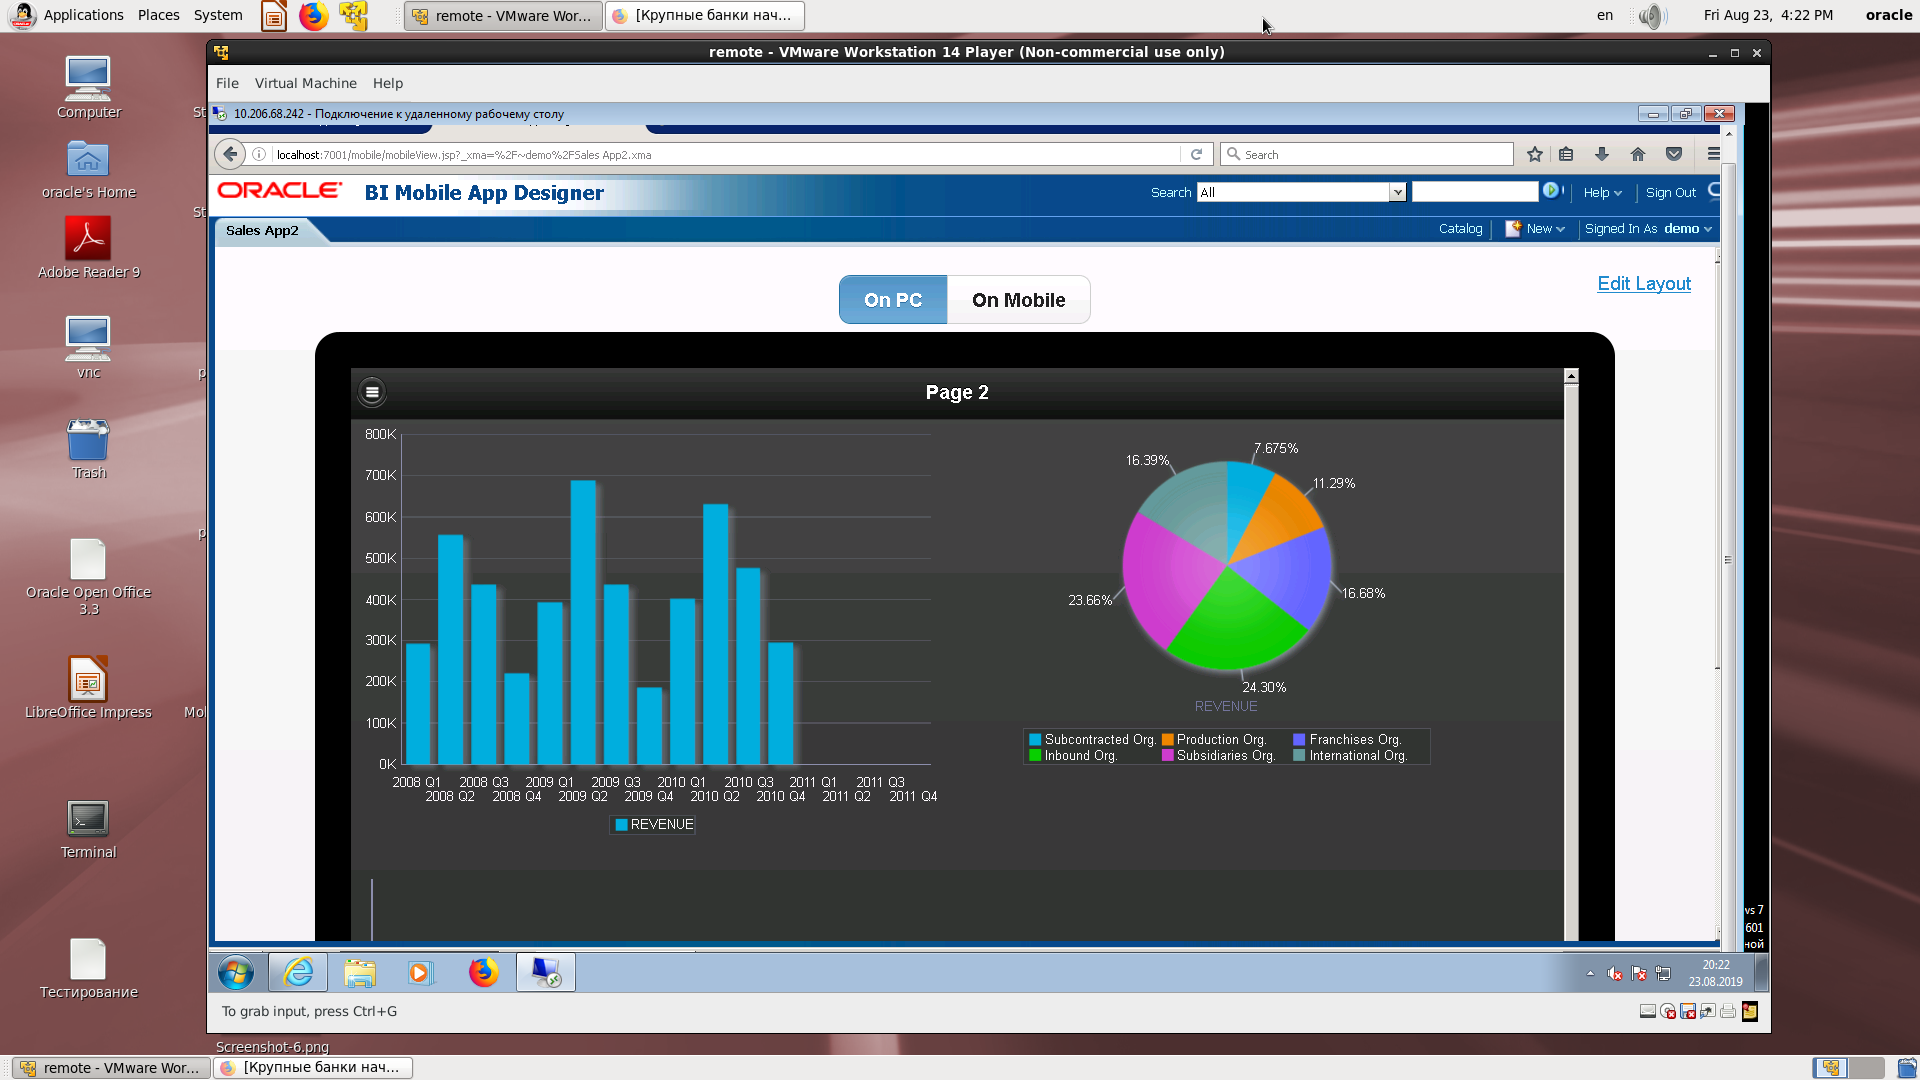
The final view of the two graphs. QR code.
As a small conclusion.
What have we not yet shown? Yes, there is a master part and it works. Yes, drill down also works.
If you have all the possible data sources for BI (which are for mobile
applications are similar to BI Publisher), then do not lose focus, create a mobile application according to our recipe. You will see how the analysts who become completely mobile in one day will be grateful to you. And in the new version, we hope that the analyzes will become even more beautiful and functional!
In our BI courses, this issue was covered in a full version in the new version, so we are putting out a practically ready recipe for how to transfer a set of existing reports to a mobile application in a few hours.
About this - a few words and a lot of pictures.
We do not repeat the general point associated with the need to install a mobile client from the App Store or Google Play , as we consider this a natural step. Each of these applications has its own history and support group, on the pages of stores there are reviews and ratings. Both the App Store and Google Play have customers for other Oracle products.
1. Take the source for BI Publisher based on the page in the Excel workbook and take the screenshots below. If there is no source, then it must be created.
The initial screen for entering the designer of the mobile application.
A regular BI directory with a mobile application.
Scheme of a source made on the basis of XLS according to BI Publisher technique (just load the file into the source creation wizard and save a sample XML data)
Suppose the source is created.
Select the type of mobile device.
Source type selection.
Source selection - BI Publisher and assignment to the desired field.
The first step in creating an application.
Saving the application with a name.
An example of the ability to insert a card.
A rich set of mapped regions.
Blank world map.
The simplest country-language report (one country, one language).
Repetition of the previous one.
An example of the possibility of choosing the type of diagrams.
Display of a computable field by the number of languages (language, number of references).
View on a mobile device.
A QR code to open on a mobile device.
Code for embedded applications.
2. We take the existing subject area on Excel and repeat.
Login to a mobile development demo.
Select the type of mobile device.
Discovery of the source.
Search in the catalog.
Assigning the desired field in the wizard.
Saving the application with the specified name in the BI directory.
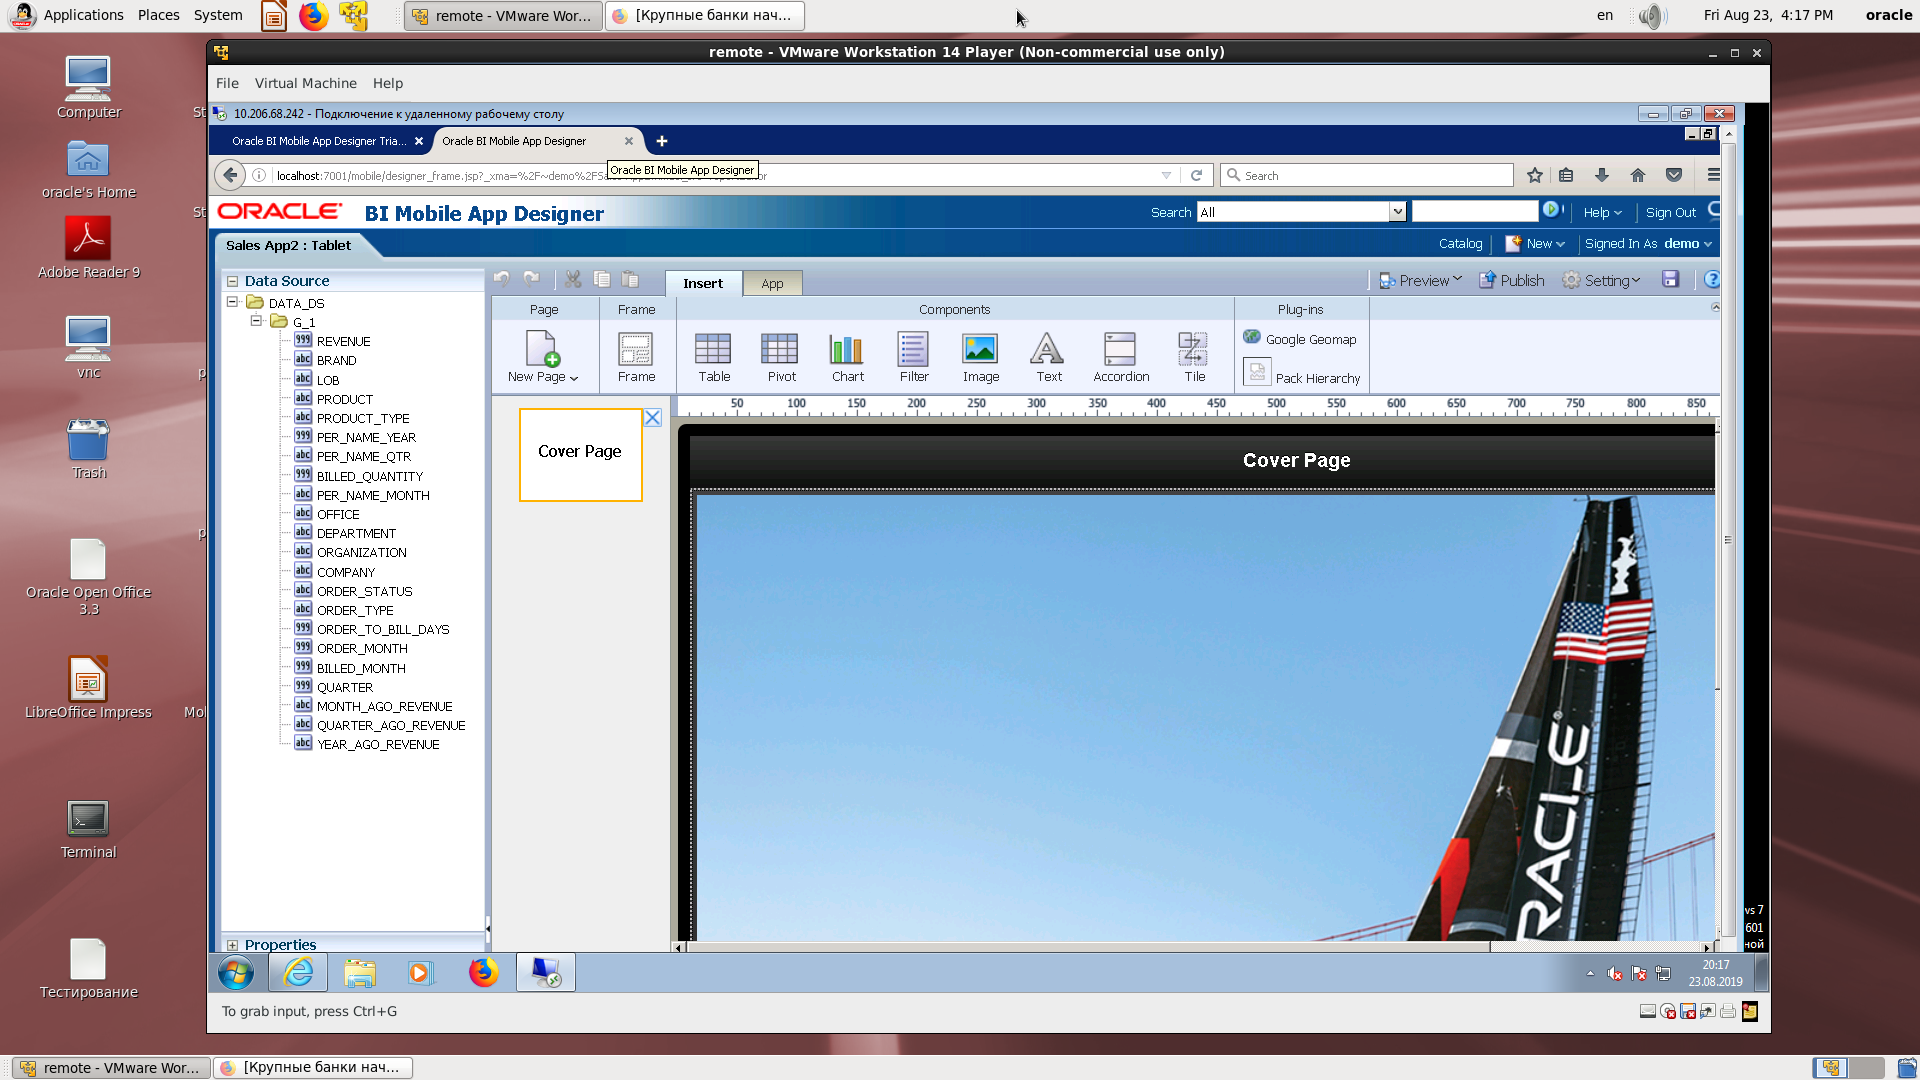
The designer of the screen form. It's incredible, as if we were in the on-line BI Publisher pegging editor.
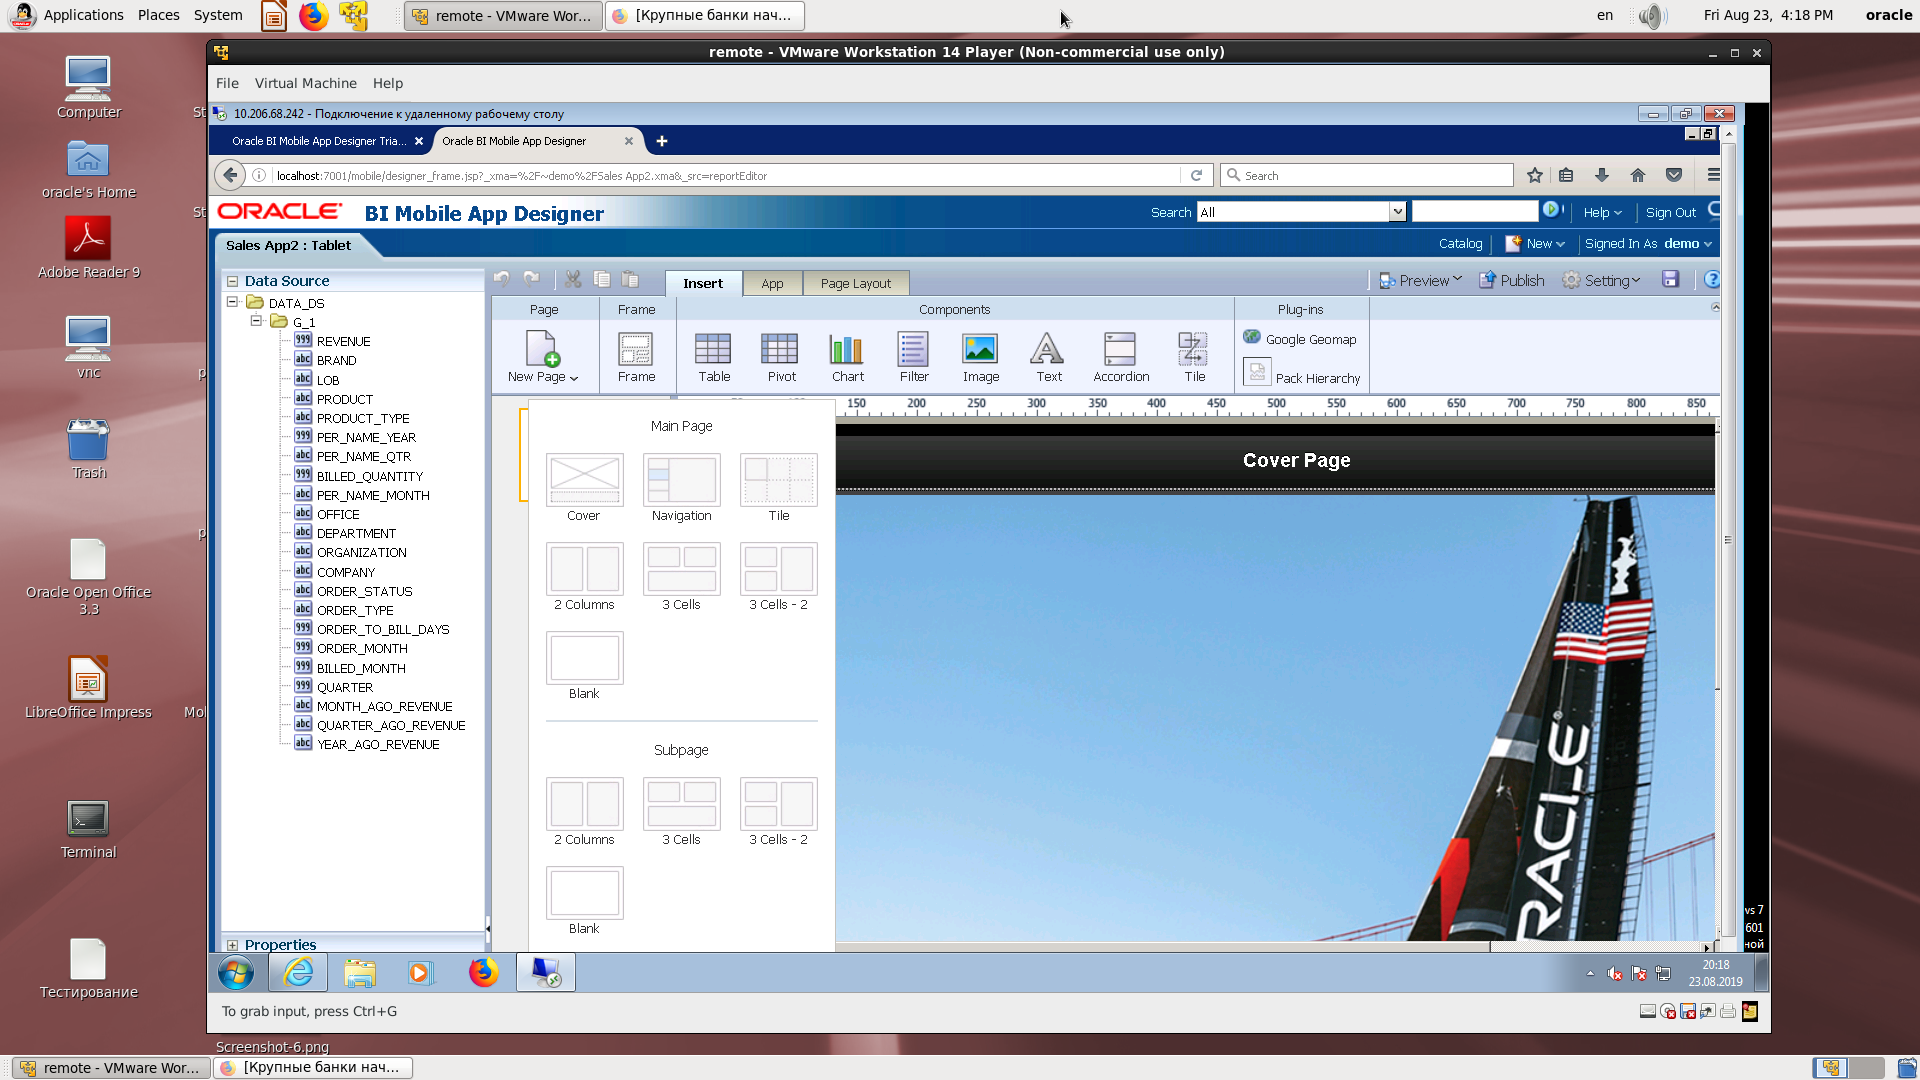
Select page structure.
Select a page break item to insert a visual item.
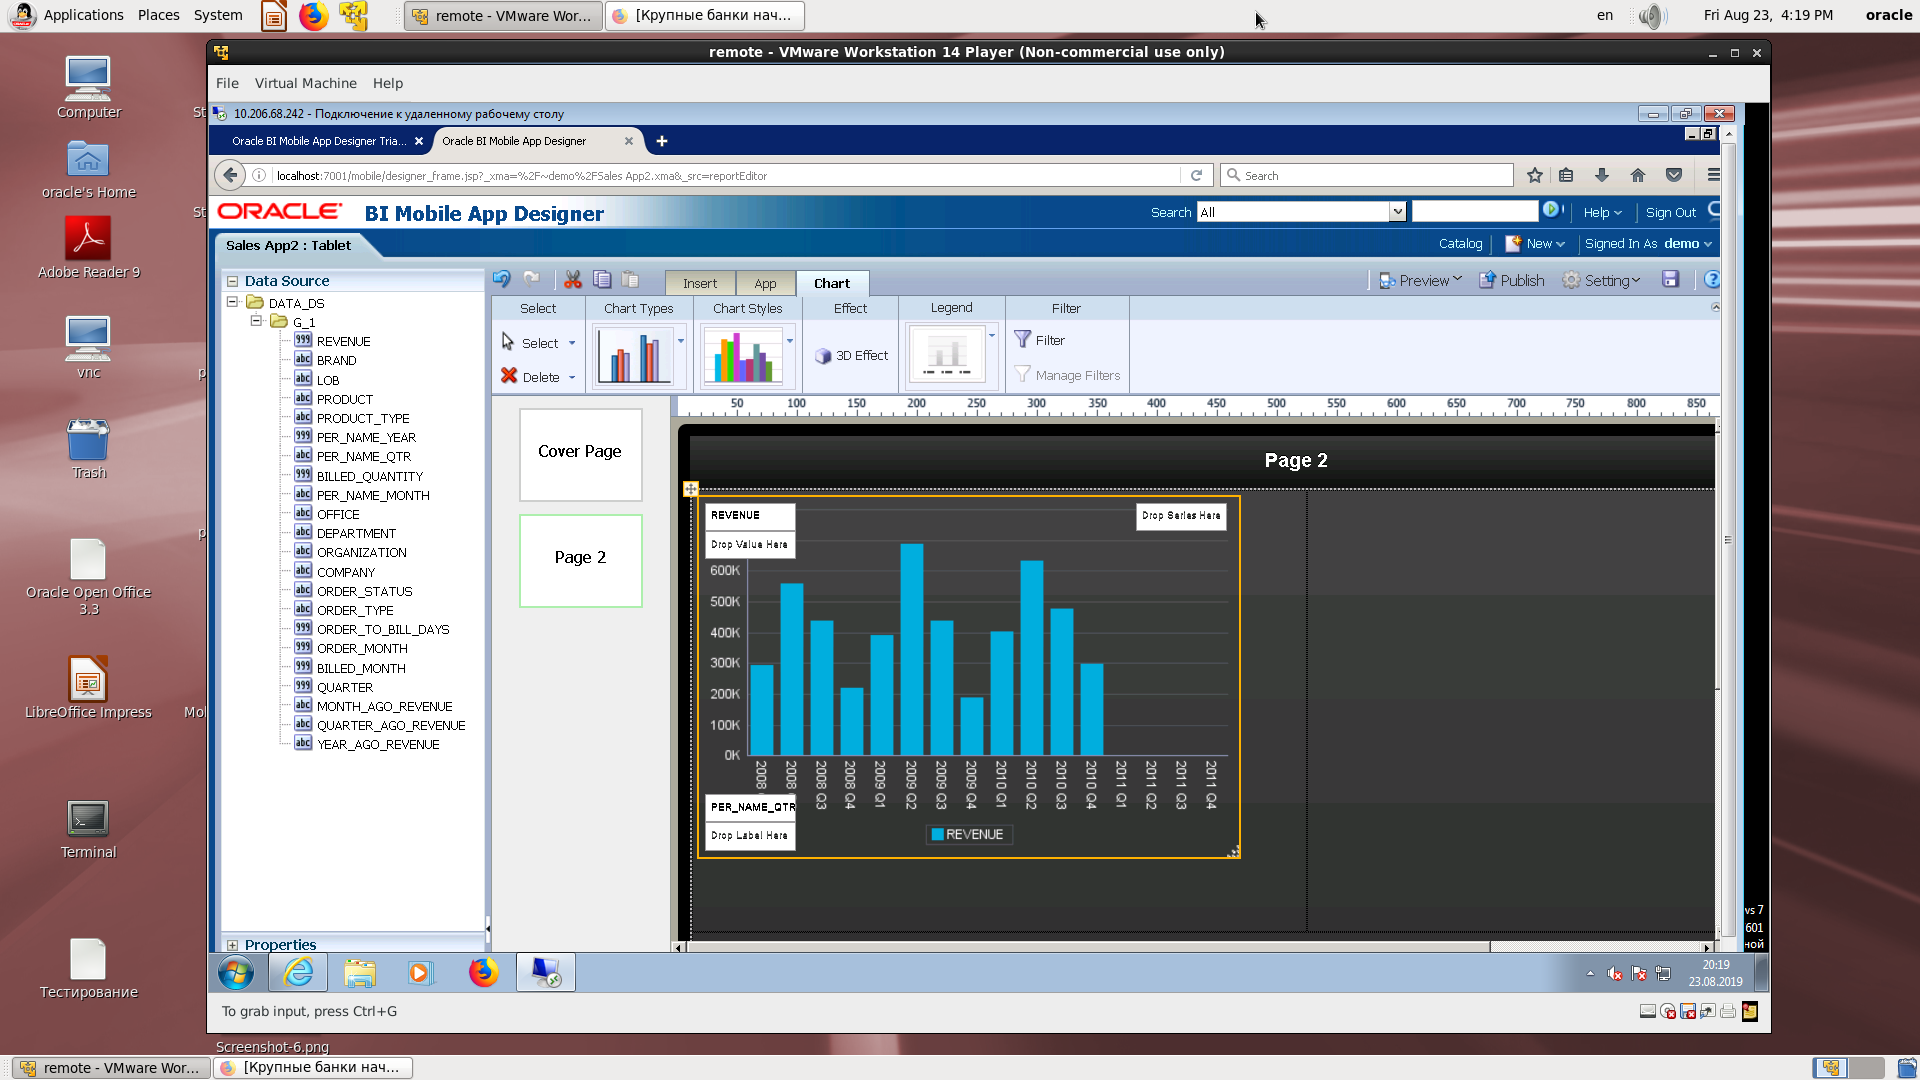
Insert a bar chart.
Assignment of display field names to physical fields.
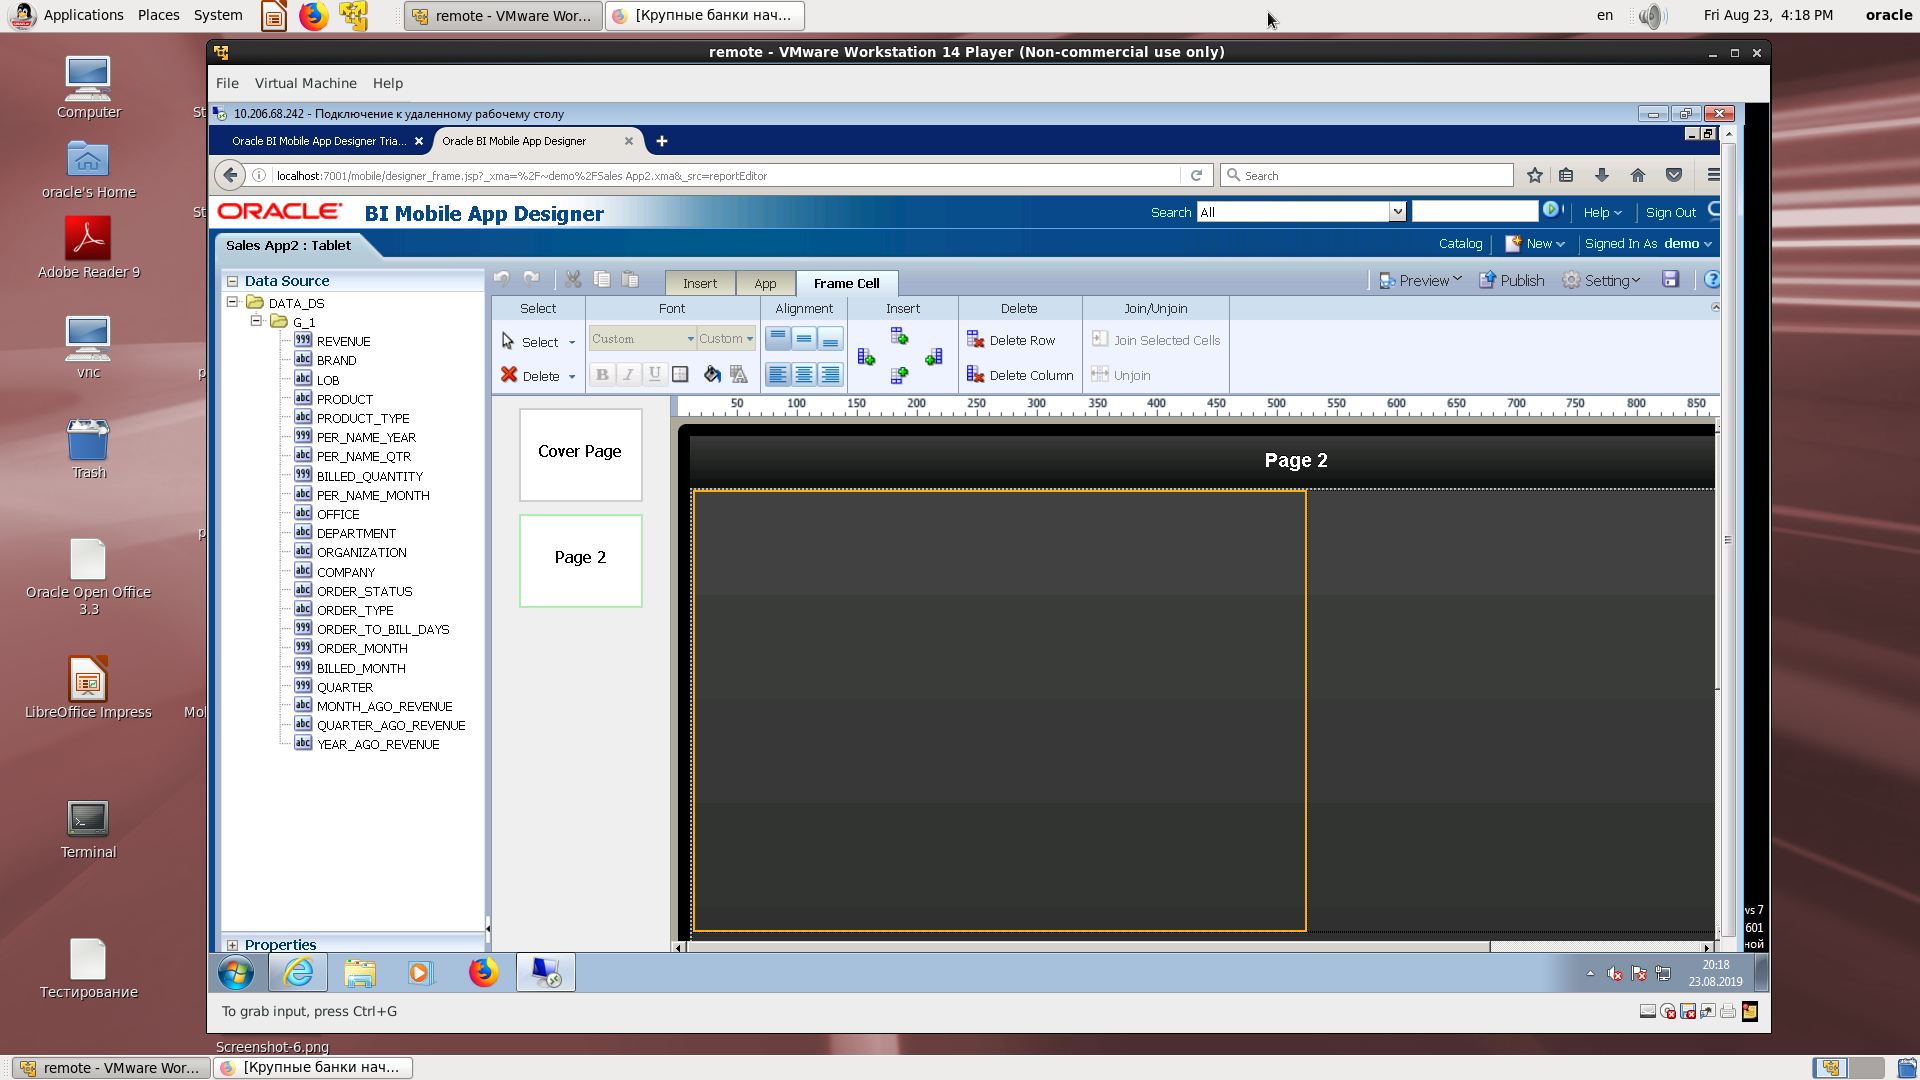
Scale the cell to fill the break.
The final look.
Choosing a place for a legend.
Insert another chart and assign fields.
Change the type of chart.
Beautiful pie chart.
View on a mobile device with an example of practicing clicks on the menu.
The final view of the two graphs. QR code.
As a small conclusion.
What have we not yet shown? Yes, there is a master part and it works. Yes, drill down also works.
If you have all the possible data sources for BI (which are for mobile
applications are similar to BI Publisher), then do not lose focus, create a mobile application according to our recipe. You will see how the analysts who become completely mobile in one day will be grateful to you. And in the new version, we hope that the analyzes will become even more beautiful and functional!
All Articles