We study the data collected by Xiaomi Mi Band for the year
Introduction
People wear fitness bracelets for various reasons, I can assume some of them:
- In order to keep fit and fulfill the goals of activity;
- Because it is a fashionable little thing;
- To experiment with yourself or to know yourself better.
I wear a fitness bracelet for reason number 3. In this article I want to talk about how you can extract data from a bracelet and try to get some dependencies.
Methods for extracting this data work for Mi Band 1 , 1S and possibly 2 (the app for 2 seems to be the same).
Data extraction
To extract data from the bracelet, first of all, you need to get the database from the SQLite phone, in which the collected metrics are stored. In the case of Android, this is done extremely simply, see the topic on the xda-developers forum , scripts for the current database :
- We connect an Android phone with USB debugging enabled to a computer;
- We make a backup of the application:
adb backup -f mi.ab -noapk -noshared com.xiaomi.hm.health
; - Create
dd if=mi.ab bs=1 skip=24 | python -c "import zlib,sys;sys.stdout.write(zlib.decompress(sys.stdin.read()))" > mi.tar
dd if=mi.ab bs=1 skip=24 | python -c "import zlib,sys;sys.stdout.write(zlib.decompress(sys.stdin.read()))" > mi.tar
; - Unpack the archive from the database:
tar xvf mi.tar apps/com.xiaomi.hm.health/db/ 2>&1 | tee -a log
tar xvf mi.tar apps/com.xiaomi.hm.health/db/ 2>&1 | tee -a log
; - Copy the database:
cp -f apps/com.xiaomi.hm.health/db/origin_db* ./db/
.
As a result, we get an SQLite database with the file name db/origin_db_[0-9]+$
, which stores the Mi Band metrics.
Data loading and analysis
To study the data, in my opinion, it is convenient to use IPython notebook: Xiaomi_Mifit_miband_data.ipynb
Metrics are stored in the DATE_DATA table:
df = pd.read_sql_query("SELECT * from DATE_DATA", con)
Columns in the table that are of interest:
| speaker | description |
|---|---|
| DATE | date |
| SUMMARY | JSON with processed data for the day |
| DATA | raw per-minute data per sleep [activity1], activity2, activity3 |
| DATA_HR | raw minute heart rate data |
Daily Aggregated Data
Aggregated data is stored as JSON:
{"slp":{"usrEd":-1440,"lt":457,"st":1464376080,"wk":15,"dp":30,"usrSt":-1440,"ed":1464406200},"v":5,"goal":8000,"stp":{"rn":2,"cal":257,"runDist":256,"wk":69,"ttl":5244,"runCal":13,"dis":3817}}
The data is divided into 2 parts: sleep ( slp ) and activity ( stp ). For sleep, the start and end time is stored - st, ed , as well as the time of deep and light sleep in minutes - lt, dp . The waking time between the beginning and the end of sleep is also stored - wk . For activity, the total number of "steps" ttl is stored - the sum of the primary sensor readings for the day and other derived quantities func(ttl, , )
.
Raw activity and heart rate data
Raw activity data is stored every minute (per day 1440), and represents 3 values per minute. The first value is a dream and a value from 0 to 127 (but in my case a maximum of 126), the second and third are activity with a value from 0 to 255 (I have a maximum of activity2 - 189, activity3 - 240).
The pulse is stored every minute and ranges from 0 to 255.
How raw data becomes aggregated per day
The simplest aggregate is the number of steps per day - the sum of activity3 values per day. It is more difficult to sleep: I have not learned how to turn raw sleep data into aggregated data. The idea was expressed in the forums that the value of activity1 == 4 is deep sleep, and 5 is light, but it is as simple as with steps to establish a relationship between aggregated data and raw data.
Data analysis
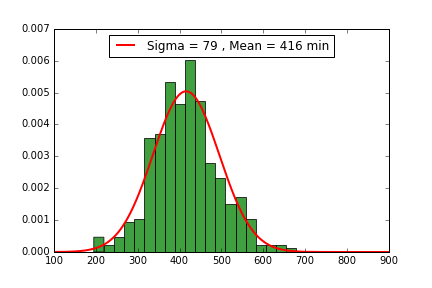
Firstly, how much I slept during the year. This value turned out to be ~ (7 + - 1) hours. Everything seems to be ok with this.
Another obvious thing - I get enough sleep on weekends:
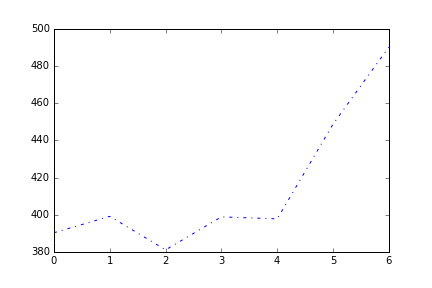
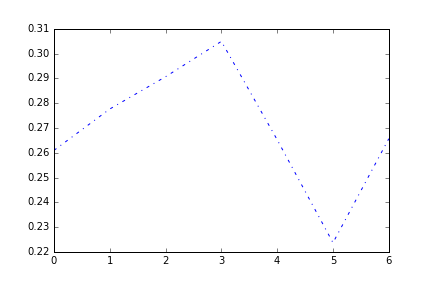
And if you call the relationship of deep sleep to light quality, it turns out that the best quality of sleep I have on Thursday, and at the same time deep sleep is 23% of the total sleep time. And on Friday - the worst quality of sleep, I'm afraid to even guess why.
The maximum number of “steps” I make on Friday and Saturday:
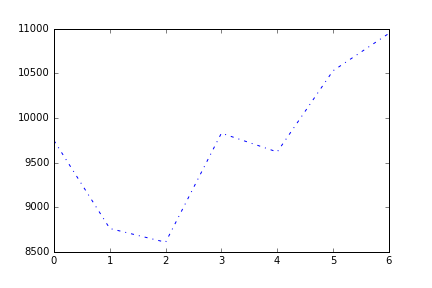
At the same time, my environment is the day when I sleep little and walk little, there are no obvious explanations from the category "I work from home", so this is something new for me.
I hope that someone from the owners of the popular Mi band bracelets also wants to study themselves and talk about their features.
All Articles