Using the PVS-Studio static analyzer during development for embedded systems in C and C ++
 In this article, you will learn how to run an embedded project check and how to work with the analyzer report. PVS-Studio analyzer supports a number of compilers for embedded systems. In the current version, it is possible to check projects when building with one of the following compilers for Window, Linux, and macOS:
- IAR Embedded Workbench
- Keil Embedded Development Tools for Arm
- TI ARM Code Generation Tools
- GNU Embedded Toolchain
Installation
The installation procedure depends on the operating system under which you are developing. Under Linux, you can install the analyzer from the repository or from the installation package.
Example for Debian based systems:
wget -q -O - https://files.viva64.com/etc/pubkey.txt | sudo apt-key add - sudo wget -O /etc/apt/sources.list.d/viva64.list \ https://files.viva64.com/etc/viva64.list sudo apt update sudo apt install pvs-studio
or
sudo gdebi pvs-studio-VERSION.deb
For macOS, installation and updating can be done from Homebrew :
brew install viva64/pvs-studio/pvs-studio brew upgrade pvs-studio
The second option is to install the package from dmg or manually unpack it from the archive.
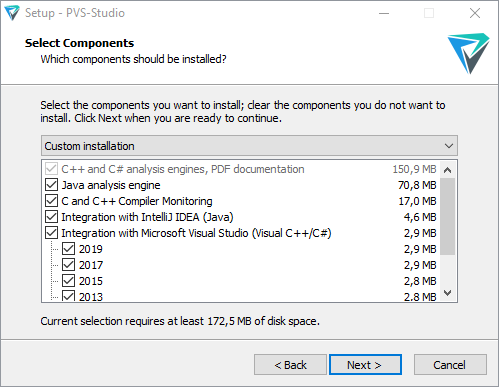
Under Windows, installation is performed using the installer:
You can download installation packages for all supported systems and, if necessary, request a trial key on the page " Download and try PVS-Studio ".
After installation, enter the license key. You can find information on how to do this on different platforms, on the documentation page " How to enter the PVS-Studio license, and what to do next ."
Project Verification
Project verification for embedded systems can be done in the same ways as in the case of development for Windows, Linux and macOS.
Launch options for Linux are discussed in the article " Introducing the PVS-Studio static analyzer when developing C ++ programs in Linux ." Keep in mind that since cross-compilation is used to build under embedded, and the compiler name may be non-standard, you may need to specify it when analyzing the project. To do this, use the –compiler or –c command line option :
pvs-studio-analyzer analyze -c MyCompiler
This parameter should be used when the analyzer cannot determine the type of compiler used, that is, when the error "No compilation units found" is issued.
When cross-compiling, since the target platform is different from the one under which the assembly takes place, together with the compiler you may need to specify the target platform using the --platform parameter, as well as the type of the preprocessor ( --preprocessor ).
Supported platforms: win32, x64, linux32, linux64, macos, arm.
Supported preprocessors: gcc, clang, keil.
By default, Linux selects the linux64 platform and the gcc preprocessor.
If you use Windows, you can check the project in compilation monitoring mode. To do this, run the " C and C ++ Compiler Monitoring UI " utility, which is installed with the analyzer. To start monitoring, go to the Tools menu and click Analyze Your Files ... A dialog opens:

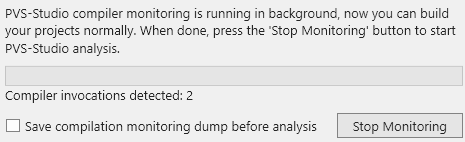
Click on the " Start Monitoring " button and run the build. After its completion, click on the " Stop Monitoring " button in the dialog box in the lower right corner of the screen:
The test result can be viewed in the main window of the " C and C ++ Compiler Monitoring UI " utility.
You can also run analysis from the command line. To do this, use the CLMonitor utility. You can start monitoring with the command:
CLMonitor.exe monitor
After the assembly is completed, you should run the utility in analysis mode:
CLMonitor.exe analyze -l "<path>\out.plog"
The analyzer will check the project and save the results to the file specified in the -l parameter.
See also the documentation section " Compilation Monitoring System in PVS-Studio ".
Work with reports
To view the report under Linux, you need to convert the file obtained as a result of the analyzer to one of the supported formats using the plog-converter utility. You can get the report in HTML format with the ability to view the source code with the following command:
plog-converter -a GA:1,2 -t fullhtml /path/project.log -o /path/report_dir
The conversion of reports is described in more detail in the article " Acquaintance with the PVS-Studio static analyzer when developing C ++ programs in the Linux environment ".
Under Windows, there is also a PlogConverter utility that allows you to convert report files in a similar way:
PlogConverter.exe <path>\out.plog --renderTypes= FullHtml --analyzer=GA:1,2
or
PlogConverter.exe D:\Projct\out.plog -t FullHtml -a GA:1,2
Also, a report in the plog format can be viewed using the utility " C and C ++ Compiler Monitoring UI " through the menu File-> Open PVS-Studio Log ...
Example:

If necessary, from this utility you can export the report to one of the supported formats through the File menu.
MISRA standard
PVS-Studio classifies alerts according to CWE and SEI CERT , which is suitable for static security testing ( SAST ) of ordinary applications. However, embedded systems have slightly different security requirements that are covered by the specially developed MISRA standard. The current version of the analyzer supports part of the rules from MISRA C and MISRA C ++, the list of diagnostics can be viewed here , and it is constantly expanding.
Using MISRA rules when checking projects that are not intended for embedded is often unjustified. This is due to the specifics of the standard. In most cases, if the code was not originally written with the expectation of MISRA compliance, there will be many false and useless warnings during the check. Therefore, MISRA rules are disabled by default.
To enable MISRA analysis under Linux, you need to run the analysis with the -a switch and pass a numerical parameter that sets the required mode. This parameter is a combination of bit fields:
-a [MODE], --analysis-mode [MODE] MODE defines the type of warnings: 1 - 64-bit errors; 2 - reserved; 4 - General Analysis; 8 - Micro-optimizations; 16 - Customers Specific Requests; 32 - MISRA. Modes can be combined by adding the values Default: 4
Launch example (GA and MISRA diagnostics included):
pvs-studio-analyzer analyze -a 36 -o /path/report.log
When using plog-converter , you must also indicate that the MISRA diagnostics should be included in the report:
plog-converter -a MISRA:1,2,3 -m misra ....
Under Windows, you can use the " C and C ++ Compiler Monitoring UI " utility settings dialog:

More details about MISRA support are described in the article " PVS-Studio: Support for MISRA C and MISRA C ++ Encoding Standards ".
Conclusion
In this article, we reviewed the capabilities of the PVS-Studio analyzer for testing projects focused on embedded systems. If you need more detailed information on how to use the analyzer, I recommend reading the following articles:
- Acquaintance with the PVS-Studio static code analyzer ;
- Compilation monitoring system in PVS-Studio ;
- How to run PVS-Studio on Linux and macOS ;
- PVS-Studio SAST (Static Application Security Testing, SAST) ;
- Suppression of false warnings .

If you want to share this article with an English-speaking audience, then please use the link to the translation: Yuri Minaev. Using PVS-Studio Static Analyzer in C and C ++ Development for Embedded Systems
All Articles