Development of dynamic tree diagrams using SVG and Vue.js
The material, the translation of which we publish today, is devoted to the process of developing a visualization system for dynamic tree diagrams. For drawing cubic Bezier curves, SVG technology (Scalable Vector Graphics, scalable vector graphics) is used here. Reactive work with data is organized by Vue.js.
Here is a demo version of the system with which you can experiment.

Interactive Tree Chart
The combination of the powerful capabilities of SVG and the Vue.js framework allowed us to create a system for building diagrams that are data-based, interactive and customizable.
A diagram is a collection of cubic Bezier curves starting at one point. The curves end at different points equidistant from each other. Their final position depends on the data entered by the user. As a result, the chart is able to react reactively to data changes.
First, we will talk about how Bezier cubic curves are formed, then we will figure out how to represent them in the coordinate system of the
element, and talk about creating masks for images.
The author of the material says that she prepared many illustrations for him, trying to make him understandable and interesting. The purpose of the material is to help everyone to get the knowledge and skills necessary to develop their own charting systems.
The curves that are used in this project are called Cubic Bezier Curve. The following figure shows the key elements of these curves.

Key Elements of a Bezier Cubic Curve
The curve is described by four pairs of coordinates. The first pair
is the starting anchor point of the curve. The last pair of coordinates
is the final reference point.
Between these points, you can see the so-called control points. This is the point
and the point
.
The location of the control points with respect to the control points determines the shape of the curve. If the curve were set only by the start and end points, the coordinates
and
, then this curve would look like a straight segment located diagonally.
Now we will use the coordinates of the four points described above to construct the curve using the SVG
element. Here is the syntax used in the
element to construct cubic Bezier curves:
The letter
, which can be seen in the code, is an abbreviation for Cubic Bezier Curve. Lower case letter (
) means the use of relative values, uppercase (
) means the use of absolute values. I use absolute values to build the diagram, this is indicated by the capital letter used in the example.
Symmetry is a key aspect of this project. To build a symmetrical diagram, I used only one variable, receiving on its basis such values as the height, width or coordinates of the center of a certain object.
Let's name this variable
. Since the chart is oriented horizontally - the
variable can be considered as the entire horizontal space that is available to the chart.
Assign this variable a realistic value. We will use this value to calculate the coordinates of the chart elements.
Before we can find the coordinates needed to build the diagram, we need to deal with the SVG coordinate system.
The attribute of the
very important in our project. The fact is that it describes the user coordinate system of the SVG image. Simply put, the
determines the position and dimensions of the space in which the SVG image visible on the screen will be created.
The
attribute consists of four numbers that specify the parameters of the coordinate system and the following in this order:
,
,
,
. The
and
parameters set the origin of the user coordinate system, the
and
parameters set the width and height of the displayed image. Here's what the
attribute might look like:
The
variable that we described above will be used to control the
and
parameters of this coordinate system.
Later, in the section on Vue.js, we will bind the
to a computed property to specify the
and
values. Moreover, in our project, the properties
and
will always be set to 0.
Note that we do not use the
and
attributes of the
element itself. We will set them to
and
using CSS. This will allow us to create an SVG image that flexibly adjusts to the page size.
Now that the user coordinate system is ready to draw a chart, let's talk about using the
variable to calculate the coordinates of the chart elements.

Chart concept
The circle in which the drawing is displayed is part of the diagram. That is why it is important to include it in the calculations from the very beginning. Let us, based on the above illustration, find out the coordinates for the circle and for one experimental curve.
The height of the chart is divided into two parts. These are
(20% of
) and
(the remaining 80% of
). The total width of the chart is divided into 2 parts - the length of each of them is 50% of the
.
This makes the conclusion of the circle parameters not requiring special explanations (here the
and
indicators are used). The
parameter is set to half the value of
. Thanks to this, the circle fits perfectly into the available space.
Now let's take a look at the coordinates of the curves.
We rewrite, in general terms, the code for the
element, taking into account the formulas that we just derived. The percentages used above are presented here by dividing them by 100.
Please note that at first glance, the use of percentages in our formulas may seem optional, based only on my own opinion. However, these values are not applied on a whim, but because their use helps to achieve symmetry and the correct proportions of the diagram. After you feel their role in charting, you can try your own percentage values and examine the results obtained by applying them.
Now let's talk about how we will look for the coordinates
and
. They allow you to dynamically create many curves based on the
elements in the corresponding array.
Dividing the available horizontal space of the chart into equal parts is based on the number of elements in the array. As a result, each part receives the same space along the x axis.
The formula that we derive should subsequently work with any number of elements. But here we will experiment with an array containing 5 elements:
. Visualization of such an array means that it is necessary to draw 5 curves.
First, I divided
by the number of elements, that is, by the length of the array. I called this variable
. It represents the distance between two elements.
Then I walked around the array and multiplied the index of each of its elements (
) by
. For simplicity, I simply call
both the
parameter and the
parameter.
If you apply the obtained values when building the diagram, that is, use the
value calculated above for both
and
, it will look a little strange.

The diagram is asymmetrical
As you can see, the elements are located in the area where they should be, but the diagram turned out to be asymmetric. It seems that in its left part there are more elements than in the right.
Now I need to make the
value lie in the center of the corresponding segments, the length of which is set using the
variable.
In order to bring the diagram to the form I need, I simply added to
half the value of
.
As a result, I found the center of the
segment and placed the
coordinate in it. In addition, I brought to the form we need the
coordinate for curve No. 2.
Symmetric chart
Adding half the
value to the
and
coordinates made the formula for calculating these coordinates suitable for visualizing arrays containing an even and odd number of elements.
We need a certain image to be displayed at the top of the diagram, within the circle. To solve this problem, I created a clipping mask containing a circle.
Then, using the
tag of the
element to display the image, I linked the image to the
element created above using the
attribute of the
element.
Since we are trying to fit a square image into a round “window”, I adjusted the position of the element by subtracting the
parameter from the corresponding parameters. As a result, the image is visible through a mask made in the form of a circle.
Let's collect all that we talked about in one drawing. This will help us see the overall picture of the progress of work.

Data used in calculating chart parameters
At this point, we figured out the cubic Bezier curves and performed the calculations necessary to form the diagram. As a result, we can now create static SVG diagrams. If we combine the capabilities of SVG and Vue.js, we can create data driven charts. Static charts will become dynamic.
In this section, we revise the SVG diagram, presenting it as a set of Vue components. We will also attach the SVG attributes to the calculated properties and make the chart respond to data changes.
In addition, at the end of the project, we will create a component that represents a configuration panel. This component will be used to enter data that will be transmitted to the chart.
Let's start by adjusting the coordinate system. Without doing this, we will not be able to draw SVG images. The computed
property will return what we need using the
variable. There will be four values separated by spaces. All this will become the value of the
attribute of the
element.
In SVG, the name of the
attribute
already written using camel style.
Therefore, in order to correctly bind this attribute to the calculated property, I wrote down the attribute name in the kebab style and put the
modifier after it. With this approach, it is possible to "trick" HTML and correctly implement attribute binding.
Now when you change the
chart is reconfigured independently. We do not need to manually change the layout.
Since most of the values needed to construct the curves are calculated on the basis of a single variable (
), I used the calculated properties to find all the fixed coordinates. What we call “fixed coordinates” here is calculated on the basis of
, and after that it does not change and does not depend on how many curves the diagram will include.
If you change the
- "fixed coordinates" will be recounted. After that, they will not change until the next
change. Given the above, here are five values we need to draw Bezier curves:
Now we have only two unknown values left -
and
. The formula for calculating them we have already derived:
To find specific values, we need to substitute the indices of the array elements in this formula.
Now let's ask ourselves if the computed property is right for us to find
. Briefly answer this question, then - no, it will not do.
The calculated property cannot be passed parameters. The fact is that this is a property, not a function. In addition, the need to use a parameter to calculate something means that there is no tangible advantage of using calculated properties in terms of caching.
Please note that there is an exception regarding the above principle. It's about Vuex. If you use Vuex getters that return functions, you can pass parameters to them.
In this case, we do not use Vuex. But even in this situation, we have a couple of ways to solve this problem.
You can declare a function to which
passed as an argument, and which returns the result we need. This approach looks cleaner if we are going to use the value returned by a similar function in several places in the template.
The
method will perform calculations every time it is called. This method takes as argument the index of the element -
.
Here is an example on CodePen that uses this solution.
Screen for the first application variant
This option is better than the first. We can extract the small SVG markup needed to build the curve into a separate small child component and pass
to it as one of the properties.
With this approach, you can even use the computed property to find
and
.
This option gives us the opportunity to better organize the code. For example, we can create another child component for the mask:

Configuration panel
You have probably already seen the configuration panel, called up by the button located in the upper left corner of the screen of the above example . This panel makes it easy to add elements to the array and remove them from it. Following the ideas discussed in the "Option # 2" section, I created a child component for the configuration panel. Thanks to this, the top-level component is clean and well readable. As a result, our small, nice tree of Vue components looks something like the one below.

Project Component Tree
Want to take a look at the code that implements this version of the project? If so, take a look here .

Screen for the second application variant
Here is the GitHub repository of the project (“Option # 2” is implemented here). I believe it will be useful for you to look at it before you move on to the next section.
Try to create the same diagram that we described here, but make it oriented vertically. Take advantage of the ideas outlined in this article.
If you think that this is an easy task, that to build such a diagram it is enough to swap the
and
coordinates, then you are right. Considering that the project considered here was not created as universal, after changing the coordinates where you need it, you will also need to edit the code by renaming some variables and methods.
Thanks to Vue.js, our simple chart can be equipped with additional features. For example, the following:
Try this homework. And if you have any problems - below will be given a link to its solution.
The
element is one of the powerful features of SVG. This element allows you to create various images with high accuracy. Here we figured out how the Bezier curves are structured, and how to put them into practice to create your own diagrams.
, , JavaScript-. Vue.js . , , , , DOM. , — .
, , , , , Vue.js SVG. — , Vue.js. — .
, - , , , — .
Dear readers! ?

Here is a demo version of the system with which you can experiment.
Interactive Tree Chart
The combination of the powerful capabilities of SVG and the Vue.js framework allowed us to create a system for building diagrams that are data-based, interactive and customizable.
A diagram is a collection of cubic Bezier curves starting at one point. The curves end at different points equidistant from each other. Their final position depends on the data entered by the user. As a result, the chart is able to react reactively to data changes.
First, we will talk about how Bezier cubic curves are formed, then we will figure out how to represent them in the coordinate system of the
<svg>
element, and talk about creating masks for images.
The author of the material says that she prepared many illustrations for him, trying to make him understandable and interesting. The purpose of the material is to help everyone to get the knowledge and skills necessary to develop their own charting systems.
Svg
▍ How are cubic Bezier curves formed?
The curves that are used in this project are called Cubic Bezier Curve. The following figure shows the key elements of these curves.
Key Elements of a Bezier Cubic Curve
The curve is described by four pairs of coordinates. The first pair
(x0, y0)
is the starting anchor point of the curve. The last pair of coordinates
(x3, y3)
is the final reference point.
Between these points, you can see the so-called control points. This is the point
(x1, y1)
and the point
(x2, y2)
.
The location of the control points with respect to the control points determines the shape of the curve. If the curve were set only by the start and end points, the coordinates
(x0, y0)
and
(x3, y3)
, then this curve would look like a straight segment located diagonally.
Now we will use the coordinates of the four points described above to construct the curve using the SVG
<path>
element. Here is the syntax used in the
<path>
element to construct cubic Bezier curves:
<path D="M x0,y0 C x1,y1 x2,y2 x3,y3" />
The letter
, which can be seen in the code, is an abbreviation for Cubic Bezier Curve. Lower case letter (
c
) means the use of relative values, uppercase (
C
) means the use of absolute values. I use absolute values to build the diagram, this is indicated by the capital letter used in the example.
▍Creating a symmetric diagram
Symmetry is a key aspect of this project. To build a symmetrical diagram, I used only one variable, receiving on its basis such values as the height, width or coordinates of the center of a certain object.
Let's name this variable
size
. Since the chart is oriented horizontally - the
size
variable can be considered as the entire horizontal space that is available to the chart.
Assign this variable a realistic value. We will use this value to calculate the coordinates of the chart elements.
size = 1000
Finding the coordinates of chart elements
Before we can find the coordinates needed to build the diagram, we need to deal with the SVG coordinate system.
▍Coordinate system and viewBox
The attribute of the
<svg> viewBox
very important in our project. The fact is that it describes the user coordinate system of the SVG image. Simply put, the
viewBox
determines the position and dimensions of the space in which the SVG image visible on the screen will be created.
The
viewBox
attribute consists of four numbers that specify the parameters of the coordinate system and the following in this order:
min-x
,
min-y
,
width
,
height
. The
min-x
and
min-y
parameters set the origin of the user coordinate system, the
width
and
height
parameters set the width and height of the displayed image. Here's what the
viewBox
attribute might look like:
<svg viewBox="min-x min-y width height">...</svg>
The
size
variable that we described above will be used to control the
width
and
height
parameters of this coordinate system.
Later, in the section on Vue.js, we will bind the
viewBox
to a computed property to specify the
width
and
height
values. Moreover, in our project, the properties
min-x
and
min-y
will always be set to 0.
Note that we do not use the
height
and
width
attributes of the
<svg>
element itself. We will set them to
width: 100%
and
height: 100%
using CSS. This will allow us to create an SVG image that flexibly adjusts to the page size.
Now that the user coordinate system is ready to draw a chart, let's talk about using the
size
variable to calculate the coordinates of the chart elements.
▍ Invariable and dynamic coordinates
Chart concept
The circle in which the drawing is displayed is part of the diagram. That is why it is important to include it in the calculations from the very beginning. Let us, based on the above illustration, find out the coordinates for the circle and for one experimental curve.
The height of the chart is divided into two parts. These are
topHeight
(20% of
size
) and
bottomHeight
(the remaining 80% of
size
). The total width of the chart is divided into 2 parts - the length of each of them is 50% of the
size
.
This makes the conclusion of the circle parameters not requiring special explanations (here the
halfSize
and
topHeight
indicators are used). The
radius
parameter is set to half the value of
topHeight
. Thanks to this, the circle fits perfectly into the available space.
Now let's take a look at the coordinates of the curves.
- The coordinates
(x0, y0)
define the starting reference point of the curve. These coordinates remain constant all the time. Thex0
coordinate is the center of the chart (half thesize
), andy0
is the coordinate at which the bottom of the circle ends. Therefore, in the formula for calculating this coordinate, the radius of the circle is used. As a result, the coordinates of this point can be found by the following formula: (50% size, 20% size + radius)
. - The coordinates
(x1, y1)
are the first control point of the curve. It also remains unchanged for all curves. If we do not forget that the curves should be symmetrical, then it turns out that the values ofx1
andy1
always equal half the value ofsize
. Hence the formula for their calculation:(50% size, 50% size)
. - The coordinates
(x2, y2)
represent the second control point of the Bezier curve. Here,x2
indicates what shape the curve should be. This indicator is calculated dynamically for each curve. And the indicatory2
, as before, will be half ofsize
. Hence the following formula for calculating these coordinates:(x2, 50% size)
. - The coordinates
(x3, y3)
are the end reference point of the curve. This coordinate indicates where you want to finish drawing the line. Here, the value ofx3
, likex2
, is calculated dynamically. Andy3
takes a value equal to 80% ofsize
. As a result, we obtain the following formula:(x3, 80% size)
.
We rewrite, in general terms, the code for the
<path>
element, taking into account the formulas that we just derived. The percentages used above are presented here by dividing them by 100.
<path d="M size*0.5, (size*0.2) + radius C size*0.5, size*0.5 x2, size*0.5 x3, size*0.8" >
Please note that at first glance, the use of percentages in our formulas may seem optional, based only on my own opinion. However, these values are not applied on a whim, but because their use helps to achieve symmetry and the correct proportions of the diagram. After you feel their role in charting, you can try your own percentage values and examine the results obtained by applying them.
Now let's talk about how we will look for the coordinates
x2
and
x3
. They allow you to dynamically create many curves based on the
index
elements in the corresponding array.
Dividing the available horizontal space of the chart into equal parts is based on the number of elements in the array. As a result, each part receives the same space along the x axis.
The formula that we derive should subsequently work with any number of elements. But here we will experiment with an array containing 5 elements:
[0,1,2,3,4]
. Visualization of such an array means that it is necessary to draw 5 curves.
▍Finding dynamic coordinates (x2 and x3)
First, I divided
size
by the number of elements, that is, by the length of the array. I called this variable
distance
. It represents the distance between two elements.
distance = size/arrayLength // distance = 1000/5 = 200
Then I walked around the array and multiplied the index of each of its elements (
index
) by
distance
. For simplicity, I simply call
x
both the
x2
parameter and the
x3
parameter.
// x2 x3 x = index * distance
If you apply the obtained values when building the diagram, that is, use the
x
value calculated above for both
x2
and
x3
, it will look a little strange.
The diagram is asymmetrical
As you can see, the elements are located in the area where they should be, but the diagram turned out to be asymmetric. It seems that in its left part there are more elements than in the right.
Now I need to make the
x3
value lie in the center of the corresponding segments, the length of which is set using the
distance
variable.
In order to bring the diagram to the form I need, I simply added to
x
half the value of
distance
.
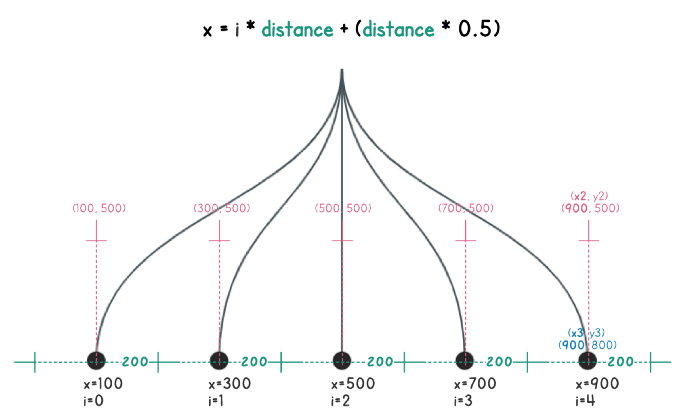
x = index * distance + (distance * 0.5)
As a result, I found the center of the
distance
segment and placed the
x3
coordinate in it. In addition, I brought to the form we need the
x2
coordinate for curve No. 2.
Symmetric chart
Adding half the
distance
value to the
x2
and
x3
coordinates made the formula for calculating these coordinates suitable for visualizing arrays containing an even and odd number of elements.
▍ Image masking
We need a certain image to be displayed at the top of the diagram, within the circle. To solve this problem, I created a clipping mask containing a circle.
<defs> <mask id="svg-mask"> <circle :r="radius" :cx="halfSize" :cy="topHeight" fill="white"/> </mask> </defs>
Then, using the
<image>
tag of the
<image>
<svg>
<image>
element to display the image, I linked the image to the
<mask>
element created above using the
mask
attribute of the
<image>
element.
<image mask="url(#svg-mask)" :x="(halfSize-radius)" :y="(topHeight-radius)" ... > </image>
Since we are trying to fit a square image into a round “window”, I adjusted the position of the element by subtracting the
radius
parameter from the corresponding parameters. As a result, the image is visible through a mask made in the form of a circle.
Let's collect all that we talked about in one drawing. This will help us see the overall picture of the progress of work.
Data used in calculating chart parameters
Creating a dynamic SVG image using Vue.js
At this point, we figured out the cubic Bezier curves and performed the calculations necessary to form the diagram. As a result, we can now create static SVG diagrams. If we combine the capabilities of SVG and Vue.js, we can create data driven charts. Static charts will become dynamic.
In this section, we revise the SVG diagram, presenting it as a set of Vue components. We will also attach the SVG attributes to the calculated properties and make the chart respond to data changes.
In addition, at the end of the project, we will create a component that represents a configuration panel. This component will be used to enter data that will be transmitted to the chart.
▍Binding data to viewBox parameters
Let's start by adjusting the coordinate system. Without doing this, we will not be able to draw SVG images. The computed
viewbox
property will return what we need using the
size
variable. There will be four values separated by spaces. All this will become the value of the
viewBox
attribute of the
<svg>
element.
viewbox() { return "0 0 " + this.size + " " + this.size; }
In SVG, the name of the
viewBox
attribute
viewBox
already written using camel style.
<svg viewBox="0 0 1000 1000"> </svg>
Therefore, in order to correctly bind this attribute to the calculated property, I wrote down the attribute name in the kebab style and put the
.camel
modifier after it. With this approach, it is possible to "trick" HTML and correctly implement attribute binding.
<svg :view-box.camel="viewbox"> ... </svg>
Now when you change the
size
chart is reconfigured independently. We do not need to manually change the layout.
▍Calculation of curve parameters
Since most of the values needed to construct the curves are calculated on the basis of a single variable (
size
), I used the calculated properties to find all the fixed coordinates. What we call “fixed coordinates” here is calculated on the basis of
size
, and after that it does not change and does not depend on how many curves the diagram will include.
If you change the
size
- "fixed coordinates" will be recounted. After that, they will not change until the next
size
change. Given the above, here are five values we need to draw Bezier curves:
-
topHeight — size * 0.2
-
bottomHeight — size * 0.8
-
width — size
-
halfSize — size * 0.5
-
distance — size/arrayLength
Now we have only two unknown values left -
x2
and
x3
. The formula for calculating them we have already derived:
x = index * distance + (distance * 0.5)
To find specific values, we need to substitute the indices of the array elements in this formula.
Now let's ask ourselves if the computed property is right for us to find
x
. Briefly answer this question, then - no, it will not do.
The calculated property cannot be passed parameters. The fact is that this is a property, not a function. In addition, the need to use a parameter to calculate something means that there is no tangible advantage of using calculated properties in terms of caching.
Please note that there is an exception regarding the above principle. It's about Vuex. If you use Vuex getters that return functions, you can pass parameters to them.
In this case, we do not use Vuex. But even in this situation, we have a couple of ways to solve this problem.
▍ Option number 1
You can declare a function to which
index
passed as an argument, and which returns the result we need. This approach looks cleaner if we are going to use the value returned by a similar function in several places in the template.
<g v-for="(item, i) in itemArray"> <path :d="'M' + halfSize + ',' + (topHeight+r) +' '+ 'C' + halfSize + ',' + halfSize +' '+ calculateXPos(i) + ',' + halfSize +' '+ calculateXPos(i) + ',' + bottomHeight" /> </g>
The
calculateXPos()
method will perform calculations every time it is called. This method takes as argument the index of the element -
i
.
<script> methods: { calculateXPos (i) { return distance * i + (distance * 0.5) } } </script>
Here is an example on CodePen that uses this solution.
Screen for the first application variant
▍ Option number 2
This option is better than the first. We can extract the small SVG markup needed to build the curve into a separate small child component and pass
index
to it as one of the properties.
With this approach, you can even use the computed property to find
x2
and
x3
.
<g v-for="(item, i) in items"> <cubic-bezier :index="i" :half-size="halfSize" :top-height="topHeight" :bottom-height="bottomHeight" :r="radius" :d="distance" > </cubic-bezier> </g>
This option gives us the opportunity to better organize the code. For example, we can create another child component for the mask:
<clip-mask :title="title" :half-size="halfSize" :top-height="topHeight" :r="radius"> </clip-mask>
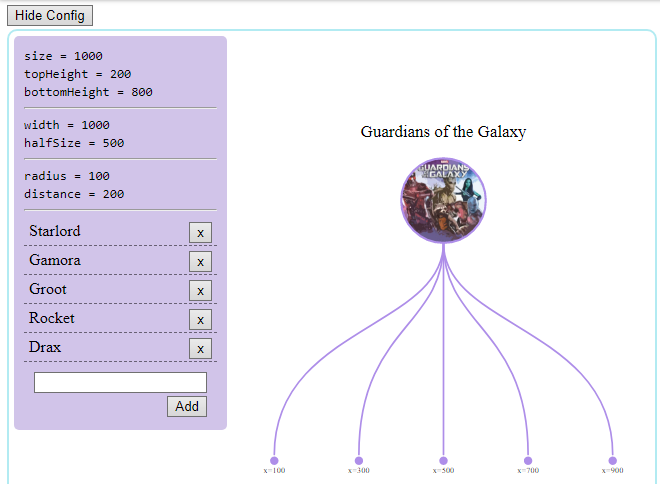
▍Configuration panel
Configuration panel
You have probably already seen the configuration panel, called up by the button located in the upper left corner of the screen of the above example . This panel makes it easy to add elements to the array and remove them from it. Following the ideas discussed in the "Option # 2" section, I created a child component for the configuration panel. Thanks to this, the top-level component is clean and well readable. As a result, our small, nice tree of Vue components looks something like the one below.
Project Component Tree
Want to take a look at the code that implements this version of the project? If so, take a look here .
Screen for the second application variant
Project repository
Here is the GitHub repository of the project (“Option # 2” is implemented here). I believe it will be useful for you to look at it before you move on to the next section.
Homework
Try to create the same diagram that we described here, but make it oriented vertically. Take advantage of the ideas outlined in this article.
If you think that this is an easy task, that to build such a diagram it is enough to swap the
x
and
y
coordinates, then you are right. Considering that the project considered here was not created as universal, after changing the coordinates where you need it, you will also need to edit the code by renaming some variables and methods.
Thanks to Vue.js, our simple chart can be equipped with additional features. For example, the following:
- You can create a mechanism that allows you to switch between horizontal and vertical chart modes.
- Curves can try to animate. For example, using GSAP.
- You can adjust the properties of the curves (say - color and line width) from the configuration panel.
- You can use an external library to organize the saving of diagrams in any graphic format or as a PDF file. These materials can be allowed to download to those who work with the chart.
Try this homework. And if you have any problems - below will be given a link to its solution.
Summary
The
<path>
element is one of the powerful features of SVG. This element allows you to create various images with high accuracy. Here we figured out how the Bezier curves are structured, and how to put them into practice to create your own diagrams.
, , JavaScript-. Vue.js . , , , , DOM. , — .
, , , , , Vue.js SVG. — , Vue.js. — .
, - , , , — .
Dear readers! ?
All Articles