Simplify the analysis of windows memory dumps or another tweak of the context menu
Many users of windows operating systems sooner or later are faced with the need to find out why the favorite OS “falls into bsod”.
Much has already been written on the Internet about how to look for the cause and how to fix it (depending on the situation), but what to do if you need to find out the reason as quickly as possible and have to do it regularly, for example, to employees of services or regular computer forums?
Simplify the task can notorious tweaks of the context menu, the benefit they are made quite simple.
Since my task assumes that there are many and often dumps, it is necessary to speed up the process as much as possible, while making it sufficiently informative for a cursory analysis.
As a basis for the future of tweak, we will take a batch file that is enough to drag the necessary dump.
For better perception of information, in my understanding, I inverted the colors of the console and set the size of the console window to be larger.
Here you can see the parameters passed by kd.exe, such as -y , -i and, in fact, -z , which have been seen by everyone who knows about the widely known kdfe.cmd in narrow circles.
If we take, by analogy with common instructions, there are some minor differences: -nosqm and -sup are additionally passed as arguments.
As commands:
I will not paint them, because too much copy-paste will be released. Anyone interested will be able to find detailed debugger.chm help in either of the two * .msi mentioned above or on docs.microsoft.com -cpuid -sysinfo . In short - basic information about the gland of the victim.
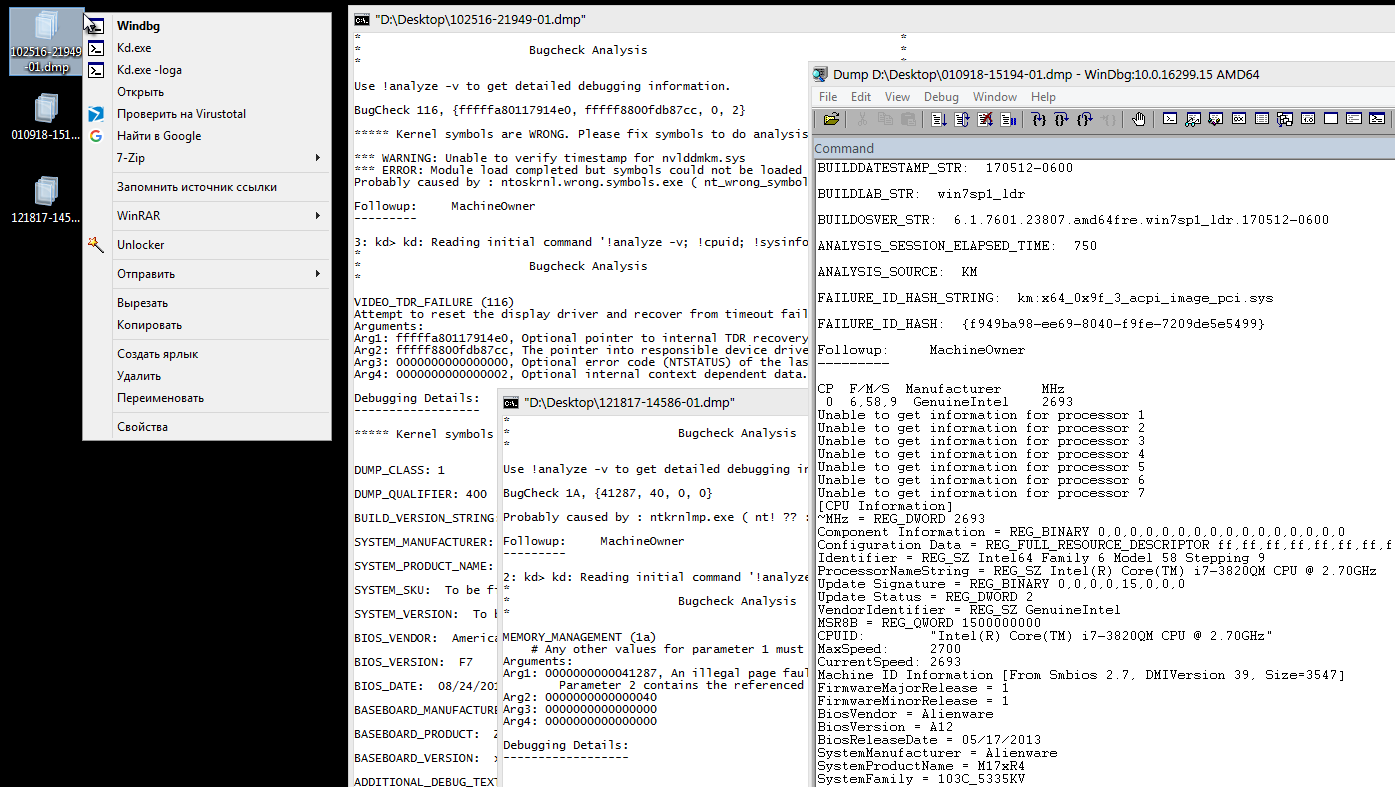
The output of the script using kd.exe will turn out to be almost similar to what would have been possible when working directly through windbg, but the result is achieved much faster since you do not need to open anything, set up folders, open a dump through the menu and enter commands into the debugger.
For the first example, let's take a memory dump of a random user. There is a small problem with garbage in the output:
This happens, for example, in dumps of users using the odin activator, which we see in this example.
The full output is quite massive, because of the link to pastebin .
It is required to “filter” unnecessary lines leaving only useful information.
I used findstr , it was such an ugly but working solution:
Here findstr uses two regulars: one searches for lines starting with three asterisks, one space and ending with a space and three asterisks. The second one looks for lines starting with 14 stars. I could not do anything more intelligible with means of findstr.
(I do not recommend using the end of line characters in regulars findstr on the kd.exe exhaust, there may be problems with the end of the lines output of kd.exe. Instead of \ r \ n you can get \ n , which findstr does not consider the end of the line. Such a rake.)
The whole code of the preliminary batch file with the “filter” is as follows:
The complete output of the filtered version is also on pastebin .
The result is the same, but without the "garbage". 290 lines of text against the 894's. Already better, but not all.
The next step is to add the creation of a log that could be posted or sent somewhere.
To do this, pass the kd.exe argument to -loga <"P: \ bit to \ log.log">
The code takes the following form:
For the file 102516-21949-01.dmp , the log 102516-21949-01.LOG will be generated in the same folder as the dump itself.
In this case, the output of "garbage" in the log is not filtered, only the output in the console is filtered, but in my case it does not matter, although you can fix it and clearing the log after it is created:
Now the last step, but not least, is a step: you need the opportunity to transfer the dump directly to windbg.exe and immediately transfer commands to it that you most likely need to enter. Everything is done by analogy with kd.exe, the arguments and commands accepted by windbg.exe are almost identical to kd.exe
As a result, the dump will open immediately in the debugger and the commands listed in the -c key will be automatically executed in it.
The conclusion is similar to the very first variant with the difference that the dump is open immediately in windbg, it is possible to enter commands for further analysis due to the lack of q commands in the transmitted command list.
(By the way, if in previous versions of the script with kd.exe you remove the q command transmitted in the command list with the -c argument, then the opportunity to continue working with the dump will appear there, including recording the log right in the process.)
Now all this needs to be modified to be able to be screwed to the context menu of * .dmp files. Actually, for what it was started.
Such "one-liners" have turned out:
For option with console output filtering
For the variant with filtering console output and creating a log file
(I had to use deferred variable expansion )
To open the dump directly in windbg.exe
In the registry created the following section structure:

A separate type of file dmp_geek was created in the registry keys of which was modified. Files with the extension * .dmp were assigned files of type dmp_geek .
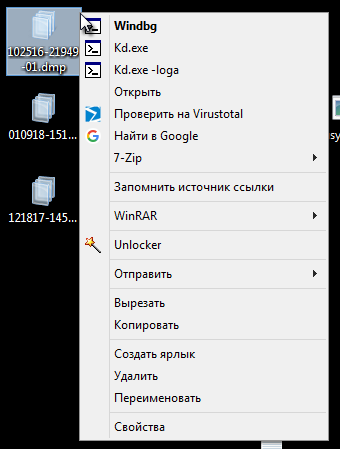
In each section of the command, the corresponding one-line characters + beautifulness were entered into the string parameter by default in the form of icons and convenient names of the displayed names of the items in the context menu.
It turned out a tweak that adds the ability to massively open dumps in the console both in the console and in the debugger with filtering "garbage" and creating logs for each dump as needed. Saves quite a lot of time.
After “combing” the registry exported everything to the final REG file ready for use.
→ Download from Ya.Disk GEEK_DMP.reg
That's all. Now you can quickly, albeit superficially, immediately analyze a stack of dumps.
Much has already been written on the Internet about how to look for the cause and how to fix it (depending on the situation), but what to do if you need to find out the reason as quickly as possible and have to do it regularly, for example, to employees of services or regular computer forums?
Simplify the task can notorious tweaks of the context menu, the benefit they are made quite simple.
Training
First you need to install the package with the debagger windbg.exe, the console version of kd.exe and other necessary content.
These are X64 Debuggers And Tools-x64_en-us.msi or X86 Debuggers And Tools-x86_en-us.msi packages to choose from, depending on the bitness of the operating system used and / or personal preferences.
You will not find individual links on the microsoft website, but these packages are included in the Windows Driver Kit , it can be downloaded without installation by selecting the appropriate installer mode, the packages will be in the \ Windows Kits \ 10 \ WDK \ Installers folder after the download is completed.
If someone needs, I downloaded them separately on Ya.Disk:
X64 Debuggers And Tools-x64_en-us.msi
X86 Debuggers And Tools-x86_en-us.msi
I decided not to install the debugger, but simply unpack the msi:
This "portable" option is more than enough. After that, for my own convenience, I moved the necessary content from several subfolders to C: \ Portable \ Debug to make it:
+ everything else. From this path we will continue to build on (plus I added it to% PATH% again, for convenience).
At this preparatory activities can be considered completed and proceed to the description of the process of creating tweaks.
These are X64 Debuggers And Tools-x64_en-us.msi or X86 Debuggers And Tools-x86_en-us.msi packages to choose from, depending on the bitness of the operating system used and / or personal preferences.
You will not find individual links on the microsoft website, but these packages are included in the Windows Driver Kit , it can be downloaded without installation by selecting the appropriate installer mode, the packages will be in the \ Windows Kits \ 10 \ WDK \ Installers folder after the download is completed.
If someone needs, I downloaded them separately on Ya.Disk:
X64 Debuggers And Tools-x64_en-us.msi
X86 Debuggers And Tools-x86_en-us.msi
I decided not to install the debugger, but simply unpack the msi:
msiexec /a "D:\Desktop\X64 Debuggers And Tools-x64_en-us.msi" /qb targetdir="D:\Desktop\Temp"
This "portable" option is more than enough. After that, for my own convenience, I moved the necessary content from several subfolders to C: \ Portable \ Debug to make it:
C:\Portable\Debug\windbg.exe
C:\Portable\Debug\kd.exe
+ everything else. From this path we will continue to build on (plus I added it to% PATH% again, for convenience).
At this preparatory activities can be considered completed and proceed to the description of the process of creating tweaks.
Since my task assumes that there are many and often dumps, it is necessary to speed up the process as much as possible, while making it sufficiently informative for a cursory analysis.
Understanding the keys and debugger commands
As a basis for the future of tweak, we will take a batch file that is enough to drag the necessary dump.
For better perception of information, in my understanding, I inverted the colors of the console and set the size of the console window to be larger.
@echo off title text %1 mode con: cols=170 color F0 title "%1" kd.exe -nosqm -sup -z "%1" ^ -y srv*"C:\Symbols"*http://msdl.microsoft.com/download/symbols -i srv*"C:\Symbols"*http://msdl.microsoft.com/download/symbols -c ^ "!analyze -v; !cpuid; !sysinfo cpuinfo; !sysinfo cpuspeed; !sysinfo machineid; q"" pause exit /b
Here you can see the parameters passed by kd.exe, such as -y , -i and, in fact, -z , which have been seen by everyone who knows about the widely known kdfe.cmd in narrow circles.
-i !ImagePath! specifies the location of the executables that generated the fault (see _NT_EXECUTABLE_IMAGE_PATH) -y !SymbolsPath! specifies the symbol search path (see _NT_SYMBOL_PATH) -z !CrashDmpFile! specifies the name of a crash dump file to debug
If we take, by analogy with common instructions, there are some minor differences: -nosqm and -sup are additionally passed as arguments.
-nosqm disables SQM data collection/upload. -sup enables full public symbol searches
As commands:
!cpuid !sysinfo cpuinfo !sysinfo cpuspeed !sysinfo machineid
I will not paint them, because too much copy-paste will be released. Anyone interested will be able to find detailed debugger.chm help in either of the two * .msi mentioned above or on docs.microsoft.com -cpuid -sysinfo . In short - basic information about the gland of the victim.
The output of the script using kd.exe will turn out to be almost similar to what would have been possible when working directly through windbg, but the result is achieved much faster since you do not need to open anything, set up folders, open a dump through the menu and enter commands into the debugger.
Filter trash output from the console
For the first example, let's take a memory dump of a random user. There is a small problem with garbage in the output:
Screenshot of console output 
This happens, for example, in dumps of users using the odin activator, which we see in this example.
The full output is quite massive, because of the link to pastebin .
It is required to “filter” unnecessary lines leaving only useful information.
I used findstr , it was such an ugly but working solution:
findstr /r /v /c:"^\*\*\* .* \*\*\*" /c:"^\*\*\*\*\*\*\*\*\*\*\*\*\*\*.*"
Here findstr uses two regulars: one searches for lines starting with three asterisks, one space and ending with a space and three asterisks. The second one looks for lines starting with 14 stars. I could not do anything more intelligible with means of findstr.
(I do not recommend using the end of line characters in regulars findstr on the kd.exe exhaust, there may be problems with the end of the lines output of kd.exe. Instead of \ r \ n you can get \ n , which findstr does not consider the end of the line. Such a rake.)
The whole code of the preliminary batch file with the “filter” is as follows:
@echo off title text %1 mode con: cols=170 color F0 title "%1" kd.exe -nosqm -sup -z "%1" ^ -y srv*"C:\Symbols"*http://msdl.microsoft.com/download/symbols -i srv*"C:\Symbols"*http://msdl.microsoft.com/download/symbols ^ -c "!analyze -v; !cpuid; !sysinfo cpuinfo; !sysinfo cpuspeed; !sysinfo machineid; q" | findstr /r /v /c:"^\*\*\* .* \*\*\*" /c:"^\*\*\*\*\*\*\*\*\*\*\*\*\*\*.*" pause exit /b
The complete output of the filtered version is also on pastebin .
The result is the same, but without the "garbage". 290 lines of text against the 894's. Already better, but not all.
Quickly create debug logs
The next step is to add the creation of a log that could be posted or sent somewhere.
To do this, pass the kd.exe argument to -loga <"P: \ bit to \ log.log">
The code takes the following form:
@echo off title text %1 mode con: cols=170 color F0 title "%1" set "D=%1" set L=%D:.dmp=.LOG% kd.exe -nosqm -sup -loga "%L%" -z "%D%" ^ -y srv*"C:\Symbols"*http://msdl.microsoft.com/download/symbols -i srv*"C:\Symbols"*http://msdl.microsoft.com/download/symbols ^ -c "!analyze -v; !cpuid; !sysinfo cpuinfo; !sysinfo cpuspeed; !sysinfo machineid; q" | findstr /r /v /c:"^\*\*\* .* \*\*\*" /c:"^\*\*\*\*\*\*\*\*\*\*\*\*\*\*.*" pause exit /b
For the file 102516-21949-01.dmp , the log 102516-21949-01.LOG will be generated in the same folder as the dump itself.
In this case, the output of "garbage" in the log is not filtered, only the output in the console is filtered, but in my case it does not matter, although you can fix it and clearing the log after it is created:
@echo off title text %1 mode con: cols=170 color F0 title "%1" set "D=%1" set L=%D:.dmp=.LOG% kd.exe -nosqm -sup -loga "%L%" -z "%D%" ^ -y srv*"C:\Symbols"*http://msdl.microsoft.com/download/symbols -i srv*"C:\Symbols"*http://msdl.microsoft.com/download/symbols ^ -c "!analyze -v; !cpuid; !sysinfo cpuinfo; !sysinfo cpuspeed; !sysinfo machineid; q" | findstr /r /v /c:"^\*\*\* .* \*\*\*" /c:"^\*\*\*\*\*\*\*\*\*\*\*\*\*\*.*" set CL=%L:.LOG=_CLEAN.LOG% type "%L%" | findstr /r /v /c:"^\*\*\* .* \*\*\*" /c:"^\*\*\*\*\*\*\*\*\*\*\*\*\*\*.*" >> "%CL%" del /f /q "%L%" pause exit /b
Opening a dump in windbg
Now the last step, but not least, is a step: you need the opportunity to transfer the dump directly to windbg.exe and immediately transfer commands to it that you most likely need to enter. Everything is done by analogy with kd.exe, the arguments and commands accepted by windbg.exe are almost identical to kd.exe
@echo off windbg.exe -z "%1" -sup -y ^ "srv*C:\Symbols*http://msdl.microsoft.com/download/symbols" -i "srv*C:\Symbols*http://msdl.microsoft.com/download/symbols" -c "!analyze -v; !cpuid; !sysinfo cpuinfo; !sysinfo cpuspeed; !sysinfo machineid" exit /b
As a result, the dump will open immediately in the debugger and the commands listed in the -c key will be automatically executed in it.
The conclusion is similar to the very first variant with the difference that the dump is open immediately in windbg, it is possible to enter commands for further analysis due to the lack of q commands in the transmitted command list.
(By the way, if in previous versions of the script with kd.exe you remove the q command transmitted in the command list with the -c argument, then the opportunity to continue working with the dump will appear there, including recording the log right in the process.)
Creating tweaks
Now all this needs to be modified to be able to be screwed to the context menu of * .dmp files. Actually, for what it was started.
Such "one-liners" have turned out:
For option with console output filtering
cmd /d /k mode con: cols=170 & color F0 & title "%1" & kd.exe -nosqm -sup -z "%1" -y srv*"C:\Symbols"*http://msdl.microsoft.com/download/symbols -i srv*"C:\Symbols"*http://msdl.microsoft.com/download/symbols -c "!analyze -v; !cpuid; !sysinfo cpuinfo; !sysinfo cpuspeed; !sysinfo machineid; q" | findstr /r /v /c:"^\*\*\* .* \*\*\*" /c:"^\*\*\*\*\*\*\*\*\*\*\*\*\*\*.*"
For the variant with filtering console output and creating a log file
(I had to use deferred variable expansion )
cmd /d /v /k mode con: cols=170 & color F0 & title "%1" & set "D=%1"& set L=!D:.dmp=.LOG! & kd.exe -nosqm -sup -loga "!L!" -z "!D!" -y srv*"C:\Symbols"*http://msdl.microsoft.com/download/symbols -i srv*"C:\Symbols"*http://msdl.microsoft.com/download/symbols -c "!analyze -v; !cpuid; !sysinfo cpuinfo; !sysinfo cpuspeed; !sysinfo machineid; q" | findstr /r /v /c:"^\*\*\* .* \*\*\*" /c:"^\*\*\*\*\*\*\*\*\*\*\*\*\*\*.*"
To open the dump directly in windbg.exe
"C:\Portable\Debug\windbg.exe" -z "%1" -sup -y "srv*C:\Symbols*http://msdl.microsoft.com/download/symbols" -i "srv*C:\Symbols*http://msdl.microsoft.com/download/symbols" -c "!analyze -v; !cpuid; !sysinfo cpuinfo; !sysinfo cpuspeed; !sysinfo machineid"
In the registry created the following section structure:
A separate type of file dmp_geek was created in the registry keys of which was modified. Files with the extension * .dmp were assigned files of type dmp_geek .
In each section of the command, the corresponding one-line characters + beautifulness were entered into the string parameter by default in the form of icons and convenient names of the displayed names of the items in the context menu.
It turned out a tweak that adds the ability to massively open dumps in the console both in the console and in the debugger with filtering "garbage" and creating logs for each dump as needed. Saves quite a lot of time.
After “combing” the registry exported everything to the final REG file ready for use.
REG file contents
Windows Registry Editor Version 5.00 [HKEY_CLASSES_ROOT\.dmp] @="dmp_geek" [HKEY_CLASSES_ROOT\dmp_geek] @="dmp_geek" "FriendlyTypeName"=" " [HKEY_CLASSES_ROOT\dmp_geek\DefaultIcon] @="imageres.dll,142" [HKEY_CLASSES_ROOT\dmp_geek\shell] [HKEY_CLASSES_ROOT\dmp_geek\shell\kd.exe] "MUIVerb"="Kd.exe" "Icon"="C:\\Portable\\Debug\\windbg.exe,6" [HKEY_CLASSES_ROOT\dmp_geek\shell\kd.exe\command] @="cmd /d /k mode con: cols=170 & color F0 & title \"%1\" & \"C:\\Portable\\Debug\\kd.exe\" -nosqm -sup -z \"%1\" -y srv*\"C:\\Symbols\"*http://msdl.microsoft.com/download/symbols -i srv*\"C:\\Symbols\"*http://msdl.microsoft.com/download/symbols -c \"!analyze -v; !cpuid; !sysinfo cpuinfo; !sysinfo cpuspeed; !sysinfo machineid; q\" | findstr /r /v /c:\"^\\*\\*\\* .* \\*\\*\\*\" /c:\"^\\*\\*\\*\\*\\*\\*\\*\\*\\*\\*\\*\\*\\*\\*.*\"" [HKEY_CLASSES_ROOT\dmp_geek\shell\kd.exe_-loga] "MUIVerb"="Kd.exe -loga" "Icon"="C:\\Portable\\Debug\\windbg.exe,6" [HKEY_CLASSES_ROOT\dmp_geek\shell\kd.exe_-loga\command] @="cmd /d /v /k mode con: cols=170 & color F0 & title \"%1\" & set \"D=%1\"& set L=!D:.dmp=.LOG! & \"C:\\Portable\\Debug\\kd.exe\" -nosqm -sup -loga \"!L!\" -z \"!D!\" -y srv*\"C:\\Symbols\"*http://msdl.microsoft.com/download/symbols -i srv*\"C:\\Symbols\"*http://msdl.microsoft.com/download/symbols -c \"!analyze -v; !cpuid; !sysinfo cpuinfo; !sysinfo cpuspeed; !sysinfo machineid; q\" | findstr /r /v /c:\"^\\*\\*\\* .* \\*\\*\\*\" /c:\"^\\*\\*\\*\\*\\*\\*\\*\\*\\*\\*\\*\\*\\*\\*.*\"" [HKEY_CLASSES_ROOT\dmp_geek\shell\Open] "MUIVerb"="Windbg" "Icon"="C:\\Portable\\Debug\\windbg.exe,6" [HKEY_CLASSES_ROOT\dmp_geek\shell\Open\command] @="\"C:\\Portable\\Debug\\windbg.exe\" -z \"%1\" -sup -y \"srv*C:\\Symbols*http://msdl.microsoft.com/download/symbols\" -i \"srv*C:\\Symbols*http://msdl.microsoft.com/download/symbols\" -c \"!analyze -v; !cpuid; !sysinfo cpuinfo; !sysinfo cpuspeed; !sysinfo machineid\""
→ Download from Ya.Disk GEEK_DMP.reg
That's all. Now you can quickly, albeit superficially, immediately analyze a stack of dumps.
Used materials, sources, useful links on the topic:
All Articles