Why can't we compare headphone amplifiers from the position of loudness by their power?
We are accustomed to the fact that usually the amplifier whose output power is higher under the same conditions (the same load and comparable distortion) is louder. So why does this rule fail with headphone amplifiers? How to compare them?
To begin with, remember that power is the product of voltage and current, and the current depends on the magnitude of the voltage and the load rating.
W = U * I
I = U / R
We cannot increase power by adding only current without changing voltage. In other words, the volume control, we only adjust the voltage at the output of the amplifier, and the current will be consumed depending on the resistance of the load (speakers or headphones). If we increase the voltage, the current consumption will automatically increase.
Any amplifier has limiting characteristics that can be expressed as the maximum level of current and voltage for given quality criteria. If we set the output level at which the amplified signal goes beyond the voltage limit value, the “tips” of the wave will be cut off.
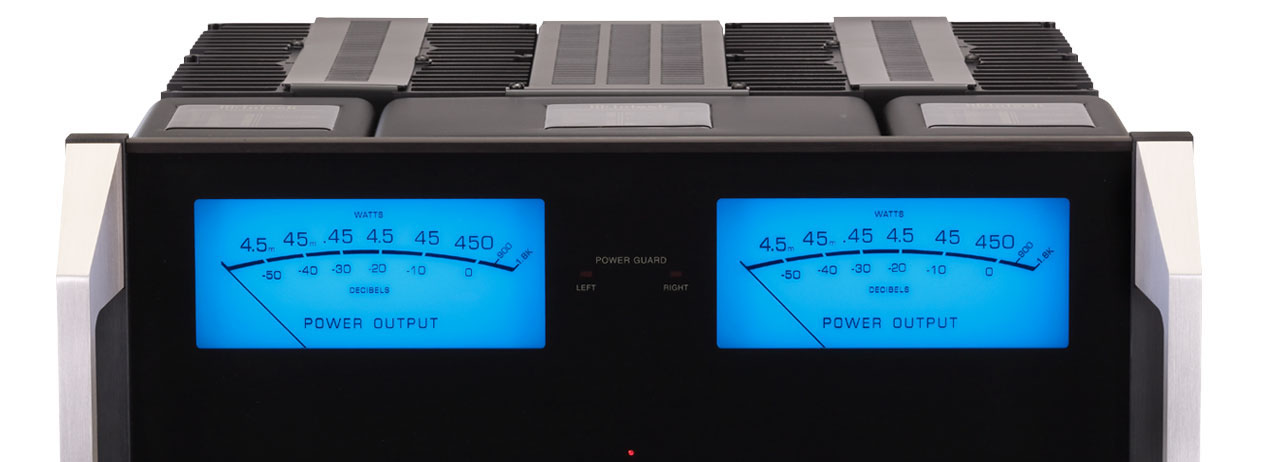
An example of a waveform from iHiFi-100, asymmetrical limitation
This kind of distortion is often referred to as “clipping” or “overload”. But there can be such a situation when the limiting voltage is not exceeded, but the current consumption on the load (speakers or headphones) is higher than the amplifier can give. As a result, we get similar sound distortion.
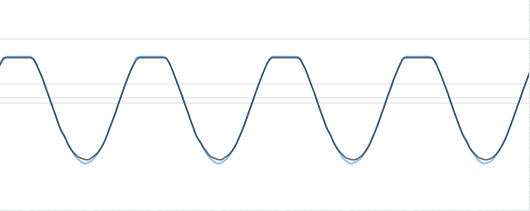
The current limit for the Audiolab M-DAC is low impedance. The upper limit for the wave is “soft,” and the lower is “hard.”
Since power is the product of current and voltage, at equal output power, current and voltage are inversely proportional.
U = W / I, I = W / U
With equal sensitivity to the power of the speakers (or headphones), but with different resistance, to ensure equal sound pressure at the output requires the same power, but different ratios of current and voltage.
Almost all speakers with dynamic emitters of low-impedance type - 4 or 8 ohms. For such a load from the amplifier, the value of the output current is first of all important, since The voltage required is relatively small.
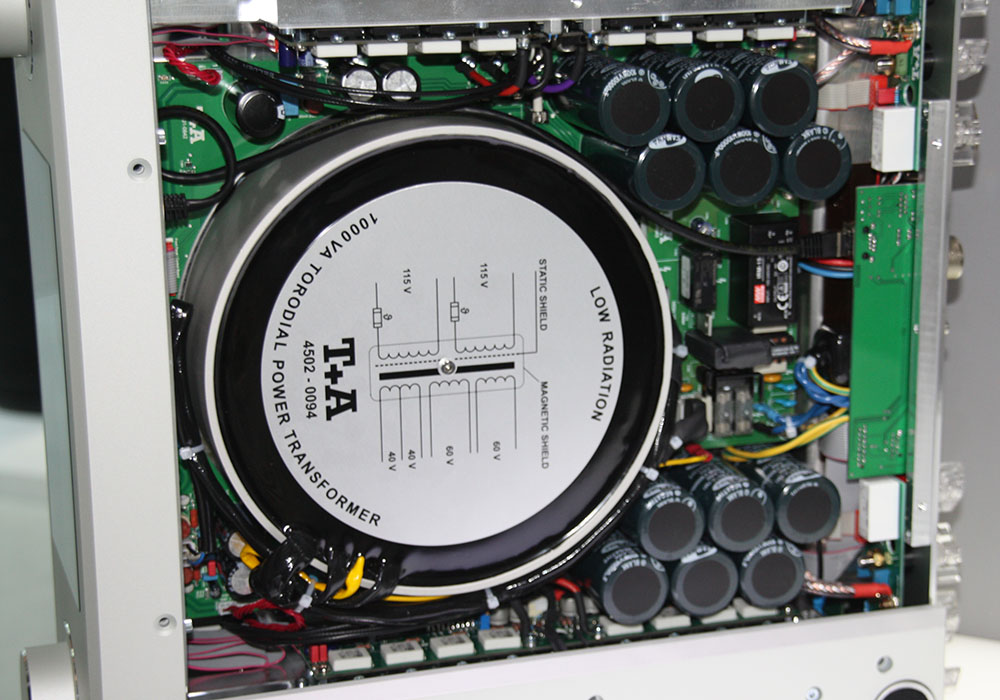
How usually determine the potential of the amplifier? At whom the transformer is heavier and the capacity of capacitors in the power supply unit is greater, that is better. Although this is an indirect indicator, it is often fairly accurate.
The musical signal is not a pure long-term sine, it is energetically 9-15 dB "quieter" due to the uneven amplitude in time. If for example we measured the power of 10 W (4 Ohms, 6.3 Vrms, 1.5 A), then the actual average value consumed would be 3.5 W (with an energy density of 9 dB below). Thus, if we turn up the volume by 9 dB, then by the value of the voltage on the music signal there will be a real 10 W.
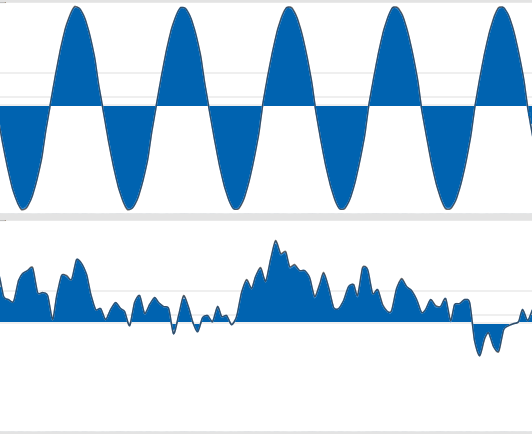
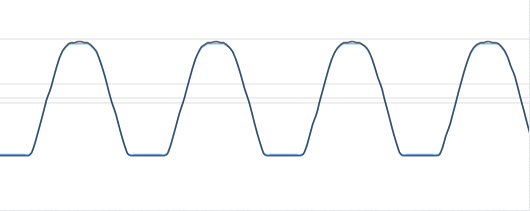
Kind of a wave for a sine and musical signal
The picture shows the shaded areas for the sine and musical signal. The ratio of the areas is the same as the ratio of current consumption with equal amplitude voltage.
If the power supply does not have enough capacity, then at the moments of short-term high power we will get distortions in the sound from current clipping. But, with sufficient capacity in the power, the amplifier will receive the necessary power. It is for this reason that close attention is often paid to the capacitance of capacitors. The amplifier with capacitive capacitors in fact will be more powerful, although in the test for sinuses in power (long-term) it will be equal to the amplifier with a smaller capacitance in the power supply.
Another more important point is that if the amplifiers have the same voltage limit, for example 5 Vrms, then the sine will have a current consumption of 1.25 A at a load of 4 Ohms and a music one with a density of 9 dB lower than 0.4 A. Suppose that two amplifiers for 4 ohms declared power as 6 W (5 Vrms, 1.2 A) and 4 W (5 Vrms, 0.8 A). As you can see, in the first amplifier the power on the sine is higher, but on the music signal the amplifiers will play at the same volume, since their maximum voltage is the same. There will be no clipping due to lack of current, since Both amplifiers can produce more than 0.4 amps for 4 ohms. The power reserve of the first amplifier is simply redundant (this is how statements appear that the characteristics lie and cannot be relied upon).
The difference between the sine and the musical signal is so obvious that in all standards one way or another there are recommendations to measure or indicate the final data on the signals close to the musical one. But none of these recommendations has taken root. The main reason is that most amplifiers have a voltage margin much higher than the current margin for a low-impedance load.
For example, if an amplifier without a load can produce 12 Vrms, but under load with a current of 0.6 A, we will get clipping at 2.4 Vrms per 4 Ohms on the sine and on 6.7 Vrms on the music signal. Before the voltage limit, we simply do not reach.
The consumer has a simple question that plays louder, and power ranking in most cases gives the right answer, because in terms of voltage and current, only current will be the limiting factor. If we recalculate the power in “current + voltage”, then we will simply do the extra calculations, and the answer will be the same.
Moreover, comparing the values of power, voltage and current, we do not get the answer “how much louder”, because such an answer is contained only in units expressed in decibels. For example, the power of three amplifiers will be placed as follows: 10 W, 20 W and 30 W. But in terms of volume, will an amplifier with a power of 20 watts be in the middle? In units expressed in dB, the power will look like: 10 dBW, 13 dBW and 14.7 dBW. Ratios like -3 / 0 / 1.7 dB. Thus, an amplifier with a power of 20 watts will be much closer to an amplifier of 30 watts.
Perhaps, if the development of computers had happened earlier, and the authors of glossy magazines and readers could read logarithms, then we would see not abstract values of the power of amplifiers, but specific values of sound pressure at the output of specific speakers and amplifiers. But alas, it was too difficult, although it would give a more accurate answer.
But back to the main point - simplifying the ranking of amplifiers in terms of loudness from power did not lead to contradictions (especially for budget amplifiers), since the limiting factor was mainly current. But with headphone amplifiers, the problem rose to its full height.
Common headphone impedances range from 16 to 300 ohms. For low-impedance headphones, the current will be the limiting parameter, and for high-impedance ones - the voltage. In addition, for low-impedance headphones, a current of at least 9-15 dB will be available.
If the amplifier for speakers of typical loads had only two, 4 and 8 Ohms (and respectively two values of power level), then for a headphone amplifier such typical resistances are about 8: 8, 16, 24, 32, 60, 100, 200, 300 and 600 ohms. In the best case, manufacturers indicate the power value for two values.
Untrained users do not always notice that the power of different amplifiers is indicated for different loads and it is impossible to compare the power of 0.5 W @ 32 Ohm and 0.3 W @ 300 Ohm.
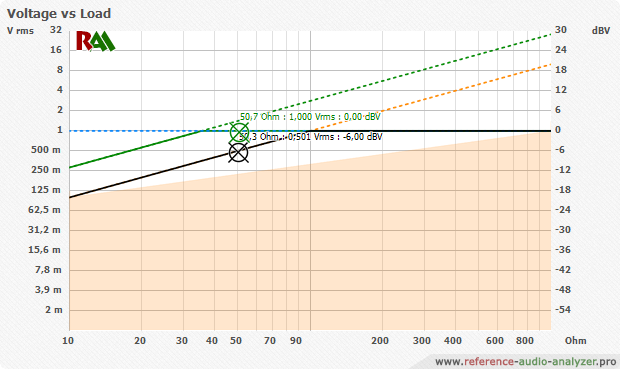
If you plot the output voltage for the amplifier, it will take this form.
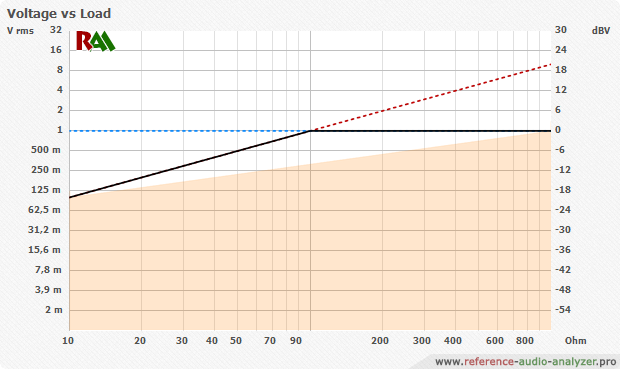
On the horizontal axis - the resistance of the load (speakers or headphones). Vertically, voltage, to the left in Vrms (familiar to many), and to the right in dBV. dBV is the voltage value in decibels, where 1 Vrms is taken for 0 dB. In these units, the voltage for professional equipment has long been indicated; Level adjustment in dB. In our case, this is convenient due to the direct comparison of the volume immediately in dB.
The blue dashed line is a voltage limit. In the example, this is 0 dBV or 1 Vrms. For simplicity of the example, the output impedance of the amplifier is 0 Ohms and this line is strictly horizontal.
The red line is the voltage value at the output current of 10 mA (according to the formula U = I * R).
The black line is the result of current and voltage limits. If the voltage values are recalculated into power, we get 1.6 mW (at -16 dBV) for 16 Ohms and 3.3 mW (0 dBV) for 300 Ohms.
The power ratios give a difference of 3 dB (10 * Log10 (W1 / W2) = 10 * Log10 (3.3 / 1.6) = 3 dB). Consider an example with headphones with a sensitivity of 100 dB / mW when estimating from a voltage graph:
If we have headphones with a sensitivity of 118 dB / V SPL (100 dB / mW) at 16 Ohm, then for them the maximum sound pressure will be equal to -16 dBV + 118 dB / V SPL = 102 dB SPL. For headphones with a sensitivity of 105 dB / V SPL (100 dB / mW) at 300 Ohms, the sound pressure will be 0 dBV + 105 dB / V SPL = 105 dB SPL. The difference in volume between the headphones connected to this amplifier will be 105 dB SPL - 102 dB SPL = 3 dB, where the high impedance model will play louder.
Mathematically, it's all good for sine. But for the music signal, the calculation will be different.
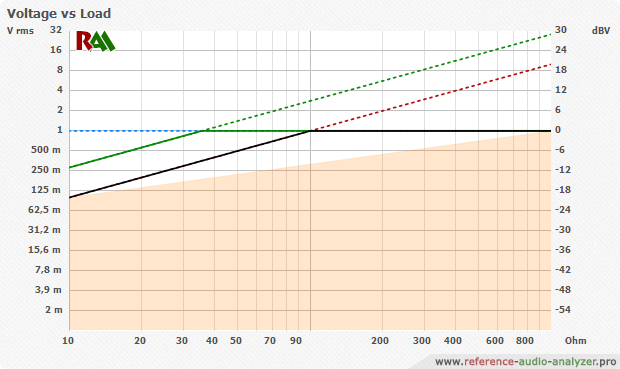
Since the signal energy density is at least 9 dB lower, the current limit will be along the green dashed line, which is 9 dB higher, respectively.
Voltage ratios will be different.
For 16 ohms:
- For sine, we will have a value of -16 dBV.
- For a music signal, the value will already be 9 dB higher, equal to -7 dBV, and the “music” power should already be not 1.6 mW, but 12 mW!
- If we forget about the quality (if the current level is exceeded, we get distortion) or if the signal energy density is even lower, then the value can reach 0 dBV.
For 300 ohm nothing will change, because there is only a voltage limit. For the example above, for a music signal, headphones with a sensitivity of 118 dB / V at 16 ohms will give a sound pressure of -7 dBV + 118 dB / V SPL = 111 dB SPL. And the difference between the low-resistance and high-resistance model will be 111 dB SPL - 105 dB SPL = 6 dB, where the low-resistance model will be louder.
And if you just turn the volume knob to maximum and do not pay attention to quality (rattling from clipping), then the difference between the headphones will be 13 dB in favor of the low-impedance model.
If we look at the amplitudes, the current margin is less than 9 dB, then, accordingly, the maximum voltage level will remain at 0 dBV. In the example above, the real gain is 6 dB.
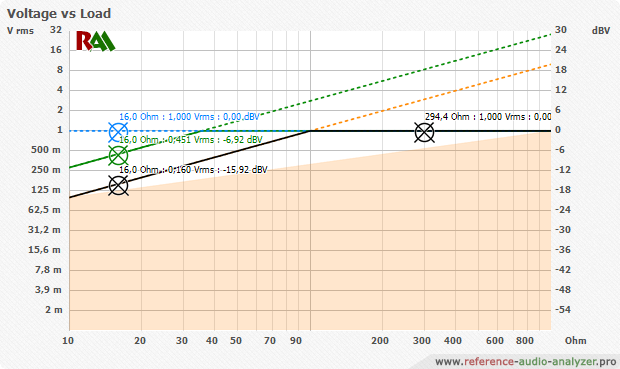
What happens if we compare amplifiers with the same output power?
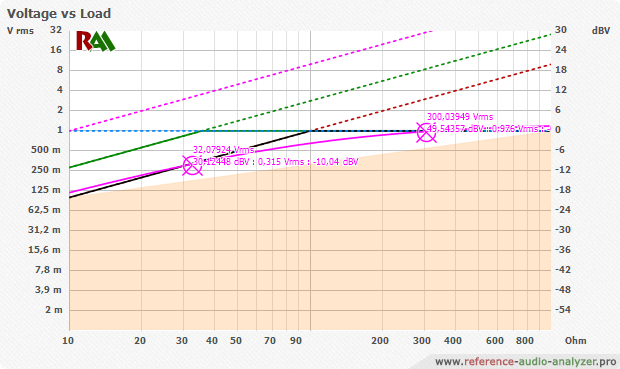
Add a second amplifier with a declared power of 3 mW at 32 ohms and 3.3 mW at 300 ohms. Our first amplifier in the example has exactly the same power of 32 and 300 ohms.
The second amplifier has a maximum voltage of 2.3 dBV (1.3 Vrms), an output impedance of 100 ohms and an output current of 100 mA. Due to non-zero resistance, the voltage limit is not a straight horizontal line, but is a curve with a decrease in voltage to the area of low-resistance load.
As you can see on the graph, the purple line intersects with black at 32 and 300 ohms. The current reserve is so large (purple dashed line) that it does not affect the maximum values.
The graph above shows that for the first amplifier for 32 Ohms there is a margin of 9 dB, since This allows maximum voltage value. For a second amplifier with a larger current margin, the maximum voltage does not allow obtaining the “musical” power more than that obtained for a sine.
Thus, formally, amplifiers have the same power, but in practice, the first amplifier with 32-ohm headphones will give the volume 9 dB higher with the same quality.
What global conclusions can be drawn from this? It is incorrect to compare amplifiers simply in terms of power, despite the fact that it is customary and more or less adequate for speakers.
The development of reports in the RAA has always been directed not at the maximum number of graphs, but at the possibility of comparing products. And when comparing getting practical answers, not abstract ones.
The operation of the power sensitivity and the power graph turned out to be less convenient for a quick comparison than, for example, a comparison of the voltage sensitivity and, accordingly, voltage graphs.
However, the voltage plot built along a sine was not accurate enough to compare the volume between amplifiers. As a result of the work, an improved voltage graph was added to the “musical” power. This graph has been added to reports and various online services and comparisons.
Comparison of graphs of power characteristics of amplifiers and determination of the required voltage level for headphones from the amplifier
Link
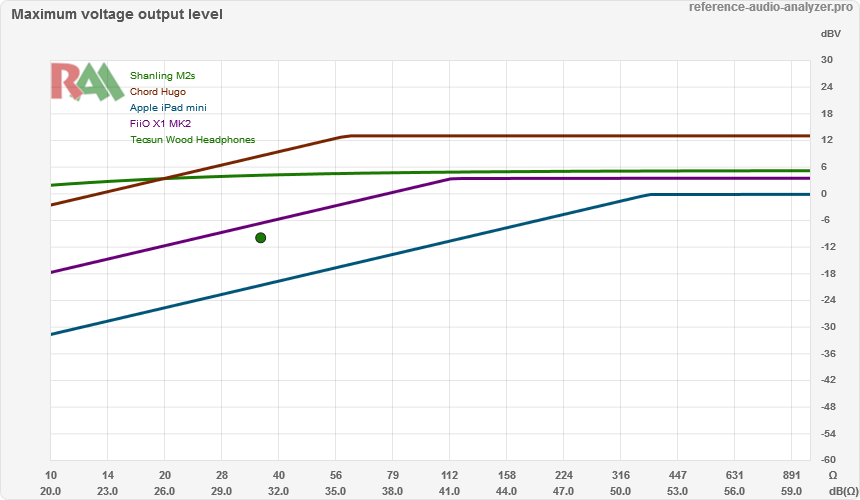
In this service, you can compare amplifiers by volume, and within certain quality classes. If we choose the equivalent class A, then this will be a comparison in the supposedly maximum quality of the amplifiers. And if you select “No current limit” - it will just be a comparison of the volume without quality.
By default, the signal energy density is set to 12 dB below the sine density. Typically, the density of a musical signal is different from 9 to 15 dB. If desired, you can specify a different density. If you select 3 dB and the “Point On” display, you will get a graph constructed sine with the original values.
To analyze the levels to a specific load, you can set the headphone impedance, and the additional table will contain the desired values in dBV.
This service has other interesting and useful algorithms, but they are beyond the scope of this topic.
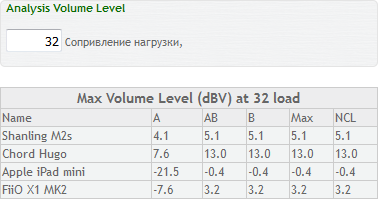
Comparison of the amplifying part of the volume
Link
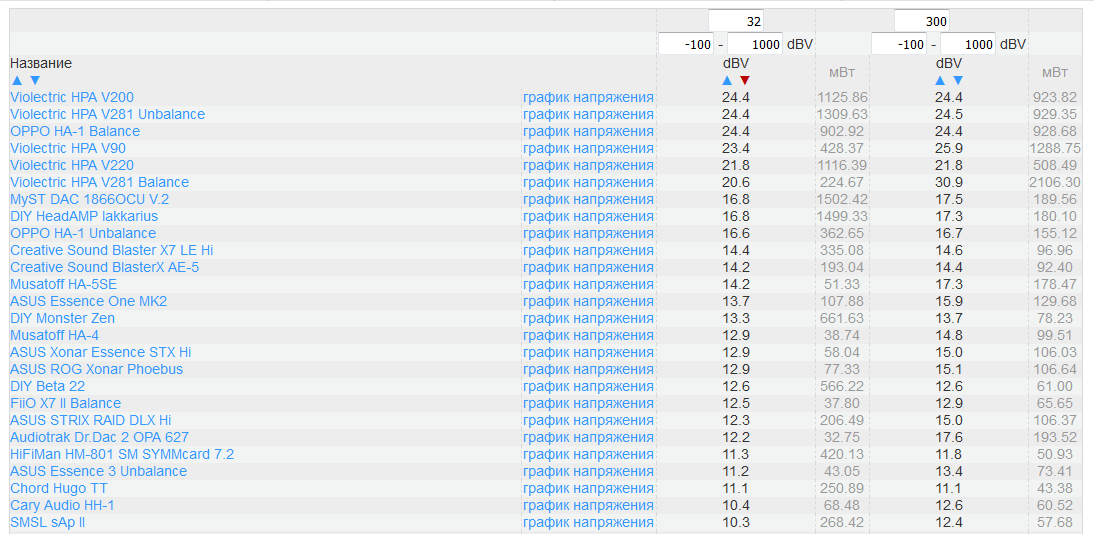
This is a simplified version in the form of a table where you can set two options for resistance and look at the amplitudes in dB. Similarly, you can choose the equivalent quality class. Additionally, the values in power for sine are given. When sorting, you can see that the power values can differ noticeably at the same voltage values due to the energy density of the signal.
Calculator for determining the basic characteristics of the amplifier
Undoubtedly, many will unwittingly have a question, but what about the comparison of those devices that were not measured in the RAA? How to calculate voltage and current? How to build a graph?
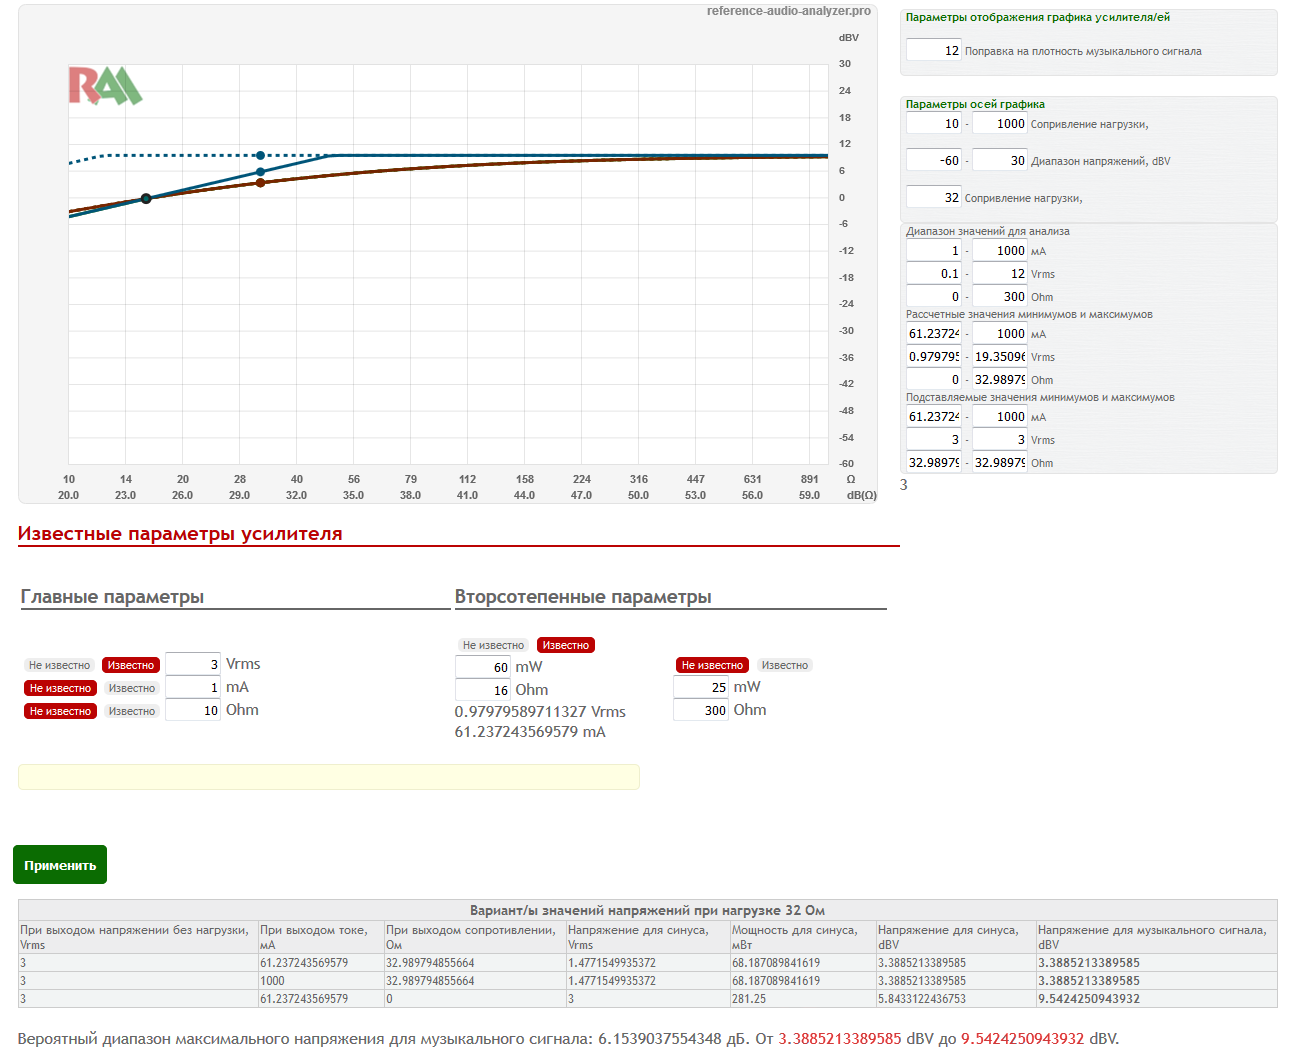
For this, a separate calculator is being prepared, into which it will be possible to enter known data about the device and obtain final values at the output.
The calculator is not simple, because sometimes data from manufacturers is incomplete and it is necessary to calculate the probable range of possible values. For example, the manufacturer can specify the power for a single load and the maximum voltage level without load. Without specifying the output resistance there may be several options for the graph. Different combinations of the indicated data are being worked out.
Total
For comparison, the amplifying part of the volume must take into account the energy density of the musical signal and separately the limits for current and voltage.
All Articles