メソッドの短い歴史
「著者は特別な式で認識できる」という短い出版物[1]で、科学誌New Journal of Physicsで、セバスチャン・ベルンハルトソン率いるUmeå大学のスウェーデンの物理学者グループが統計データを可能にする新しい方法を説明したことが報告されましたテキストの著者を特定します。 研究者は、3人の作家のテキスト-Thomas Hardy、Henry Melville、David Lawrence-がいわゆるZipf法をどのように実装しているかをチェックしました。 研究者は、テキストの量が増えるにつれて新しい単語が出現する頻度は著者によって異なることがわかり、このパターンは特定のテキストに依存せず、著者にのみ依存することを発見しました。
この投稿は2009年12月11日に公開され、20年以上前に、ジョンチャールズベイカー[2]は、著者の新しい単語を使用する能力を測定するユニットを導入しました(ここでは、「新しい」の概念は、このテキストでは以前に使用されていないと解釈されます)。 ジョンは、示されたユニットが著者の個人的な特性であることを証明しました。
定期刊行物およびネットでは、著者を決定するためのZipfの法律の実施に関する情報はありません。 したがって、私の研究はこの分野での最初の科学研究です。
完全なプログラムコード
#!/usr/bin/python # -*- coding: utf-8 -*- import nltk from nltk import * from nltk.corpus import brown stop_words= nltk.corpus.stopwords.words('english') import numpy as np import matplotlib.pyplot as plt import matplotlib as mpl mpl.rcParams['font.family'] = 'fantasy' mpl.rcParams['font.fantasy'] = 'Comic Sans MS, Arial' from nltk.stem import SnowballStemmer stop_symbols = '.,!?:;"-\n\r()' def comor_text(): # NLTK - stemmer = SnowballStemmer('english') # if len(txt.get(1.0,END))!=1 and len(txt1.get(1.0,END))!=1 and len(txt2.get(1.0,END))!=1: mrus=[txt.get(1.0,END),txt1.get(1.0,END),txt2.get(1.0,END)] mr=3 # elif len(txt.get(1.0,END))!=1 and len(txt1.get(1.0,END))!=1 and len(txt2.get(1.0,END))==1: mrus=[txt.get(1.0,END),txt1.get(1.0,END)] mr=2 elif len(txt.get(1.0,END))!=1 and len(txt1.get(1.0,END))==1 and len(txt2.get(1.0,END))==1: mrus=[txt.get(1.0,END)] mr=1 else: txt3.insert(END,"There are no all texts") return # , for text in mrus: v=([stemmer.stem(x) for x in [y.strip(stop_symbols) for y in text.lower().split()] if x and (x not in stop_words)]) # - my_dictionary=dict([]) z=[] for w in v: if w in my_dictionary: my_dictionary[w]+=1 else: my_dictionary[w]=1 max_count=int(txt5.get(1.0,END)) min_count=int(txt4.get(1.0,END)) if len(my_dictionary)<max_count: txt3.insert(END,"It is not enough of words for the analysis ") return # - my_dictionary_z=dict([]) for key,val in my_dictionary.items(): if val in my_dictionary_z: my_dictionary_z[val]+=1 else: my_dictionary_z[val]=1 z.append(val) z.sort(reverse=True) # e=z[ min_count:max_count] ee=[my_dictionary_z[val] for val in z][ min_count:max_count] ee=np.arange(len(my_dictionary))[ min_count:max_count] if text==mrus[0]: # -a,b + % zz=round((float(len(my_dictionary))*100)/(float(len(v))),0) tt=('In total of words (Text-1) --%i. New words --%i. Percen new words-- %i'%( len(v),len( my_dictionary),int(zz))) xData1 = ee yData1 = e z=[1/w for w in ee] z1=[(1/w)**2 for w in ee] t=[ round(e[i]/ee[i],4) for i in range(0,len(ee)) ] a=round((sum(e)*sum(z1)-sum(z)*sum(t))/(len(ee)*sum(z1)-sum(z)**2),3) b=round((len(ee)*sum(t)-sum(z)*sum(e))/(len(ee)*sum(z1)-sum(z)**2),3) y1=[round(a+b/w ,4) for w in ee] s=[round((y1[i]-e[i])**2,4) for i in range(0,len(ee))] sko=round(round((sum(s)/(len(ee)-1))**0.5,4)/(sum(y1)/len(ee)),4) tg='Factor --a '+str(a)+' Factor--b '+str(b)+' Mistake of approximation-- '+str(sko)+"%"+"\n"+tt txt3.delete(1.0, END) txt3.insert(END,tg) txt3.insert(END,'\n') y1Data1=y1 elif text==mrus[1]:# -a,b + % zz=round((float(len(my_dictionary))*100)/(float(len(v))),0) tt=('In total of words (Text-2) --%i. New words --%i. Percent new words-- %i'%( len(v),len( my_dictionary),int(zz))) xData2 = ee yData2=e z=[1/w for w in ee] z1=[(1/w)**2 for w in ee] t=[ round(e[i]/ee[i],4) for i in range(0,len(ee)) ] a=round((sum(e)*sum(z1)-sum(z)*sum(t))/(len(ee)*sum(z1)-sum(z)**2),3) b=round((len(ee)*sum(t)-sum(z)*sum(e))/(len(ee)*sum(z1)-sum(z)**2),3) y1=[round(a+b/w ,4) for w in ee] s=[round((y1[i]-e[i])**2,4) for i in range(0,len(ee))] sko=round(round((sum(s)/(len(ee)-1))**0.5,4)/(sum(y1)/len(ee)),4) tg='Factor --a '+str(a)+' Factor--b '+str(b)+' Mistake of approximation-- '+str(sko)+"%"+"\n"+tt txt3.insert(END,tg) txt3.insert(END,'\n') y1Data2=y1 elif text==mrus[2]:# -a,b + % zz=round((float(len(my_dictionary))*100)/(float(len(v))),0) tt=('In total of words (Text-3) --%i. New words --%i. Percent new words-- %i'%( len(v),len( my_dictionary),int(zz))) xData3 = ee yData3=e z=[1/w for w in ee] z1=[(1/w)**2 for w in ee] t=[ round(e[i]/ee[i],4) for i in range(0,len(ee)) ] a=round((sum(e)*sum(z1)-sum(z)*sum(t))/(len(ee)*sum(z1)-sum(z)**2),3) b=round((len(ee)*sum(t)-sum(z)*sum(e))/(len(ee)*sum(z1)-sum(z)**2),3) y1=[round(a+b/w ,4) for w in ee] s=[round((y1[i]-e[i])**2,4) for i in range(0,len(ee))] sko=round(round((sum(s)/(len(ee)-1))**0.5,4)/(sum(y1)/len(ee)),4) tg='Factor --a '+str(a)+' Factor--b '+str(b)+' Mistake of approximation-- '+str(sko)+"%"+"\n"+tt txt3.insert(END,tg) txt3.insert(END,'\n') y1Data3=y1 if mr==3: # + r12=round(sum([abs(yData1[i]-yData2[i]) for i in range(0,len(xData1))])/len(xData1),3) txt3.insert(END,"Average distances between art products of the author K--"+ str(r12)) txt3.insert(END,'\n') r13=round(sum([abs(yData1[i]-yData3[i]) for i in range(0,len(xData1))])/len(xData1),3) txt3.insert(END,"Average distance between art products of the authors K and M--"+ str(r13)) txt3.insert(END,'\n') plt.title('Distribution of frequencies of use of words in the text', size=14) plt.xlabel('Serial number of new words', size=14) plt.ylabel('Frequency of the use of new words', size=14) plt.plot(xData1, yData1, color='r', linestyle=' ', marker='o', label='Test art product of the author -') plt.plot(xData1, y1Data1, color='r',linewidth=2, label='Approximation of hyperbola y=(b/x)+a') plt.plot(xData2, yData2, color='g', linestyle=' ', marker='o', label='Comparable art product of the author -') plt.plot(xData2, y1Data2, color='g',linewidth=2, label='Approximation of hyperbola y=(b/x)+a') plt.plot(xData3, yData3, color='b', linestyle=' ', marker='o', label='Art product of the author -') plt.plot(xData3, y1Data3, color='b',linewidth=2, label='Approximation of hyperbola y=(b/x)+a') plt.legend(loc='best') plt.grid(True) plt.show() elif mr==2:# + r12=round(sum([abs(yData1[i]-yData2[i]) for i in range(0,len(xData1))])/len(xData1),3) txt3.insert(END,"Average distances between art products of the author K--"+ str(r12)) txt3.insert(END,'\n') plt.title('Distribution of frequencies of use of words in the text', size=14) plt.xlabel('Serial number of new words', size=14) plt.ylabel('Frequency of the use of new words', size=14) plt.plot(xData1, yData1, color='r', linestyle=' ', marker='o', label='Test art product of the author -') plt.plot(xData1, y1Data1, color='r',linewidth=2, label='Approximation of hyperbola y=(a/x)+b') plt.plot(xData2, yData2, color='g', linestyle=' ', marker='o', label='Comparable art product of the author -') plt.plot(xData2, y1Data2, color='g',linewidth=2, label='Approximation of hyperbola y=(a/x)+b') plt.legend(loc='best') plt.grid(True) plt.show() elif mr==1: # plt.title('Distribution of frequencies of use of words in the text', size=14) plt.xlabel('Serial number of new words', size=14) plt.ylabel('Frequency of the use of new words', size=14) plt.plot(xData1, yData1, color='r', linestyle=' ', marker='o', label='Test art product of the author -') plt.plot(xData1, y1Data1, color='r',linewidth=2, label='Approximation of hyperbola y=(a/x)+b') plt.grid(True) plt.show() def choice_text():# try: op = askopenfilename() f=open(op, 'r') st=f.read() f.close() if len(txt.get(1.0,END))==1: txt.insert(END,st) elif len(txt1.get(1.0,END))==1: txt1.insert(END,st) elif len(txt2.get(1.0,END))==1: txt2.insert(END,st) except: pass def array_text_1 ():# UNICODE if len(txt.get(1.0,END))!=1: u=txt.get(1.0,END) else: txt3.insert(END,"There are no text №1") return op=1 processing_subjects (u,op) def array_text_2 ():# UNICODE if len(txt1.get(1.0,END))!=1: u=txt1.get(1.0,END) else: txt3.insert(END,"There are no text №2") return op=2 processing_subjects (u,op) def array_text_3 ():# UNICODE if len(txt2.get(1.0,END))!=1: u=txt2.get(1.0,END) else: txt3.insert(END,"There are no text №3") return op=3 processing_subjects (u,op) def processing_subjects (u,op):# ( NLTK+corpusbrown) q= nltk.word_tokenize(u) qq=[w for w in q if len(w)>2] z=nltk.pos_tag(qq) m=[w[0].lower() for w in z if w[1]=="NN"] d={} for w in m: if w in d: d[w]+=1 else: d[w]=1 pairs = list(d.items()) pairs.sort(key=lambda x: x[1], reverse=True) modals=[] wq=10 for i in pairs[0:wq]: modals.append(i[0]) cfd = nltk.ConditionalFreqDist( (genre, word) for genre in brown.categories() for word in brown.words(categories=genre)) # genres=['news', 'editorial', 'reviews', 'religion', 'hobbies', 'lore', 'belles_lettres', 'government', 'learned', 'fiction', 'mystery', 'science_fiction', 'adventure', 'romance', 'humor'] sys.stdout = open('out.txt', 'w') cfd.tabulate(conditions=genres, samples=modals) sys.stdout.close()# f=open('out.txt', 'r') w=f.read() txt3.insert(END,w) f.close() sys.stdout = open('out.txt', 'w') cfd.tabulate(conditions=genres, samples=modals) sys.stdout.close() f=open('out.txt', 'r') b=0 u={} for i in f: b=b+1 if b>=2: d=i.split() c=d[1:len(d)] e=[int(w) for w in c] u[d[0]]=sum(e) for key, val in u.items(): if val == max(u.values()): tex="Text № -%i- Theme-- %s. Concurrences- %i"%(op,key,val) txt3.insert(END,tex) txt3.insert(END,'\n') f.close() cfd.plot(conditions=genres, samples=modals) def close_win(): tk.destroy() # tkinter + + + import tkinter as T from tkinter.filedialog import * import tkinter.filedialog import fileinput tk=T.Tk() tk.geometry('630x630') main_menu = Menu(tk) tk.config(menu=main_menu) file_menu = Menu(main_menu) main_menu.add_cascade(label="The comparative analysis of the art texts", menu=file_menu) file_menu.add_command(label="Choice of the texts", command=choice_text) file_menu.add_command(label="Definition of subjects of the text-1", command=array_text_1) file_menu.add_command(label="Definition of subjects of the text-2", command=array_text_2) file_menu.add_command(label="Definition of subjects of the text-3", command=array_text_3) file_menu.add_command(label="Definition of the author of the text", command=comor_text) file_menu.add_command(label="Exit from the program", command=close_win) lab =Label(tk, text="The text for comparison author -K ", font=("Arial", 12, "bold "),foreground='red') lab.pack() txt= Text(tk, width=66,height=5,font=("Arial", 12, "bold "),foreground='red',wrap=WORD) txt.pack() lab1 = Label(tk, text="The test author -K",font=("Arial", 12, "bold "),foreground='green') lab1.pack() txt1= Text(tk, width=66,height=5,font=("Arial", 12, "bold "),foreground='green',wrap=WORD) txt1.pack() lab2 = Label(tk, text="The text author-M", font=("Arial", 12, "bold "),foreground='blue') lab2.pack() txt2= Text(tk, width=66,height=5,font=("Arial", 12, "bold "),foreground='blue',wrap=WORD) txt2.pack() lab3 = Label(tk, text="Text results of comparison", font=("Arial", 12, "bold"),foreground='black') lab3.pack() txt3= Text(tk, width=66,height=6,font=("Arial", 12, "bold"),foreground='black',wrap=WORD) txt3.pack() lab4 = Label(tk, text="Minimum quantity of words in a window ", font=("Arial", 12, "bold"),foreground='black') lab4.pack() txt4= Text(tk, width=8,height=1,font=("Arial", 12, "bold"),foreground='black',wrap=WORD) wd=10 txt4.pack() txt4.insert(END,wd) lab5 = Label(tk, text="Maximum quantity of words in a window ", font=("Arial", 12, "bold"),foreground='black') lab5.pack() txt5= Text(tk, width=8,height=1,font=("Arial", 12, "bold"),foreground='black',wrap=WORD) wd=90 txt5.pack() txt5.insert(END,wd) tk.title('The analysis of the art text') x = (tk.winfo_screenwidth() - tk.winfo_reqwidth()) /4# y = (tk.winfo_screenheight() - tk.winfo_reqheight()) / 16# tk.wm_geometry("+%d+%d" % (x, y))# tk.mainloop()
私のプログラムが開発した機能:
- 各ドキュメントの最初と2番目のZipfの法則に従って個別に分析する可能性。
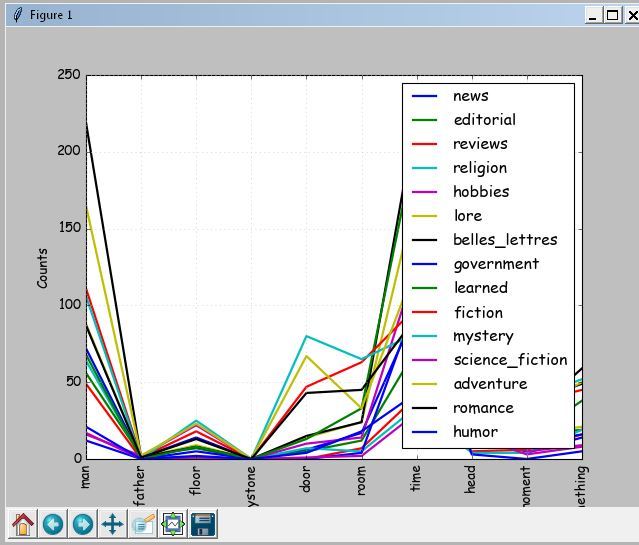
- 各ドキュメントのジャンルを個別に定義する機能(データストリームの再配布を伴う実装)。
- 分析プロセスでランクまたは単語の数のセクションを直接選択するための移動可能な動的ウィンドウ。
- グラフィックの実装による分析されたドキュメントのカラーマーキング。
- 分析プロセスでドキュメントに直接変更を加える機能(ドキュメントに識別できない文字がある場合)。
プログラムの成果をテストするために、有名な英語の作家の作品が使用されました。
ダン・ブラウン「ダヴィンチ・コード」と「天使と悪魔」とロバート・ラドラム「ボーンの識別」の作品の比較分析
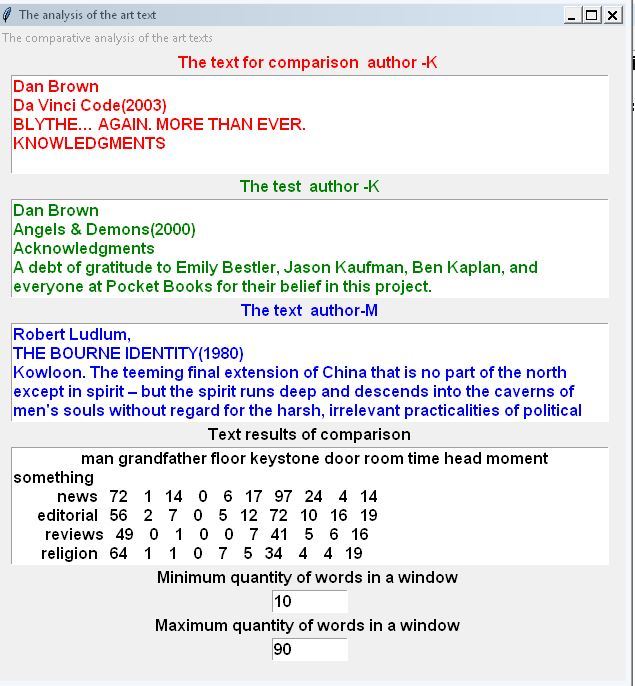
プログラムインターフェース
ダン・ブラウンとロバート・ラドラムの作品の原作者の比較分析の例。
結果の印刷

グラフ
フォームの最初の2つのフィールドでは、1人の著者の異なる作品を読み込み、3番目の著者では別の作品を読み込みます。
作品のジャンルを決定するために、作品のテキストからキー名詞またはモーダル動詞を選択します。 これらは、個々の単語またはフレーズのいずれかです。 特別にマークされたケースから(私はブラウンを使用しました)。 ジャンルは、選択した単語の最大出現回数によって決まります。
同じジャンルのすべてのテキストが著者の分析を開始できることを確認した後。 特定の問題を解決するため、たとえば技術テキストを分析するために、トピックの独自のベースを作成できます。

結果の印刷
Factor --a 91.184 Factor--b 2297.14 Mistake of approximation-- 0.0511% In total of words (Text-1) --81020. New words --11120. Percent new words-- 14 Factor --a 100.21 Factor--b 2869.22 Mistake of approximation-- 0.0965% In total of words (Text-2) --86079. New words --11868. Percent new words-- 14 Factor --a 154.162 Factor--b 4982.418 Mistake of approximation-- 0.0433% In total of words (Text-3) --128217. New words --10626. Percent new words-- 8 Average distances between art products of the author K--25.062 Average distance between art products of the authors K and M--138.25
比較するグラフ
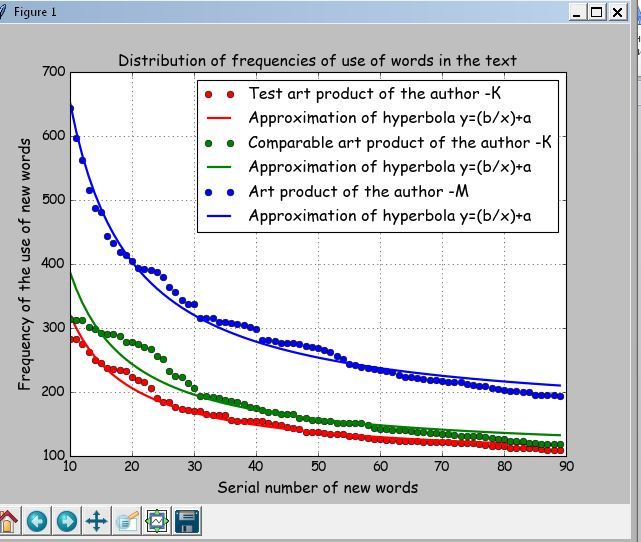
上記のリストとグラフから、著者の個人性は、K-緑と赤の曲線、M-青の曲線です。 著者Kの近似双曲線間の平均距離は25.062であり、著者Kの最初の作品と著者Mの作品間の平均距離は138.25です。
このプログラムは、2番目のZipfの法則─「量-頻度」[4]に従って、10から90までの単語数のフラグメントを作成します。 Zipfは、この頻度のテキストに含まれる頻度と単語の数も関連していることを発見しました。
特別な式
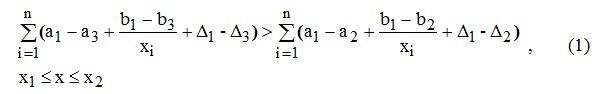
 ─著者Kの双曲線近似係数と近似誤差。
 ─著者Mの双曲線近似係数と近似誤差。
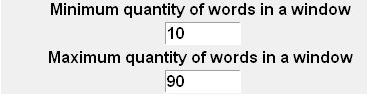
 ─単語数の範囲は、グラフの分析中にカスタマイズできます。
不等式(1)英語圏の著者による50のトリプル作品でテストしました。 統計情報がありません。 不等式(1)の妥当性を望む人は、自分の例でそれを検証できます。
おわりに
新しい単語の使用頻度によってテキストの著者を決定する方法のPythonでの実装が考慮されます。 3つのテキストの比較分析の公式が与えられます。そのうちの2つは1人の著者であり、3人目はもう1人です。 ダンブラウンとロバートラッドラムの作品の比較分析の例を示します。
参照資料
- 作家の作者は特別な公式によって認められます。
- JC Baker新しい単語が著者のテキストジャーナルに入る割合に基づいた著者のテスト1988年1月1日、文学および言語コンピューティング第3巻1ページ36〜39ページに掲載された記事。
- 統計の双曲線近似のためのシンプルなPythonプログラム
- Zipfの法則