そのため、さまざまな操作の速度を簡単にテストする独自のメカニズムを作成するというアイデアが生まれました。 アイデアは面白そうに見えたので、始まりが始まりました!
目標
将来の機器の目標を設定することから始めます。 私は、プロジェクトをあらゆる速度をテストするための普遍的なツールとして見たかった。 しかし
そのため、次のようなツールを入手する必要がありました。
- さまざまな機能の速度を比較します
- 事前に準備されたテストを使用する機能があります
- 読みやすい結果
- 結果を表示するための独自のテストとオプションを作成する機能があります
- 他のプラットフォームで簡単に使用できます
測定機構
関数の実行時間を測定するために、同様の方法を使用することが決定されました
protected function getTime($time = false) { return $time === false? microtime(true) : microtime(true) - $time; }
操作の原理は単純です。パラメーターなしで呼び出しが発生した場合、現在の時間状態を返し、時間パラメーターを使用して呼び出しが発生した場合、現在の時刻と送信された時刻の差が返されます。
ただし、時間の計算がある場合は、メモリの消費量もあるため、消費されたメモリを測定するための同様の方法が後で追加されました。
protected function getMemory($memory = false) { return $memory === false? memory_get_usage() : memory_get_usage() - $memory; }
このメカニズムは時間を測定するメカニズムに似ていますが、この場合にのみ、割り当てられたメモリの値がスクリプトに転送されます。
ご存じのように、一部の関数は入力データセットによって動作が異なるため、各テストでは、テスト関数の入力データの配列が定義されます。 最も正確な結果を得るために、各セットで機能テストが数回実行されます。 特に、テストは異なる順序で実行されます。
実験中、各テストの開始前の空きメモリの量が異なることに気づきましたが、ほとんどのテストではこれは重要ではありませんでしたが、すべてのテストまたはそれらに近い条件を同じ順序にしたいのです。 そのため、ローカルSQLiteストレージに結果のストレージを実装し、テストを開始する前に、1つの検証テストを実行して変数にデータを入力することが決定されました。
結果と独自のテストバージョンを表示するための独自のオプションを作成できるようにするために、2つの抽象化モデルが作成されます。 テストモデル(テスト)には、テスト機能を含む、テストに関するすべての情報が含まれます。 データ表示モデル(DataViwer)には、テスト結果を読み取り可能な形式に変換するためのメソッドが含まれています。 ビューを便利に表示するために、Twigテンプレートエンジンが使用され、ブートストラップスタイルライブラリが接続され、HighChartsグラフィックスを備えたビューアーも作成されました。
その結果、仕事のそのような一般的なメカニズム。 比較に必要な関数が取得され、異なるデータセットを使用して異なるシーケンスで実行するために実行されます。 この場合、各実行の時間が測定され、結果がストレージに記録されます。 このステップはテストモデルが担当します。 すべての測定後、結果はデータビュー(DataViwer)に転送され、そこで情報が処理および表示されます。
テスト実装
テストクラス
テストクラスの実装の簡単な例。たとえば、インクリメントの前およびインクリメント後の操作の速度をテストします。
テストクラスの例
class IncPrefVsPos extends TestAbstract { public $name = 'Speedy ++i vs i++'; public $valueTest = [100, 1000, 2000, 3000]; public $qntTest = 5; public $viewers = [TestCore::VIEWER_TLIST, TestCore::VIEWER_TGROUP, TestCore::VIEWER_TAVG, TestCore::VIEWER_GBUBLE]; public $functions = ['postIncrement' => 'testPost', 'prefIncrement' => 'testPref']; protected $strategy = [['testPost', 'testPref'], ['testPref', 'testPost']]; public function testPref($size) { $testCounter = 0; for($i=0;$i<$size;$i++) { ++$testCounter; ++$testCounter; ++$testCounter; ++$testCounter; ++$testCounter; ++$testCounter; ++$testCounter; ++$testCounter; ++$testCounter; ++$testCounter; ++$testCounter; ++$testCounter; ++$testCounter; ++$testCounter; ++$testCounter; ++$testCounter; ++$testCounter; ++$testCounter; ++$testCounter; ++$testCounter; ++$testCounter; ++$testCounter; ++$testCounter; ++$testCounter; } } public function testPost($size) { $testCounter = 0; for($i=0;$i<$size;$i++) { $testCounter++; $testCounter++; $testCounter++; $testCounter++; $testCounter++; $testCounter++; $testCounter++; $testCounter++; $testCounter++; $testCounter++; $testCounter++; $testCounter++; $testCounter++; $testCounter++; $testCounter++; $testCounter++; $testCounter++; $testCounter++; $testCounter++; $testCounter++; $testCounter++; $testCounter++; $testCounter++; $testCounter++; } } }
クラスは抽象クラスTestAbstractを継承する必要があります。このクラスには、データストリームを操作する基本的な仕組みが含まれています。
$ name-テストの名前を設定します。これは、DataViewerに出力するときに使用できます。
$ valueTest-テストのサンプルサイズ、値の配列。テストの関数がそれぞれ実行されます。 したがって、テスト対象の各関数は、必ず1つのパラメーターを取る必要があります。 数値、文字列、配列のどれでも重要ではありません。すべては特定のケースに依存します。 この例では、増分で実行される操作の量を示す十分な数があります。
$ qntTest-各サンプルサイズがテストされる回数を示します。
$ viewers-レポートがレンダリングされるときに生成されるデータ表現の配列。 これは実際には、ViewrAbstract抽象クラスから継承する完全修飾クラス名のセットです。 準備済みのビューアは、TestCoreクラスの定数でレンダリングされます。
$ functions-テストで使用される関数名の配列。 配列のキーは、結果に表示される名前です。
$ strategy-テスト戦略の配列。各戦略は、関数名のシーケンスを含む配列で表される必要があります。 この例は、直接シーケンスと逆の2つの戦略を示しています。
前述のように、関数自体は同じ値をとる必要があります。 この例では、これを実行された増分シリーズ操作の数と見なします。
その結果、各サンプルサイズ([100、1000、2000、3000])で各テスト戦略が5回テストされる一連のテストを取得します。
データ提示クラス
それでは、簡単なデータプレゼンテーションクラスを詳しく見てみましょう。
クラス例を見る
class TableList extends ViewerAbstract { public $view = 'tableList.php'; public function generateData($data){ return $data; } public function run($data) { $data = $this->generateData($data); return App::render('/viewer/'.$this->view, compact('data')); } public static function model($class = __CLASS__) { return parent::model($class); } }
このクラスは、抽象クラスViewerAbstractを実装します。
$ view-ビューの名前を含みます。これはデフォルトでfolder / views / viewersになります
function generateData($ data) -テスト結果の配列を処理するためのメソッド。 デフォルトでは、結果は指定されたビューのデータパラメータに渡されます。
function run($ data)は実装のためのオプションのメソッドですが、データ表現へのパスを変更する必要がある場合は、再定義する必要があります。
public static function model($ class = __CLASS__) -静的メソッド呼び出しをサポートするためのメソッド
ユースケース
テスト機能を使用するために、2つの主要なメソッドが作成されました。
テスト起動方法
function test($test, $params = [], $onlyData = false)
$ testは、実行するテストの完全な名前です。 それらは、独自のテストオプションとして関与するか、事前に準備することができます。
$ params-テストを実行するパラメーターの配列。 このパラメーターを使用して、テストパラメーターを正確に変更できます。
$ onlyData-結果セットまたはレンダリングされたビューの出力を担当するパラメーター。
機能比較方法
追加のクラスを作成せずにカスタム関数を比較する方法
function compare($func = [], $params = [], $onlyData = false)
$ func-匿名関数の配列。配列のキーは、テスト結果の関数の名前です。
$ params-テストメソッドのパラメーターに類似したテストパラメーターの配列。
$ onlyData-テストメソッドのパラメータにも似ており、出力オプションを担当します。
作業例
最も簡単で最速のユースケースは、事前に準備されたテストを使用することです。 すべての準備されたテストは、Speedyクラスの定数で実行されます。
print Speedy::test(Speedy::PHP_SOF_VS_COUNT);
ユーザー定義関数を比較するには、匿名関数を作成し、Speedy :: compareメソッドを呼び出す必要があります
関数比較の例
$pref = function($size) { $testCounter = 0; for($i=0;$i<$size;$i++) { ++$testCounter; ++$testCounter; ++$testCounter; ++$testCounter; ++$testCounter; ++$testCounter; ++$testCounter; ++$testCounter; ++$testCounter; ++$testCounter; ++$testCounter; ++$testCounter; ++$testCounter; ++$testCounter; ++$testCounter; ++$testCounter; ++$testCounter; ++$testCounter; ++$testCounter; ++$testCounter; ++$testCounter; ++$testCounter; ++$testCounter; ++$testCounter; } }; $post = function($size) { $testCounter = 0; for($i=0;$i<$size;$i++) { $testCounter++; $testCounter++; $testCounter++; $testCounter++; $testCounter++; $testCounter++; $testCounter++; $testCounter++; $testCounter++; $testCounter++; $testCounter++; $testCounter++; $testCounter++; $testCounter++; $testCounter++; $testCounter++; $testCounter++; $testCounter++; $testCounter++; $testCounter++; $testCounter++; $testCounter++; $testCounter++; $testCounter++; } }; print \speedy\Speedy::compare(['pref' => $pref, 'post' => $post]);
試験結果
現在のテスト結果は、4つのビューで表示できます。
VIEWER_TLIST
行われたすべての時間測定のリストの表形式でのプレゼンテーション。 実際、これは、変換なしのリポジトリからのすべてのレコードの出力です。 データセットには、テストされた関数の名前、費やされた時間、サンプルサイズ、使用されたメモリサイズ、テストとコメントが実行されたバッチ番号に関する情報が含まれています。 コメントは、この機能のテストが実行された戦略を示しています。
リストを表形式で出力する例
インクリメント演算子のテスト結果。
| お名前 | 時間 | サイズ | 記憶 | 一部 | コメント |
| postInc | 0.000650882720947 | 100 | 48 | 2 | postInc-prefInc |
| prefInc | 0.000411987304688 | 100 | 48 | 2 | postInc-prefInc |
| prefInc | 0.000406980514526 | 100 | 48 | 3 | prefInc-postInc |
| postInc | 0.000549077987671 | 100 | 48 | 3 | prefInc-postInc |
| postInc | 0.000330924987793 | 100 | 48 | 5 | postInc-prefInc |
| prefInc | 0.000287055969238 | 100 | 48 | 5 | postInc-prefInc |
| prefInc | 0.00043797492981 | 100 | 48 | 6 | prefInc-postInc |
| postInc | 0.000365018844604 | 100 | 48 | 6 | prefInc-postInc |
| postInc | 0.000295162200928 | 100 | 48 | 8 | postInc-prefInc |
| prefInc | 0.000373125076294 | 100 | 48 | 8 | postInc-prefInc |
| prefInc | 0.000263929367065 | 100 | 48 | 9 | prefInc-postInc |
| postInc | 0.000449895858765 | 100 | 48 | 9 | prefInc-postInc |
| postInc | 0.00030517578125 | 100 | 48 | 11 | postInc-prefInc |
| prefInc | 0.000247955322266 | 100 | 48 | 11 | postInc-prefInc |
| prefInc | 0.000244140625 | 100 | 48 | 12 | prefInc-postInc |
| postInc | 0.000265121459961 | 100 | 48 | 12 | prefInc-postInc |
| postInc | 0.000267028808594 | 100 | 48 | 14 | postInc-prefInc |
| prefInc | 0.000245094299316 | 100 | 48 | 14 | postInc-prefInc |
| prefInc | 0.000285148620605 | 100 | 48 | 15 | prefInc-postInc |
| postInc | 0.000273942947388 | 100 | 48 | 15 | prefInc-postInc |
| postInc | 0.00273203849792 | 1000 | 48 | 17 | postInc-prefInc |
| prefInc | 0.00240206718445 | 1000 | 48 | 17 | postInc-prefInc |
| prefInc | 0.00274896621704 | 1000 | 48 | 18 | prefInc-postInc |
| postInc | 0.00259804725647 | 1000 | 48 | 18 | prefInc-postInc |
| postInc | 0.00391817092896 | 1000 | 48 | 20 | postInc-prefInc |
| prefInc | 0.00303602218628 | 1000 | 48 | 20 | postInc-prefInc |
| prefInc | 0.00229096412659 | 1000 | 48 | 21 | prefInc-postInc |
| postInc | 0.00281691551208 | 1000 | 48 | 21 | prefInc-postInc |
| postInc | 0.00273108482361 | 1000 | 48 | 23 | postInc-prefInc |
| prefInc | 0.00221014022827 | 1000 | 48 | 23 | postInc-prefInc |
| prefInc | 0.00266814231873 | 1000 | 48 | 24 | prefInc-postInc |
| postInc | 0.00307106971741 | 1000 | 48 | 24 | prefInc-postInc |
| postInc | 0.00283098220825 | 1000 | 48 | 26 | postInc-prefInc |
| prefInc | 0.00239992141724 | 1000 | 48 | 26 | postInc-prefInc |
| prefInc | 0.00246214866638 | 1000 | 48 | 27 | prefInc-postInc |
| postInc | 0.00273704528809 | 1000 | 48 | 27 | prefInc-postInc |
| postInc | 0.00283288955688 | 1000 | 48 | 29日 | postInc-prefInc |
| prefInc | 0.00229215621948 | 1000 | 48 | 29日 | postInc-prefInc |
| prefInc | 0.00220608711243 | 1000 | 48 | 30 | prefInc-postInc |
| postInc | 0.0028657913208 | 1000 | 48 | 30 | prefInc-postInc |
| postInc | 0.00557017326355 | 2000年 | 48 | 32 | postInc-prefInc |
| prefInc | 0.0048840045929 | 2000年 | 48 | 32 | postInc-prefInc |
| prefInc | 0.00449013710022 | 2000年 | 48 | 33 | prefInc-postInc |
| postInc | 0.0064799785614 | 2000年 | 48 | 33 | prefInc-postInc |
| postInc | 0.00543594360352 | 2000年 | 48 | 35 | postInc-prefInc |
| prefInc | 0.00509881973267 | 2000年 | 48 | 35 | postInc-prefInc |
| prefInc | 0.00483298301697 | 2000年 | 48 | 36 | prefInc-postInc |
| postInc | 0.00555992126465 | 2000年 | 48 | 36 | prefInc-postInc |
| postInc | 0.00516104698181 | 2000年 | 48 | 38 | postInc-prefInc |
| prefInc | 0.00512599945068 | 2000年 | 48 | 38 | postInc-prefInc |
| prefInc | 0.00484395027161 | 2000年 | 48 | 39 | prefInc-postInc |
| postInc | 0.00530505180359 | 2000年 | 48 | 39 | prefInc-postInc |
| postInc | 0.00509691238403 | 2000年 | 48 | 41 | postInc-prefInc |
| prefInc | 0.00525093078613 | 2000年 | 48 | 41 | postInc-prefInc |
| prefInc | 0.00447416305542 | 2000年 | 48 | 42 | prefInc-postInc |
| postInc | 0.00536584854126 | 2000年 | 48 | 42 | prefInc-postInc |
| postInc | 0.0054669380188 | 2000年 | 48 | 44 | postInc-prefInc |
| prefInc | 0.00468182563782 | 2000年 | 48 | 44 | postInc-prefInc |
| prefInc | 0.00512504577637 | 2000年 | 48 | 45 | prefInc-postInc |
| postInc | 0.00545692443848 | 2000年 | 48 | 45 | prefInc-postInc |
| postInc | 0.00782418251038 | 3000 | 48 | 47 | postInc-prefInc |
| prefInc | 0.00726389884949 | 3000 | 48 | 47 | postInc-prefInc |
| prefInc | 0.00674796104431 | 3000 | 48 | 48 | prefInc-postInc |
| postInc | 0.007483959198 | 3000 | 48 | 48 | prefInc-postInc |
| postInc | 0.00781297683716 | 3000 | 48 | 50 | postInc-prefInc |
| prefInc | 0.0069580078125 | 3000 | 48 | 50 | postInc-prefInc |
| prefInc | 0.00711393356323 | 3000 | 48 | 51 | prefInc-postInc |
| postInc | 0.0072808265686 | 3000 | 48 | 51 | prefInc-postInc |
| postInc | 0.00790119171143 | 3000 | 48 | 53 | postInc-prefInc |
| prefInc | 0.00662994384766 | 3000 | 48 | 53 | postInc-prefInc |
| prefInc | 0.00825595855713 | 3000 | 48 | 54 | prefInc-postInc |
| postInc | 0.00739097595215 | 3000 | 48 | 54 | prefInc-postInc |
| postInc | 0.00811100006104 | 3000 | 48 | 56 | postInc-prefInc |
| prefInc | 0.00712990760803 | 3000 | 48 | 56 | postInc-prefInc |
| prefInc | 0.00698399543762 | 3000 | 48 | 57 | prefInc-postInc |
| postInc | 0.00758218765259 | 3000 | 48 | 57 | prefInc-postInc |
| postInc | 0.00795316696167 | 3000 | 48 | 59 | postInc-prefInc |
| prefInc | 0.00725698471069 | 3000 | 48 | 59 | postInc-prefInc |
| prefInc | 0.00684094429016 | 3000 | 48 | 60 | prefInc-postInc |
| postInc | 0.00778198242188 | 3000 | 48 | 60 | prefInc-postInc |
VIEWER_TGROUP
テストバッチのグループ化されたデータの形式で表形式で表示(戦略ごとのパス番号による)、つまり 1行に、1つの戦略の一部として、および単一のテストパスの一部として実行されたテスト機能の結果があります。
テーブルの列には、サンプルサイズ、実行時間、最悪の結果からの速度の割合、使用メモリ、コメント、現在のパスで時間的に勝った関数の名前に関するデータが表示されます。 また、パーセンテージの列を明確にしたいと思います。 この値は、関数が最も遅い関数よりも進んでいる時間の割合として計算されます。 値が設定されていない場合、この関数は実行時のパッセージのアウトサイダーです。
グループ化された結果の表形式での出力の例
インクリメント演算子のテスト結果。
| サイズ | postInc | prefInc | コメント | タイムウィン | ||||
| 時間 | % | 記憶 | 時間 | % | 記憶 | |||
| 100 | 0.000650882720947 | 48 | 0.000411987304688 | 36.7 | 48 | postInc-prefInc | prefInc | |
| 100 | 0.000549077987671 | 48 | 0.000406980514526 | 25.88 | 48 | prefInc-postInc | prefInc | |
| 100 | 0.000330924987793 | 48 | 0.000287055969238 | 13.26 | 48 | postInc-prefInc | prefInc | |
| 100 | 0.000365018844604 | 16.66 | 48 | 0.00043797492981 | 48 | prefInc-postInc | postInc | |
| 100 | 0.000295162200928 | 20.89 | 48 | 0.000373125076294 | 48 | postInc-prefInc | postInc | |
| 100 | 0.000449895858765 | 48 | 0.000263929367065 | 41.34 | 48 | prefInc-postInc | prefInc | |
| 100 | 0.00030517578125 | 48 | 0.000247955322266 | 18.75 | 48 | postInc-prefInc | prefInc | |
| 100 | 0.000265121459961 | 48 | 0.000244140625 | 7.91 | 48 | prefInc-postInc | prefInc | |
| 100 | 0.000267028808594 | 48 | 0.000245094299316 | 8.21 | 48 | postInc-prefInc | prefInc | |
| 100 | 0.000273942947388 | 3.93 | 48 | 0.000285148620605 | 48 | prefInc-postInc | postInc | |
| 1000 | 0.00273203849792 | 48 | 0.00240206718445 | 12.08 | 48 | postInc-prefInc | prefInc | |
| 1000 | 0.00259804725647 | 5.49 | 48 | 0.00274896621704 | 48 | prefInc-postInc | postInc | |
| 1000 | 0.00391817092896 | 48 | 0.00303602218628 | 22.51 | 48 | postInc-prefInc | prefInc | |
| 1000 | 0.00281691551208 | 48 | 0.00229096412659 | 18.67 | 48 | prefInc-postInc | prefInc | |
| 1000 | 0.00273108482361 | 48 | 0.00221014022827 | 07/19 | 48 | postInc-prefInc | prefInc | |
| 1000 | 0.00307106971741 | 48 | 0.00266814231873 | 12/13 | 48 | prefInc-postInc | prefInc | |
| 1000 | 0.00283098220825 | 48 | 0.00239992141724 | 15.23 | 48 | postInc-prefInc | prefInc | |
| 1000 | 0.00273704528809 | 48 | 0.00246214866638 | 10.04 | 48 | prefInc-postInc | prefInc | |
| 1000 | 0.00283288955688 | 48 | 0.00229215621948 | 09/19 | 48 | postInc-prefInc | prefInc | |
| 1000 | 0.0028657913208 | 48 | 0.00220608711243 | 02/23 | 48 | prefInc-postInc | prefInc | |
| 2000年 | 0.00557017326355 | 48 | 0.0048840045929 | 12.32 | 48 | postInc-prefInc | prefInc | |
| 2000年 | 0.0064799785614 | 48 | 0.00449013710022 | 30.71 | 48 | prefInc-postInc | prefInc | |
| 2000年 | 0.00543594360352 | 48 | 0.00509881973267 | 6.2 | 48 | postInc-prefInc | prefInc | |
| 2000年 | 0.00555992126465 | 48 | 0.00483298301697 | 07/13 | 48 | prefInc-postInc | prefInc | |
| 2000年 | 0.00516104698181 | 48 | 0.00512599945068 | 0.68 | 48 | postInc-prefInc | prefInc | |
| 2000年 | 0.00530505180359 | 48 | 0.00484395027161 | 8.69 | 48 | prefInc-postInc | prefInc | |
| 2000年 | 0.00509691238403 | 2.93 | 48 | 0.00525093078613 | 48 | postInc-prefInc | postInc | |
| 2000年 | 0.00536584854126 | 48 | 0.00447416305542 | 16.62 | 48 | prefInc-postInc | prefInc | |
| 2000年 | 0.0054669380188 | 48 | 0.00468182563782 | 14.36 | 48 | postInc-prefInc | prefInc | |
| 2000年 | 0.00545692443848 | 48 | 0.00512504577637 | 6.08 | 48 | prefInc-postInc | prefInc | |
| 3000 | 0.00782418251038 | 48 | 0.00726389884949 | 7.16 | 48 | postInc-prefInc | prefInc | |
| 3000 | 0.007483959198 | 48 | 0.00674796104431 | 9.83 | 48 | prefInc-postInc | prefInc | |
| 3000 | 0.00781297683716 | 48 | 0.0069580078125 | 10.94 | 48 | postInc-prefInc | prefInc | |
| 3000 | 0.0072808265686 | 48 | 0.00711393356323 | 2.29 | 48 | prefInc-postInc | prefInc | |
| 3000 | 0.00790119171143 | 48 | 0.00662994384766 | 09/16 | 48 | postInc-prefInc | prefInc | |
| 3000 | 0.00739097595215 | 10.48 | 48 | 0.00825595855713 | 48 | prefInc-postInc | postInc | |
| 3000 | 0.00811100006104 | 48 | 0.00712990760803 | 12.1 | 48 | postInc-prefInc | prefInc | |
| 3000 | 0.00758218765259 | 48 | 0.00698399543762 | 7.89 | 48 | prefInc-postInc | prefInc | |
| 3000 | 0.00795316696167 | 48 | 0.00725698471069 | 8.75 | 48 | postInc-prefInc | prefInc | |
| 3000 | 0.00778198242188 | 48 | 0.00684094429016 | 12.09 | 48 | prefInc-postInc | prefInc | |
VIEWER_TAVG
サンプルサイズごとの平均指標の形式で表形式で表示、つまり 1行に、1つのサンプルの関数の平均パフォーマンステストがあります。
列は、サンプル内の関数の勝利数、勝利の平均時間の割合、勝った関数の名前に関する情報を提供します。 Functions-winner-サンプルの勝利数によって決定されます。
表形式の平均結果の例
インクリメント演算子のテスト結果。
| サイズ | postInc | prefInc | 勝者 | ||
| 勝つ | % | 勝つ | % | ||
| 100 | 3 | 13.83 | 7 | 21.72 | prefInc |
| 1000 | 1 | 5.49 | 9 | 16.98 | prefInc |
| 2000年 | 1 | 2.93 | 9 | 12.08 | prefInc |
| 3000 | 1 | 10.48 | 9 | 9.68 | prefInc |
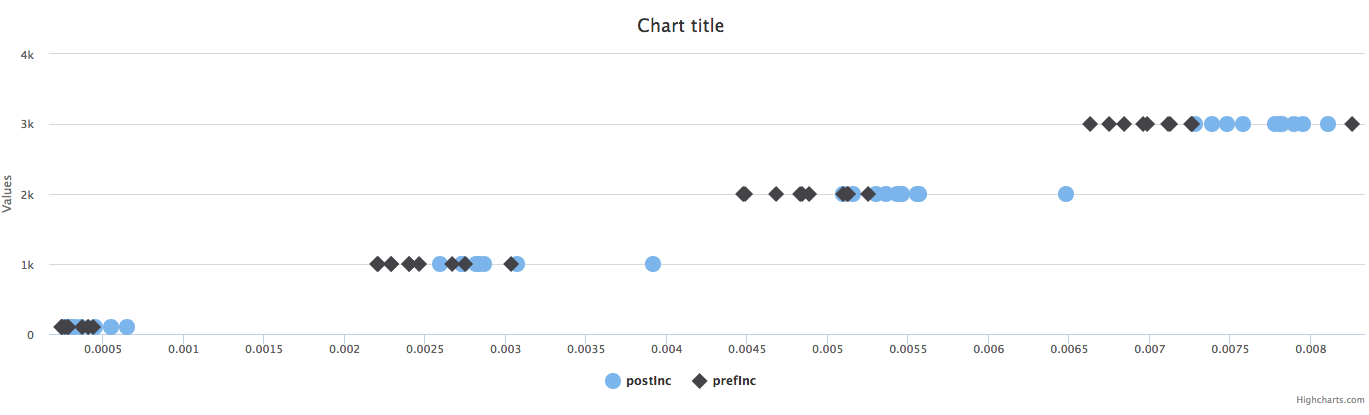
VIEWER_GBUBLE
ポイントのセットとしてのグラフ形式での表現。各ポイントは時間値とサンプルサイズに対応します。 このビューは、HighChartsチャートを使用して実装されます。
グラフィック出力の例
インクリメント演算子のテスト結果。
まとめ
設定した目標が達成されたことを要約したいと思います。 しかし、もちろんやるべきことがまだあります。 計画には、例外処理の作業、列のセットの設定を変更する機能の追加、列の独自の名前を設定する機能の追加が含まれ、テストの数が増えます。 また、データベースの操作速度を便利にテストする機能を追加したいと思います。
プロジェクトのソースコードはここで表示できます。
PS :このプロジェクトは、このトピックに対する個人的な関心の一部として開発されており、その種の最高のものであるとは主張していません。 誰かがこの作品を気に入ってくれると嬉しいですし、役に立つでしょう。 建設的な批判とアドバイスを歓迎します。