はじめに
こんにちは
最初の投稿では、 logmanなどのユーティリティを使用した経験を共有したいと思います。このユーティリティを使用すると、Windowsのアプリケーションによるリソース消費に関する情報を収集できます。
仕事のある日、タスクは単一のWindowsアプリケーションのパフォーマンスメトリックを削除することでした。 主な条件は、少なくともいくつかのサードパーティのユーティリティを使用することでした。そして、そのようなことは私がその時に経験していなかったので、少し掘り下げた後、選択はlogmanに委ねられました。 特別な正確さは要求されず、アプリケーションによるリソース消費の性質を理解することだけが必要でした。そのため、logmanは一見非常に適していました。
それでは、投稿の本質に直接行きましょう。
logmanとは何ですか?
ほとんどの場合、ほとんどの場合、職場または自宅で、ネイティブのWindowsユーティリティパフォーマンスモニター(perfmon)を使用しました。 そのため、logmanはおおよそperfmonのコマンドライン表現です。 パフォーマンスカウンターの作成、開始、停止、結果の外部ファイルへの書き込みなどを行うことができます。 基本的な機能だけが必要でした。これについては以下で説明します。
基本操作
注意点:次の操作を実行するには、管理者権限が必要です。そうしないと、このようなエラーが発生する可能性があります。
: . , .
作成および実行中のカウンターを表示する
logman
コマンドを使用して、データコレクターのリストを表示できます。
その結果、およそ次の結論が得られます。
------------------------------------------------------------------------------- cpu .
パフォーマンスカウンターの作成
カウンターを作成するために、次のコマンドを使用しました(オプションの完全なリストは公式ドキュメントにあります)。
logman create counter "counter_name" -f csv -si "interval" --v -o "output_file" -c counter
- counter_nameは、カウンターの名前です。 たとえば、「explorer_cpu」など、何でもかまいません
- -f-測定結果を含むファイル形式
- --v-このオプションは、出力ファイルのバージョン出力を抑制します
- -siは間隔です。 測定の記録に使用する
- -o-測定結果のファイル
- -c-パフォーマンスカウンター識別子
最後のオプションについて説明します。 「カウンター」フィールドに入力する内容を理解するには、perfmonに進み、データコレクターのグループを作成して、「作成->データコレクター」を選択します。 次に、「カウンターの追加」を選択し、表示されるウィンドウで興味のあるカウンターのタイプを見つけます。
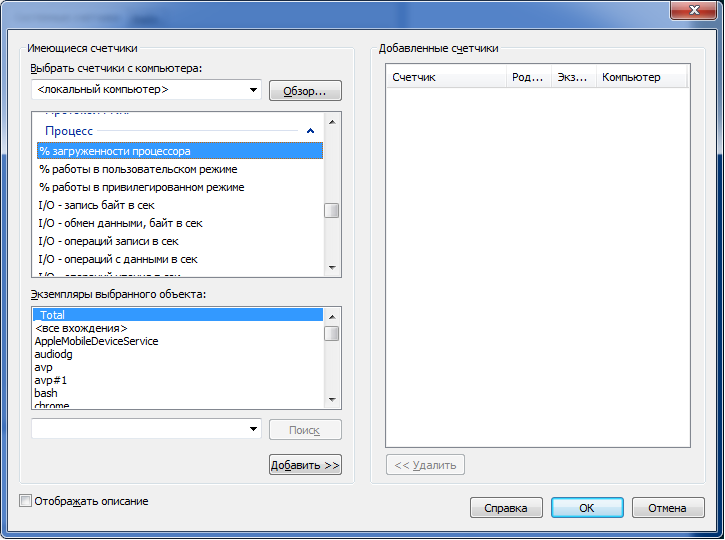
特定のプロセスによるCPUとメモリの消費に興味があったので、測定に次のカウンターを使用しました( 次の投稿はCPUの計算に役立ちました)。
- 「\プロセッサー(_Total)\%ユーザー時間」-ユーザーモードのCPUの割合
- 「\プロセス(application_name)\%プロセッサ時間」-ユーザーモードからのアプリケーションCPUの共有
- 「\プロセス(application_name)\ワーキングセット」-プロセスのメモリ使用量
プロセスによるCPU消費の割合は、( "\ Processor(_Total)\%User time" * "\ Process(application_name)\%Processor time")/(プロセッサ数* 100)として計算できます。
カウンターはスペースを使用して書き込むことができ、出力ファイルでは値はそれぞれ独自の列になります。
その結果、カウンターを作成するための既製のコマンドの例を示します。
logman create counter "explorer-cpu.usage" -f csv -si 1 --v -o "d:\logman-test\raw\explorer-cpu.usage.csv" -c "\Processor(_Total)\% User time" "\Process(explorer)\% Processor time"
カウンターの開始と停止
適切なコマンドによって実行されます。
logman start "counter_name"
logman stop "counter_name"
カウンターを削除
次のコマンドでカウンターを削除できます(この前に停止する必要があります)。
logman delete "counter_name"
Pythonラッパー
コードに移る前に、メトリックの収集中に発生した小さな問題(私にとってはかなり重要になりましたが)についてお話ししたいと思います。
かなり短い期間(5〜15秒)データを収集することになっていたため、1秒(-siオプションで指定)の収集間隔が長すぎることが明らかになりました。 インターネットおよびオフィスでの検索。 ドキュメンテーションでは、この間隔を短縮する方法を見つけることができず、グラフで受信したポイントの数を本当に増やしたいと思っていました。 少し熟考した後、私は反対に行くことにしました-間隔を短くできない場合は、カウンターの数を増やすことができます。 したがって、100〜500ミリ秒の間隔で複数のコレクタを連続して実行すると、1秒間に必要なデータ量を取得できます。
データ収集プロセスを既存の自動テストに統合する必要があり、最終的に、上記のすべてのステップを完了するために小さなヘルパーラッパーが作成されました。
以下は、指定されたアプリケーションのCPUおよびRAMのデータを必要な精度で収集するモジュールのソースコードです。
pylogman.py
import os import logging import random import time import subprocess import glob import multiprocessing CPU_USER_COUNTER = '"\Processor(_Total)\% User time"' CPU_APP_COUNTER = '"\Process({app})\% Processor time"' MEMORY_COUNTER = '"\Process({app})\Working Set"' APP_PLACEHOLDER = '{app}' class PerflogManager(object): def __init__(self, app_name, precision, results_dir, max_mem=1, interval=1): """ Args: app_name: name of the application without "exe" extention precision: amount of results_dir: output folder max_mem: this value is used to calculate % from total avaliable memory for further plotting interval: interval which will be used as "-si" logman option value """ self._app_name = app_name self._precision = precision self._counters = { 'cpu.usage': '{cpu_user} {cpu_app}'.format(cpu_user=CPU_USER_COUNTER, cpu_app=CPU_APP_COUNTER).replace(APP_PLACEHOLDER, app_name), 'mem.usage': MEMORY_COUNTER.replace(APP_PLACEHOLDER, app_name) } self._results_dir = os.path.normpath(results_dir) self._raw_dir = os.path.join(self._results_dir, 'raw') self._final_dir = os.path.join(self._results_dir, 'csv') self._interval = interval self._max_mem = max_mem self._collectors = [] if not os.path.exists(self._results_dir): os.makedirs(self._results_dir) os.makedirs(self._raw_dir) os.makedirs(self._final_dir) logging.info('Directory "{path}" for logman results has been created.'.format(path=self._results_dir)) logging.info('Performance logman manager has been created for "{}" application.'.format(self._app_name)) def init_collectors(self): """ Creates collectors by "logman create" command """ logging.info('Creating collectors set...') for lang in self._counters: for idx in range(self._precision): collector = '{app}-{collector}-{id}'.format(app=self._app_name, collector=lang, id=idx) output = os.path.join(self._raw_dir, collector + '.csv') self.__create(collector, self._counters[lang], output) self._collectors.append(collector) def start_all(self): """ Starts all the collectors from self._collectors list """ for collector in self._collectors: self.__start(collector) time.sleep(random.uniform(0.1, 0.9)) def stop_all(self): """ Stops and deletes all initiated collectors from self._collectors list """ for collector in self._collectors: self.__stop(collector) self.__delete(collector) def cleanup(self): """ Cleans raw_dir directory which contains unprocessed csv file from logman """ logging.info('Cleaning results directory from unnecessary files.') for collector in self._collectors: csv = os.path.join(self._raw_dir, '{}.csv'.format(collector)) if os.path.isfile(csv): os.remove(csv) def process_csv(self): """ Composes and formats data from all counters for further plotting """ for lang in self._counters: final_output = os.path.join(self._final_dir, '{}.csv'.format(lang)) self.__compose_csv(final_output, lang) self.__format_data(final_output) def __compose_csv(self, output, counter): """ Concatenates gathered csv data to one file """ logging.info('Composing file "{}".'.format(output)) try: with open(output, 'a') as outfile: for csv in glob.glob(os.path.join(self._raw_dir, '*{}*'.format(counter))): with open(csv, 'r') as file: outfile.writelines(file.readlines()[1:]) # Get rid of a file header with service info logging.info('File {} successfully created.'.format(output)) except (FileNotFoundError, IOError) as e: logging.error('Failed to compose file {file}: {exception}'.format(file=output, exception=e)) def __format_data(self, file): """ Sorts data after self.__compose_csv function and calculates % of CPU and Memory """ try: with open(file, 'r') as csv: raw_data = csv.readlines() with open(file, 'w') as csv: sorted_data = [line.replace('"', '').replace(',', ';') for line in sorted(raw_data) if '" "' not in line] csv_data = [] if 'cpu' in file: for line in sorted_data: time, cpu_user, cpu_app = line.split(';') cpu = (float(cpu_user) * float(cpu_app)) / (multiprocessing.cpu_count() * 100) csv_data.append('{};{:.2f}\n'.format(time, cpu)) if 'mem' in file: for line in sorted_data: time, total_memory = line.split(';') mem = float(total_memory) / (self._max_mem * 10000) csv_data.append('{};{:.2f}\n'.format(time, mem)) csv.writelines(csv_data) except (FileNotFoundError, IOError) as e: logging.error('Failed to process file "{file}": {exception}'.format(file=file, exception=e)) def __logman(self, cmd): """ Default wrapper for logman commands Args: cmd: windows command to be executed """ try: logging.debug('Running {}'.format(cmd)) subprocess.check_call(cmd) except (subprocess.CalledProcessError, OSError) as e: logging.error('Failed to execute command "{}": {}.'.format(cmd, e)) def __create(self, name, counter, output): """ Creates logman counter Args: name: uniq name of a collector counter: type of the counter (can be taken from perfmon) output: csv file for results """ logging.info('Creating collector "{}"'.format(name)) cmd = 'logman create counter "{name}" -f csv -si {interval} ' \ '--v -o "{output}" -c {counter}'.format(name=name, interval=str(self._interval), output=output, counter=counter) self.__logman(cmd) def __start(self, name): """ Starts logman collector Args: name: uniq name of a collector """ logging.info('Starting collector "{}".'.format(name)) cmd = 'logman start {}'.format(name) self.__logman(cmd) def __stop(self, name): """ Stops logman collector Args: name: uniq name of a collector """ logging.info('Stopping collector "{}".'.format(name)) cmd = 'logman stop {}'.format(name) self.__logman(cmd) def __delete(self, name): """ Deletes logman collector Args: name: uniq name of a collector """ logging.info('Deleting collector "{}".'.format(name)) cmd = 'logman delete {}'.format(name) self.__logman(cmd) if __name__ == '__main__': logging.basicConfig(level=logging.DEBUG) app = 'skype' start_time = time.strftime('%Y%m%d-%H%M%S', time.gmtime()) logman = PerflogManager(app, 3, 'd:/logman-test/') logman.init_collectors() logman.start_all() time.sleep(20) logman.stop_all() logman.process_csv()
おわりに
結論として、最小限のコストでWindowsのパフォーマンスメトリックの収集を自動化する必要がある場合、logmanはかなり有用なユーティリティであると言えます。 短期間でもっと便利な方法を見つけることができなかったので、コメントでそのような問題を解決する他の方法とアプローチについて学ぶことができてうれしいです。