As a rule, the construction of monitoring and business process management systems begins with the processing of messages and incidents. At the same time, an important technological moment is missed related to the possibility of automating the very fact of the occurrence of business events and recording incidents. Most business systems of the class WMS, TMS, etc., have built-in tools for monitoring their own processes. But, if it is a system of different manufacturers or the monitoring functionality is not sufficiently developed, you have to order expensive improvements or involve specialized consultants for additional settings.
Consider an approach in which we need only a small part of the consulting related to the determination of sources (tables) to obtain indicators from the system.
The specificity of our warehouses lies in the fact that several warehouse management systems (WMS Exceed) operate on the same logistics complex. Warehouses are divided in accordance with the categories of storage of goods (dry, alcohol, freezing, etc.) not only logically. Within a single logistics complex are several separate warehouse buildings, the operations on each of them are managed by their WMS.

To form a general picture of the processes occurring in the warehouse, managers analyze the reports of each WMS several times a day, process messages from warehouse operators (receivers, pickers, stackers) and summarize the actual operating indicators for display on the information board.
To save managers time, we decided to develop an inexpensive system for operational control of warehouse events. The new system, in addition to displaying “hot” indicators of the operational work of warehouse processes, should also help managers in fixing incidents and monitoring tasks to eliminate the causes that affect the given indicators. After conducting a general audit of the company's IT architecture, we realized that certain parts of the required system already somehow exist in our landscape and for them there is both an examination of the settings and the necessary support services. It remains only to reduce the whole concept into a single architectural solution and evaluate the scope of development.
After assessing the amount of work that needs to be done to build a new system, it was decided to divide the project into several stages:
- Collection of indicators on warehouse processes, visualization and control of indicators and deviations
- Automation of process standards and registration of applications in the business services service for deviations
- Proactive monitoring with load forecasting and making recommendations to managers.
At the first stage, the system should collect prepared slices of operational data from all WMS complexes. Reading takes place almost in real time (intervals less than 5 minutes). The trick is that the data must be obtained from the DBMS of several dozen warehouses when deploying the system to the entire network. The obtained operational data is processed by the system core logic to calculate deviations from the planned indicators and calculate statistics. The data processed in this way must be displayed on the manager’s tablet or on the warehouse’s information board in the form of clear graphs and diagrams.

When choosing a suitable system for the pilot implementation of the first stage, we settled on Zabbix. This system is already used to monitor IT performance of warehouse systems. By adding a separate installation to collect business metrics for warehouse operations, you can get a general picture of the warehouse’s health.
The general architecture of the system is as shown in the figure.
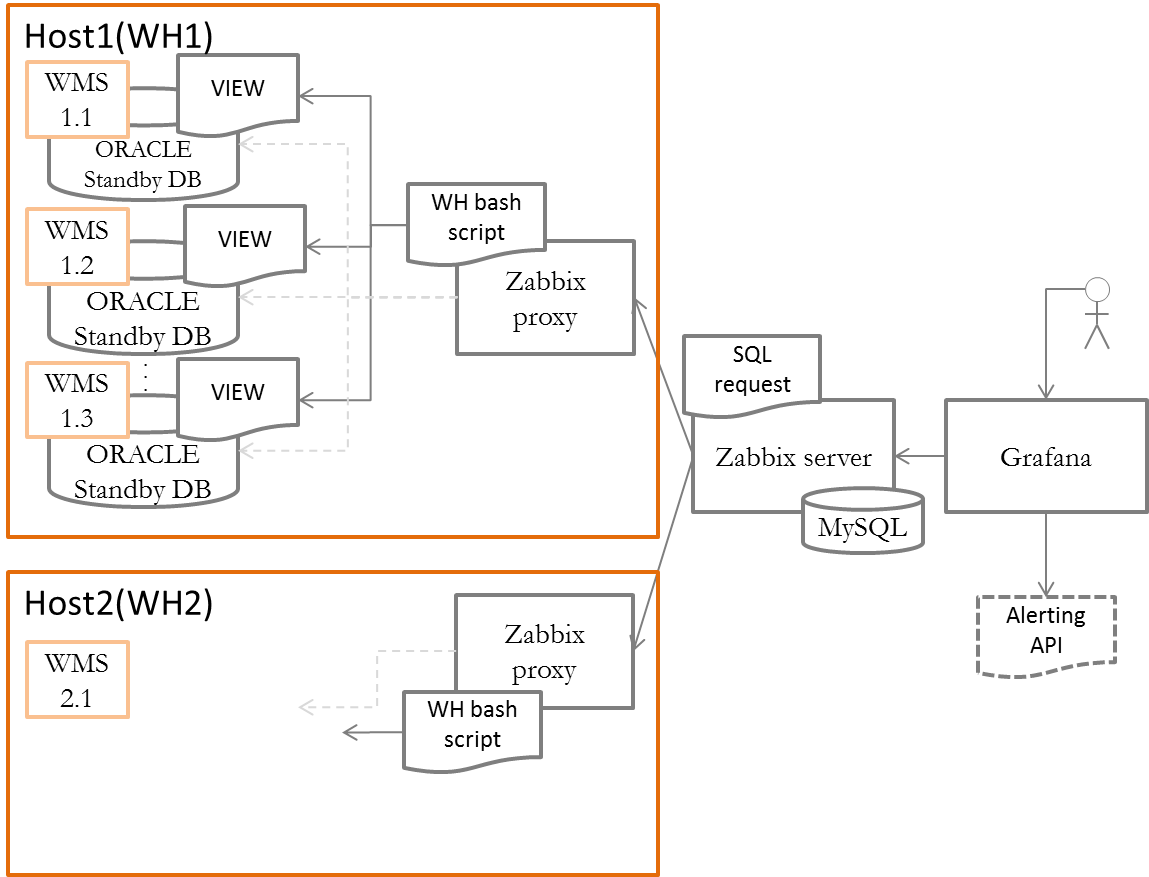
Each WMS instance is defined as a host for the monitoring system. Metrics are collected by a central server in the data center network by running a script with a prepared SQL query. If you need to monitor a system that does not recommend direct access to the database (for example, SAP EWM), you can use script calls to documented API functions to write indicators or write a simple python / vbascript program.
A Zabbix proxy instance is deployed in the warehouse network to distribute the load from the main server. Through Proxy, work with all local WMS instances is provided. At the next request for parameters by the Zabbix server on the host with Zabbix proxy, a script is executed to request metrics from the WMS database.
To display the graphs and indicators of the warehouse on the central Zabbix server, deploy Grafana. In addition to the output of prepared dashboards with warehouse infographics, Grafana will be used to control deviations of indicators and transfer automatic alerts to the warehouse service system for working with business incidents.
As an example, we consider the implementation of control of the loading of the warehouse acceptance zone. As the main indicators of the processes in this section of the warehouse selected:
- the number of vehicles in the reception area, taking into account the statuses (planned, arrived, documents, unloading, departure;
- congestion of placement and replenishment zones (according to storage conditions).
Settings
Installation and configuration of the main components of the system (SQLcl, Zabbix, Grafana) is described in different sources and will not be repeated here. Using SQLcl instead of SQLplus is due to the fact that SQLcl (the Oracle DBMS command line interface written in java) does not require additional installation of Oracle Client and works out of the box.
I will describe the main points that should be paid attention when using Zabbix to monitor the performance of warehouse business processes, and one of the possible ways to implement them. Also, this post is not about security. The safety of connections and the use of the presented methods needs additional study in the process of transferring a pilot solution to productive operation.
The main thing is that when implementing such a system, it is possible to do without programming, using the settings provided by the system.
The Zabbix monitoring system provides several options for collecting metrics from a monitored system. This can be done both by direct poll of the controlled hosts, and by a more advanced method of sending data to the server through the host's zabbix_sender, including methods for setting low-level discovery parameters. To solve our problem, the direct host polling method by the central server is quite suitable. this allows you to get full control over the sequence of obtaining metrics and ensures the use of one package of settings / scripts without the need to distribute them to each controlled host.
As “experimental” for debugging and tuning the system, we use the WMS worksheets for acceptance control:
- TS on acceptance, all that arrived: All TS with statuses for the period "- 72 hours from the current time" - SQL query identifier: getCars .
- History of all vehicle statuses: Statuses of all vehicles with 72 hours arrival - SQL query identifier: carsHistory .
- Scheduled vehicles for acceptance: Statuses of all vehicles with the status of "Scheduled", the time interval is " -24 hours" and "+24 hours" from the current time - SQL query identifier: carsIn .
So, after we have decided on a set of warehouse metrics, we will prepare SQL queries for the WMS database. To execute queries, it is advisable to use not the main database, but its “hot” copy - standby.
We are connected to standby Oracle DBMS for data acquisition. IP address for connecting to the test base 192.168.1.106 . Connection parameters are saved on the Zabbix server in TNSNames.ORA of the working SQLcl folder:
# cat /opt/sqlcl/bin/TNSNames.ORA WH1_1= (DESCRIPTION = (ADDRESS = (PROTOCOL = TCP)(HOST = 192.168.1.106)(PORT = 1521)) (CONNECT_DATA = (SERVER = DEDICATED) (SERVICE_NAME = WH1_1) ) )
This will allow us to run SQL queries to each host through EZconnect, specifying only the username / password and database name:
# sql znew/Zabmon1@WH1_1
The prepared SQL queries are saved in the working folder on the Zabbix server:
/etc/zabbix/sql
and allow access to the zabbix user of our server:
# chown zabbix:zabbix -R /etc/zabbix/sql
Request files receive a unique identifier name for access from the Zabbix server. Each database query through SQLcl returns us several parameters. Given the specifics of Zabbix, which can only process one metric in a query, we will use additional scripts to parse the query results into individual metrics.
We’re preparing the main script, let's call it wh_Metrics.sh, to call the SQL query to the database, save the results and return the technical metric with the success indicators for obtaining data:
#!/bin/sh ## </i> export ORACLE_HOME=/usr/lib/oracle/11.2/client64 export PATH=$PATH:$ORACLE_HOME/bin export LD_LIBRARY_PATH=$ORACLE_HOME/lib:/usr/lib64:/usr/lib:$ORACLE_HOME/bin export TNS_ADMIN=$ORACLE_HOME/network/admin export JAVA_HOME=/ alias sql="opt/sqlcl/bin/sql" ## sql- scriptLocation=/etc/zabbix/sql sqlFile=$scriptLocation/sqlScript_"$2".sql ## resultFile=/etc/zabbix/sql/mon_"$1"_main.log ## username="$3" password="$4" tnsname="$1" ## var=$(sql -s $username/$password@$tnsname < $sqlFile) ## echo $var | cut -f5-18 -d " " > $resultFile ## if grep -q ora "$resultFile"; then echo null > $resultFile echo 0 else echo 1 fi
We place the finished file with the script in the folder for hosting external scripts in accordance with the Zabbix-proxy configuration settings (by default - / usr / local / share / zabbix / externalscripts ).
The identification of the database from which the script will receive the results will be transmitted by the script parameter. The database identifier must correspond to the settings line in the TNSNames.ORA file.
The result of calling the SQL query is saved in a file of the form mon_base_id_main.log, where base_id = DB identifier obtained as a script parameter. Separation of the result file by database identifiers is provided in case of requests from the server simultaneously to several databases. The query returns a sorted two-dimensional array of values.
The following script, let's call it getMetrica.sh, is needed to get the specified metric from the file with the result of the request:
#!/bin/sh ## resultFile=/etc/zabbix/sql/mon_”$1”_main.log ## : ## , (RSLT) ## {1 1 2 2…} ( IFS) ## IFS=' ' str=$(cat $resultFile) status_id=null read –ra RSLT <<< “$str” for i in “${RSLT[@]}”; do if [[ “$status_id” == null ]]; then status_id=”$I" elif [[ “$status_id” == “$2” ]]; then echo “$i” break else status_id=null fi done
Now we are ready to set up Zabbix and start monitoring the performance of warehouse acceptance processes.
A Zabbix agent is installed and configured on each database node.
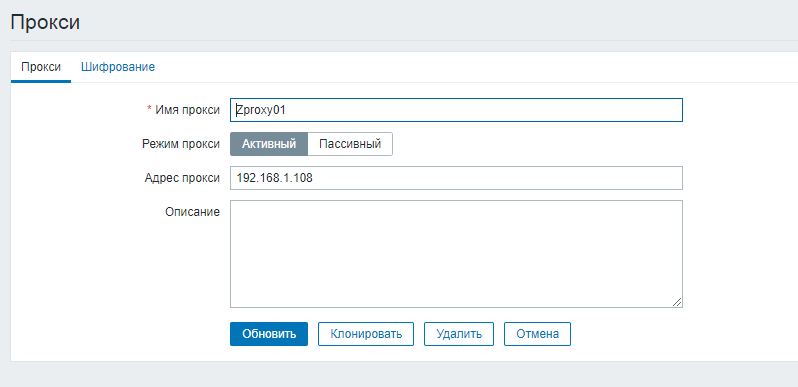
On the main server, we define all servers with a Zabbix proxy. For settings, go to the following path:
Administration → Proxies → Create Proxy
Define controlled hosts:
Settings → Hosts → Create host
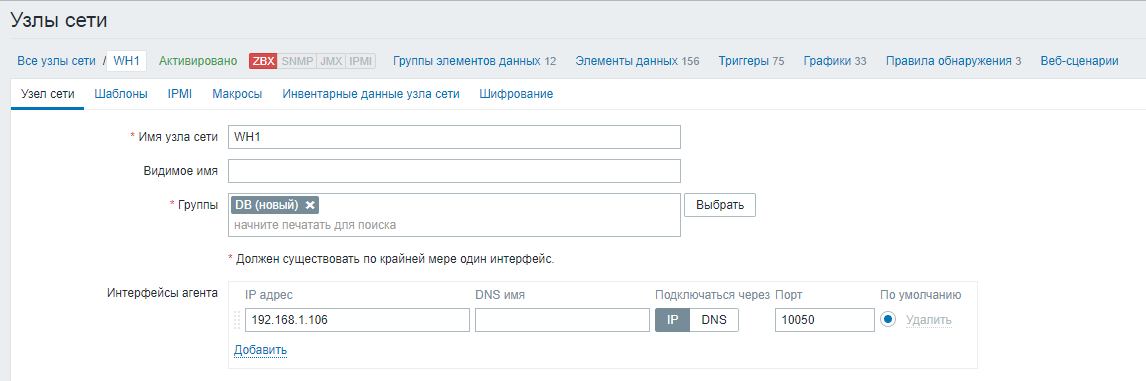
The host name must match the host name specified in the agent configuration file.
We indicate the group for the node, as well as the IP address or DNS name of the node with the database.
We create metrics and specify their properties:
Settings → Nodes → 'node name' → Data items> Create data item
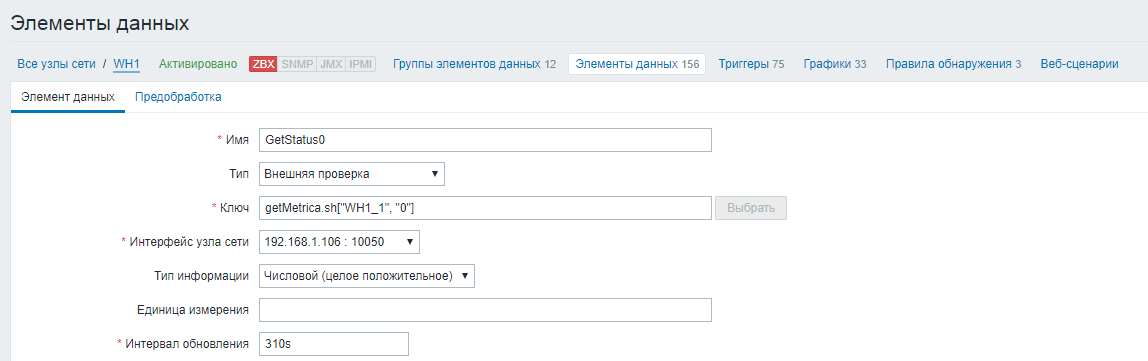
1) We create the main metric for requesting all parameters from the database
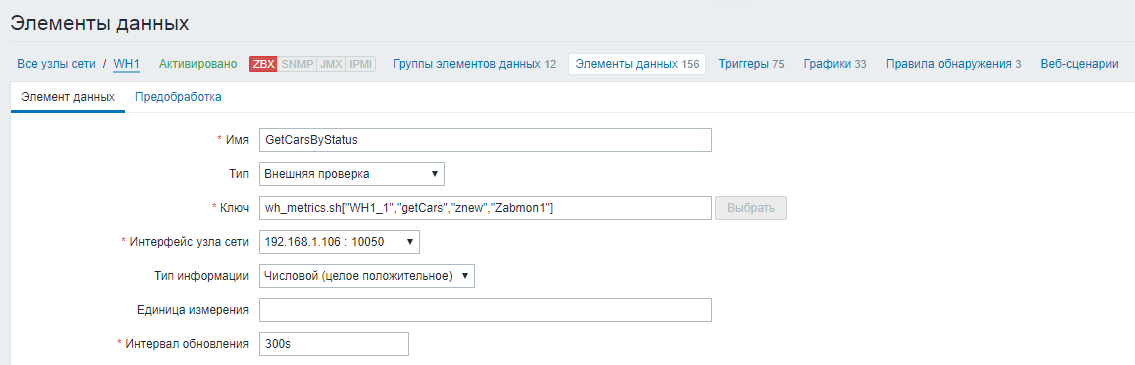
We set the name of the data element, indicate the type of “External verification”. In the “Key” field, we define a script to which we transfer the name of the Oracle database, the name of the sql query, login and password for connecting to the database as parameters. Set the update interval for the request to 5 minutes (300 seconds).
2) Create the remaining metrics for each vehicle status. The values of these metrics will be formed based on the result of checking the main metric.
We set the name of the data element, indicate the type of “External verification”. In the “Key” field, we define a script to which we transfer the name of the Oracle database and the status code, the value of which we want to track as parameters. We set the interval for updating the request 10 seconds longer than the main metric (310 seconds) so that the results can be written to the file.
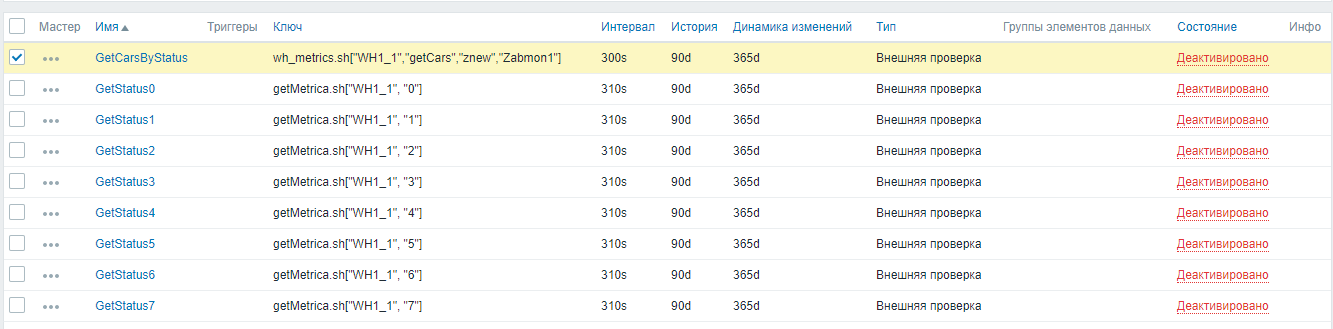
To correctly obtain metrics, the order in which checks are activated is important. In order to avoid conflicts when receiving data, first of all, activate the main GetCarsByStatus metric with a script call - wh_Metrics.sh.
Settings → Nodes → 'node name' → Data elements → Subfilter “External checks”. We mark the necessary check and click “Activate”.
Next, activate the remaining metrics in one operation, selecting them all together:
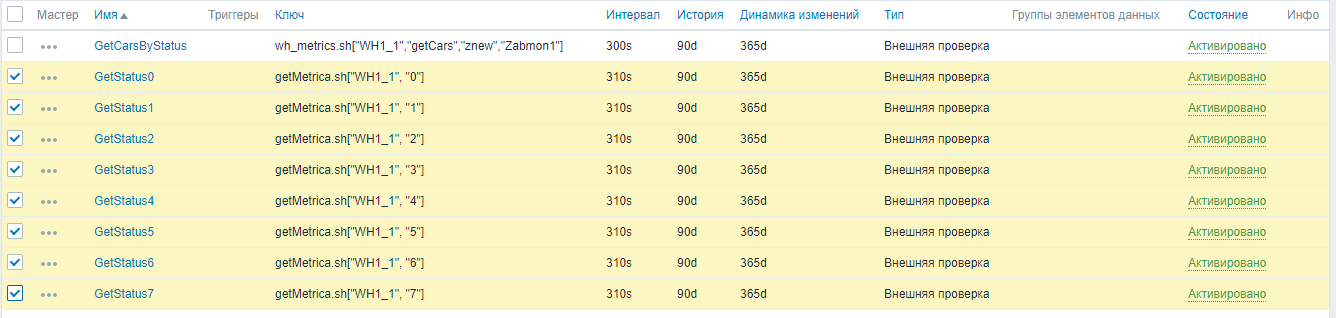
Zabbix has now begun collecting warehouse business metrics.
In the following articles, we will examine in more detail the connection of Grafana and the formation of information warehouse deshboards for various categories of users. Grafana also monitors deviations in the warehouse and, depending on the boundaries and frequency of deviations, records incidents in the system of the warehouse management service center via the API or simply sends notifications to the manager by e-mail.