The article talks about a convenient tool for comparing sessions for profiling PHP code, which made it possible to quickly find bottlenecks in a project on CMS Bitrix.
From far away
In July, Bitrix was updated to the latest version at that time ... And the page loading speed dipped: somewhere by 20%, somewhere by 300 +%. Especially at the stages of customer ordering.
The figures are impressive and sad. Why updated?

Those. there was a risk that if we did not update, we would have to solve two problems at once: actually updating Bitrix and updating our code base to PHP> 7.1.
Reason for the brakes
The reason for the biggest brakes, as it turned out, is the new code logic for working with delivery profiles. According to the code, they did it more correctly, or something: shipments appeared as separate entities. Now the order can be sent in several shipments (with its own characteristics in terms of cost, delivery method and composition of goods).
However, now the delivery profile is a separate entry in the database with its limitations from the Bitrix kernel, which will pop every time you need to check the possibility of showing this profile when placing an order.
In general, the article will focus not on what exactly was redone to cope with the brakes, but on a tool that made it possible to quickly find bottlenecks in the code and fix them.
XHProf Admin
At our disposal was a popular profiler from Facebook - XHProf. The disadvantages that inhibit the operation of the tool relate to its GUI:
- Lack of clear navigation between profiling sessions
- Inability to compare more than two sessions simultaneously outside the same namespace.
- You cannot make comments on them in the list of sessions. After the tenth session, you already forget what changes the previous profiling results are related to.
As a result, looking at the SOURCES of the native XHProf GUI, and, a little horrified, a new GUI was written for him, covering the above disadvantages.
Installation
I will not describe how to install XHProf and profile, there are at least some good tutorials on the Habré.
To install XHProf Admin, put the xhprof_admin folder in the xhprof_html folder of the native XHProf. Or clone the entire project (it already contains both XHProf and the new GUI).
Then open the page <Path to xhprof> / xhprof_html / xhprof_admin /
If mapping is enabled, as recommended in the documentation, you need to open <Path to xhprof> / xhprof_admin /
Main page

Contains:
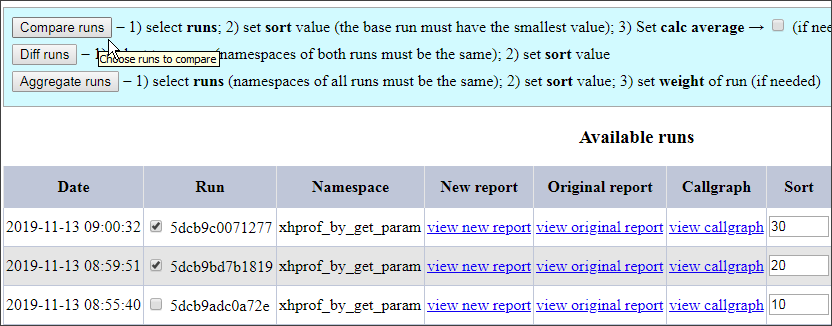
- List all profiling sessions sorted by date
- Session Comment Fields
- Jackdaws with which you can select sessions to delete, compare, aggregate
- Link to a new report
- Links to native report and callgraph
- Session Weight Fields for Diff and Aggregate
- A field specifying the sequence in which sessions will be displayed in Compare mode, as well as in Diff mode
- Buttons:
- Compare - compares selected sessions (new report)
- Diff - a standard report for comparing sessions in one namespace
- Aggregate - a standard report with session aggregation in one namespace
- Save custom comments - saves the comment for the session (in a separate file)
- Delete selected runs - deletes session files and comment files
- Link to the native session listing page
View original report, Diff runs, Aggregate runs, View callgraph - native features of the XHProf GUI - I will not describe them. I can only say that XHProf Admin allows you to conveniently navigate to them, rather than manually compiling links.
Compare runs

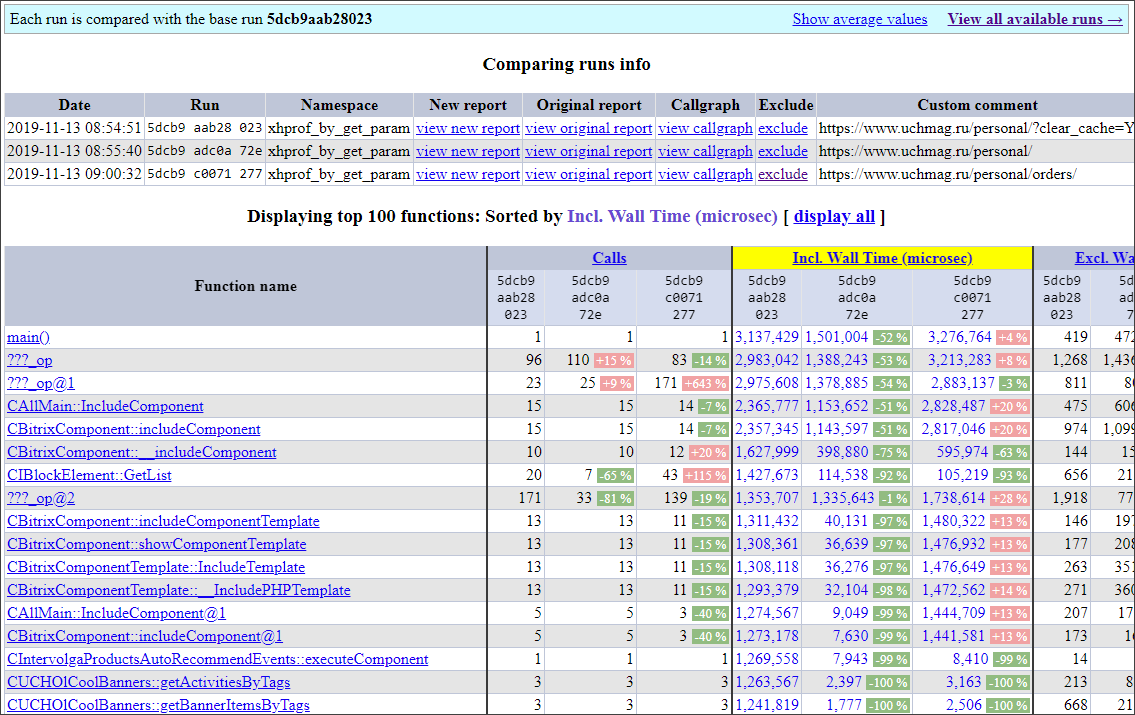
A new report that allows you to quickly evaluate the growth or regression in productivity.
To use it, on the main page:
- Select the sessions that we want to compare.
- We set the sort field "Sort" to determine the order in which sessions are displayed: the smaller the value of the field, the earlier the session will be displayed. The very first session will be taken as the base one - all subsequent sessions will be compared with it.
- If we want to display the average values of metrics, then mark "show average".
- Click "Compare."

The report does not show the% that the function “occupies” for each metric so as not to clutter the page, but display absolute values. If there is a difference of more than 1% in the metric for the function being profiled between the base session and the subsequent one, this is clearly shown: green indicates improvement, red indicates regression.
Default:
- The report displays the first 100 functions. If you need more, click on "display all".
- Data is sorted by the “Incl. Wall Time (microsec) ”, but you can click on any metric and sort by it.
To exclude a session from the report, click "exclude".
Sorting by each metric is available - just click on the column heading.
To display the average values for all selected sessions, click “Show average values”.
For drill-down on a function, you can click on a cell at the intersection of the function and the metric with the session shown.

Usage example
- We started the profiler on the source code. We opened the list of sessions and added a comment to it.
- We started the profiler on the improved code. Also added a comment.
- Did item 2 several times.
- Then we opened the list of profiling sessions, sequentially selected all sessions and clicked Compare.
- We looked at the changes.
- They decided what else to speed up.
XHProf Admin is conveniently used to identify frequently used heavy functions that are performed by a single user. For example, in Bitrix, when placing an order when moving from one stage to another (delivery, payment, contacts, etc.) each time a number of functions are called up to control the integrity of the basket, etc. These stages are profiled separately and then displayed together in the report Compare. The results of these functions can be cached, significantly speeding up the transition time from stage to stage.
Total
As a result, we leveled off the speed drop at the stages of placing an order when updating Bitrix, simultaneously analyzing other sections of the site and speeding them up.
From time to time we use XHProf Admin on projects as a more visual GUI.
Documentation link to XHProf Admin: go
Who is interested in the topic of code optimization and tools for this, write in the comments.