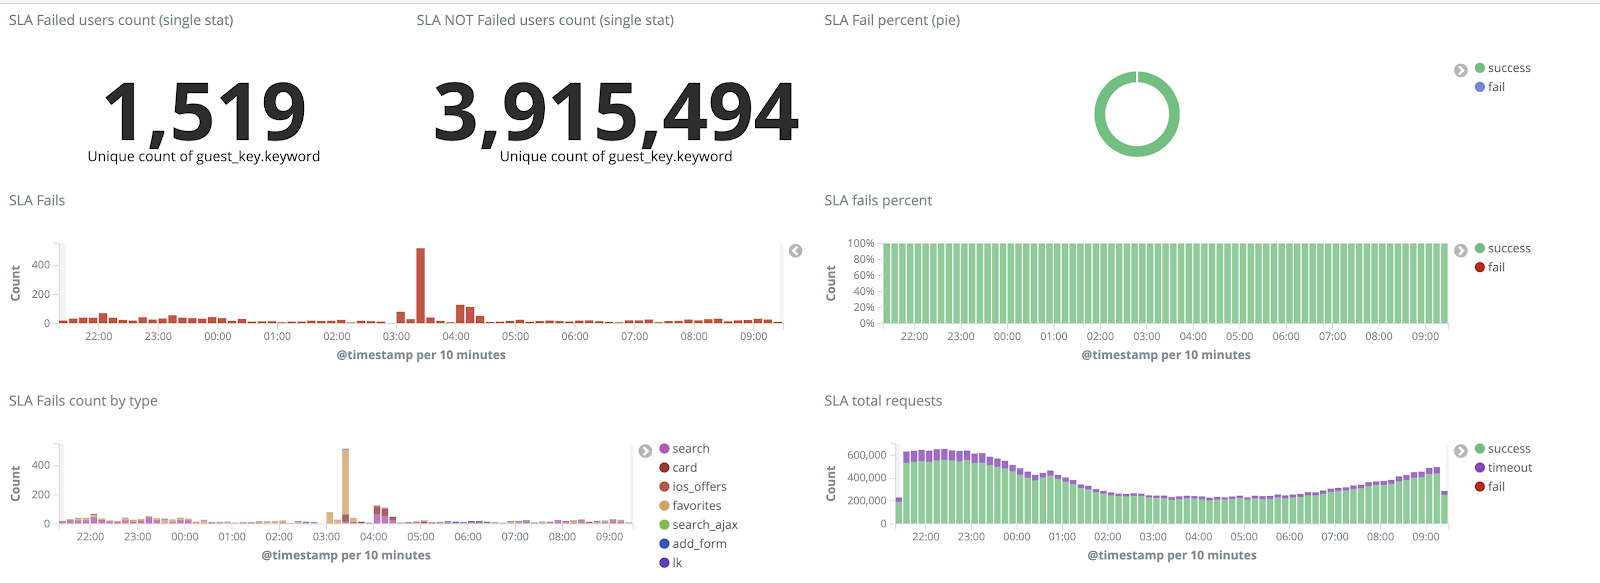
Hello everyone, my name is Alexander, I work as an engineer at CIAN and am involved in system administration and automation of infrastructure processes. In the comments to one of the previous articles we were asked to tell where we get 4 TB of logs per day and what we do with them. Yes, we have a lot of logs, and a separate infrastructure cluster has been created to process them, which allows us to quickly solve problems. In this article, I’ll talk about how we adapted it over the year to work with an ever-growing flow of data.
Where did we start
Over the past few years, the load on cian.ru has grown very rapidly, and by the third quarter of 2018, resource traffic reached 11.2 million unique users per month. At that time, at critical moments, we lost up to 40% of the logs, because of which we could not quickly deal with incidents and spent a lot of time and effort on resolving them. We often could not find the cause of the problem, and it recurred after some time. It was hell with which you had to do something.
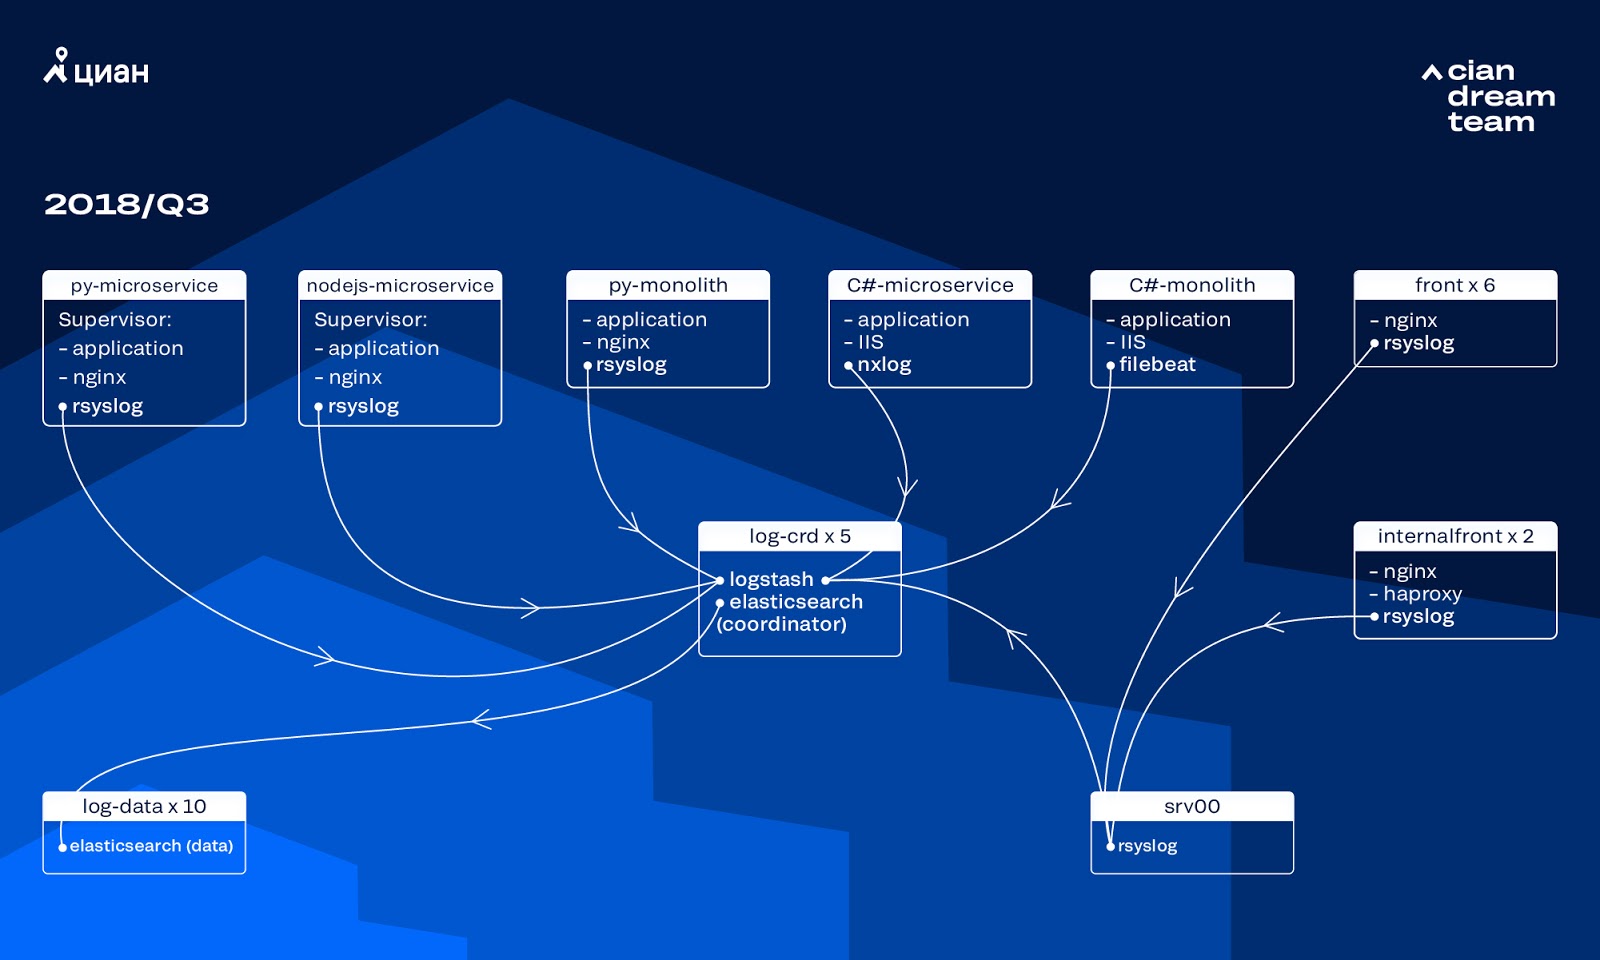
At that time, we used a cluster of 10 data nodes with ElasticSearch version 5.5.2 with typical index settings to store logs. It was introduced more than a year ago as a popular and affordable solution: then the log stream was not so big, it made no sense to come up with non-standard configurations.
Logstash on different ports provided processing of incoming logs on five ElasticSearch coordinators. One index, regardless of size, consisted of five shards. Hourly and daily rotation was organized, as a result, about 100 new shards appeared in the cluster every hour. While there were not very many logs, the cluster managed and no one drew attention to its settings.
Growth problems
The volume of the generated logs grew very quickly, since two processes overlapped each other. On the one hand, there were more and more users of the service. On the other hand, we began to actively switch to microservice architecture, sawing our old monoliths into C # and Python. Several dozen new microservices that replaced parts of the monolith generated significantly more logs for the infrastructure cluster.
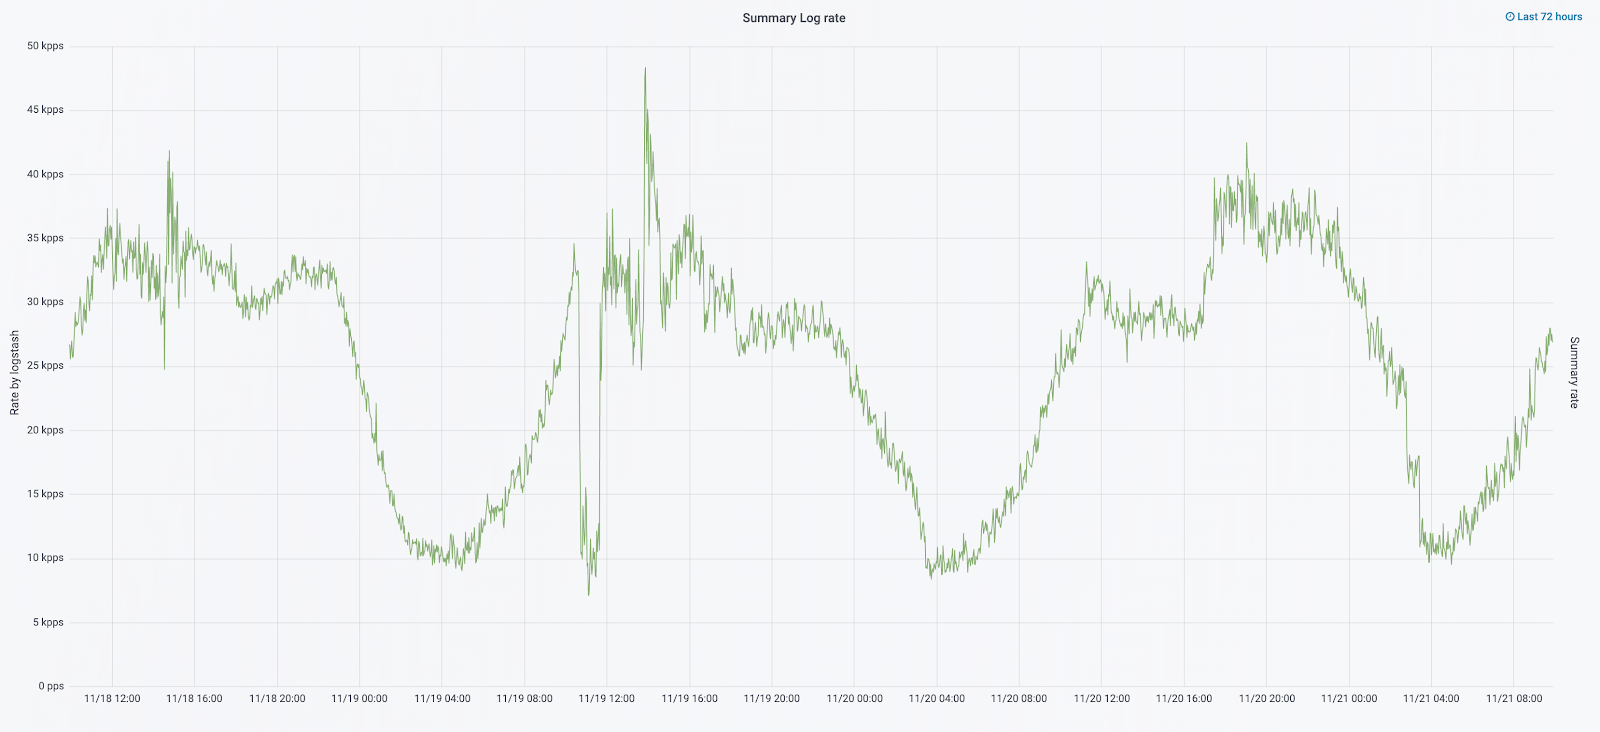
It was scaling that led us to the fact that the cluster became virtually uncontrollable. When the logs began to arrive at a speed of 20 thousand messages per second, frequent useless rotation increased the number of shards to 6 thousand, and one node accounted for more than 600 shards.
This led to problems with the allocation of RAM, and when the node fell, the simultaneous moving of all shards began, multiplying the traffic and loading the remaining nodes, which made it almost impossible to write data to the cluster. And during this period we were left without logs. And with a server problem, we lost 1/10 of the cluster in principle. A large number of small indexes added complexity.
Without logs, we did not understand the causes of the incident and could sooner or later step on the same rake again, but this was unacceptable in the ideology of our team, since all the working mechanisms we had were sharpened exactly the opposite - never repeat the same problems. To do this, we needed a full volume of logs and their delivery in almost real time, as a team of duty engineers monitored alerts not only from metrics, but also from logs. To understand the extent of the problem - at that time the total volume of logs was about 2 TB per day.
We set the task of completely eliminating the loss of logs and reducing the time of their delivery to the ELK cluster to a maximum of 15 minutes during force majeure (we relied on this figure in the future as an internal KPI).
New rotation mechanism and hot-warm nodes
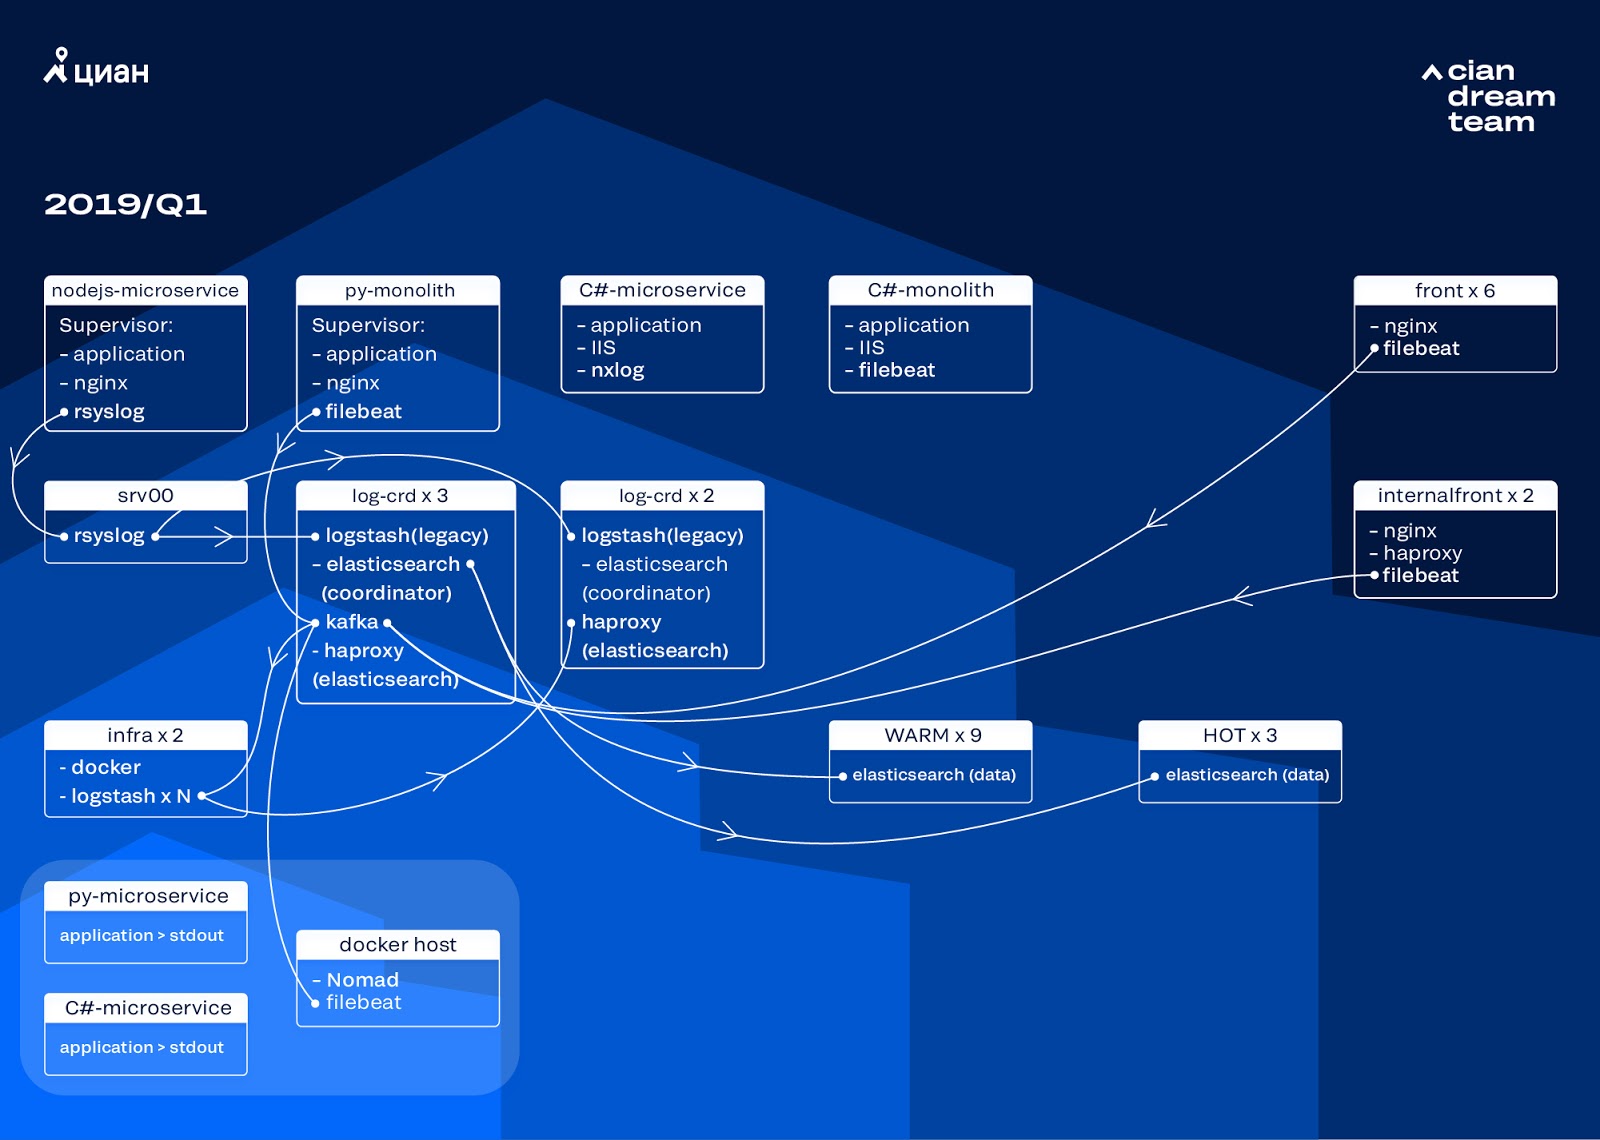
We started the cluster transformation by updating the version of ElasticSearch from 5.5.2 to 6.4.3. Once again we had a cluster of version 5 laid down, and we decided to repay it and completely update it - there are still no logs. So we made this transition in just a couple of hours.
The most ambitious transformation at this stage was the introduction of three nodes with a coordinator as an intermediate buffer Apache Kafka. The message broker saved us from losing logs during problems with ElasticSearch. At the same time, we added 2 nodes to the cluster and switched to a hot-warm architecture with three “hot” nodes arranged in different racks in the data center. We redirected logs to them that should not be lost in any case - nginx, as well as application error logs. Minor logs — debug, warning, etc., went to other nodes, and also, after 24 hours, “important” logs moved from “hot” nodes.
In order not to increase the number of small indexes, we switched from time rotation to the rollover mechanism. There was a lot of information on the forums that rotation by index size is very unreliable, so we decided to use rotation by the number of documents in the index. We analyzed each index and recorded the number of documents after which rotation should work. Thus, we have reached the optimal size of the shard - no more than 50 GB.
Cluster Optimization
However, we did not completely get rid of the problems. Unfortunately, small indices appeared all the same: they did not reach the set volume, did not rotate and were deleted by global cleaning of indices older than three days, since we removed rotation by date. This led to data loss due to the fact that the index from the cluster completely disappeared, and an attempt to write to a nonexistent index broke the curator logic that we used for control. Alias for recording was converted to an index and broke the rollover's logic, causing uncontrolled growth of some indices to 600 GB.
For example, to configure rotation:
urator-elk-rollover.yaml --- actions: 1: action: rollover options: name: "nginx_write" conditions: max_docs: 100000000 2: action: rollover options: name: "python_error_write" conditions: max_docs: 10000000
In the absence of rollover alias, an error occurred:
ERROR alias "nginx_write" not found. ERROR Failed to complete action: rollover. <type 'exceptions.ValueError'>: Unable to perform index rollover with alias "nginx_write".
We left the solution to this problem for the next iteration and took up another question: we switched to pull the logic of Logstash, which handles incoming logs (removing unnecessary information and enriching it). We placed it in docker, which we launch through docker-compose, and in the same place we placed logstash-exporter, which gives metrics to Prometheus for operational monitoring of the log stream. So we gave ourselves the opportunity to smoothly change the number of logstash instances responsible for processing each type of log.
While we were improving the cluster, cian.ru traffic grew to 12.8 million unique users per month. As a result, it turned out that our transformations didn’t keep up with the changes on production a bit, and we were faced with the fact that the “warm” nodes could not cope with the load and slowed down the entire delivery of logs. We received the "hot" data without failures, but we had to intervene in the delivery of the rest and do manual rollover to evenly distribute the indices.
At the same time, scaling and changing the settings of logstash instances in the cluster was complicated by the fact that it was a local docker-compose, and all actions were performed by hand (to add new ends, it was necessary to go through all servers with your hands and do docker-compose up -d everywhere).
Log redistribution
In September of this year, we still continued to saw the monolith, the cluster load increased, and the log stream was approaching 30 thousand messages per second.
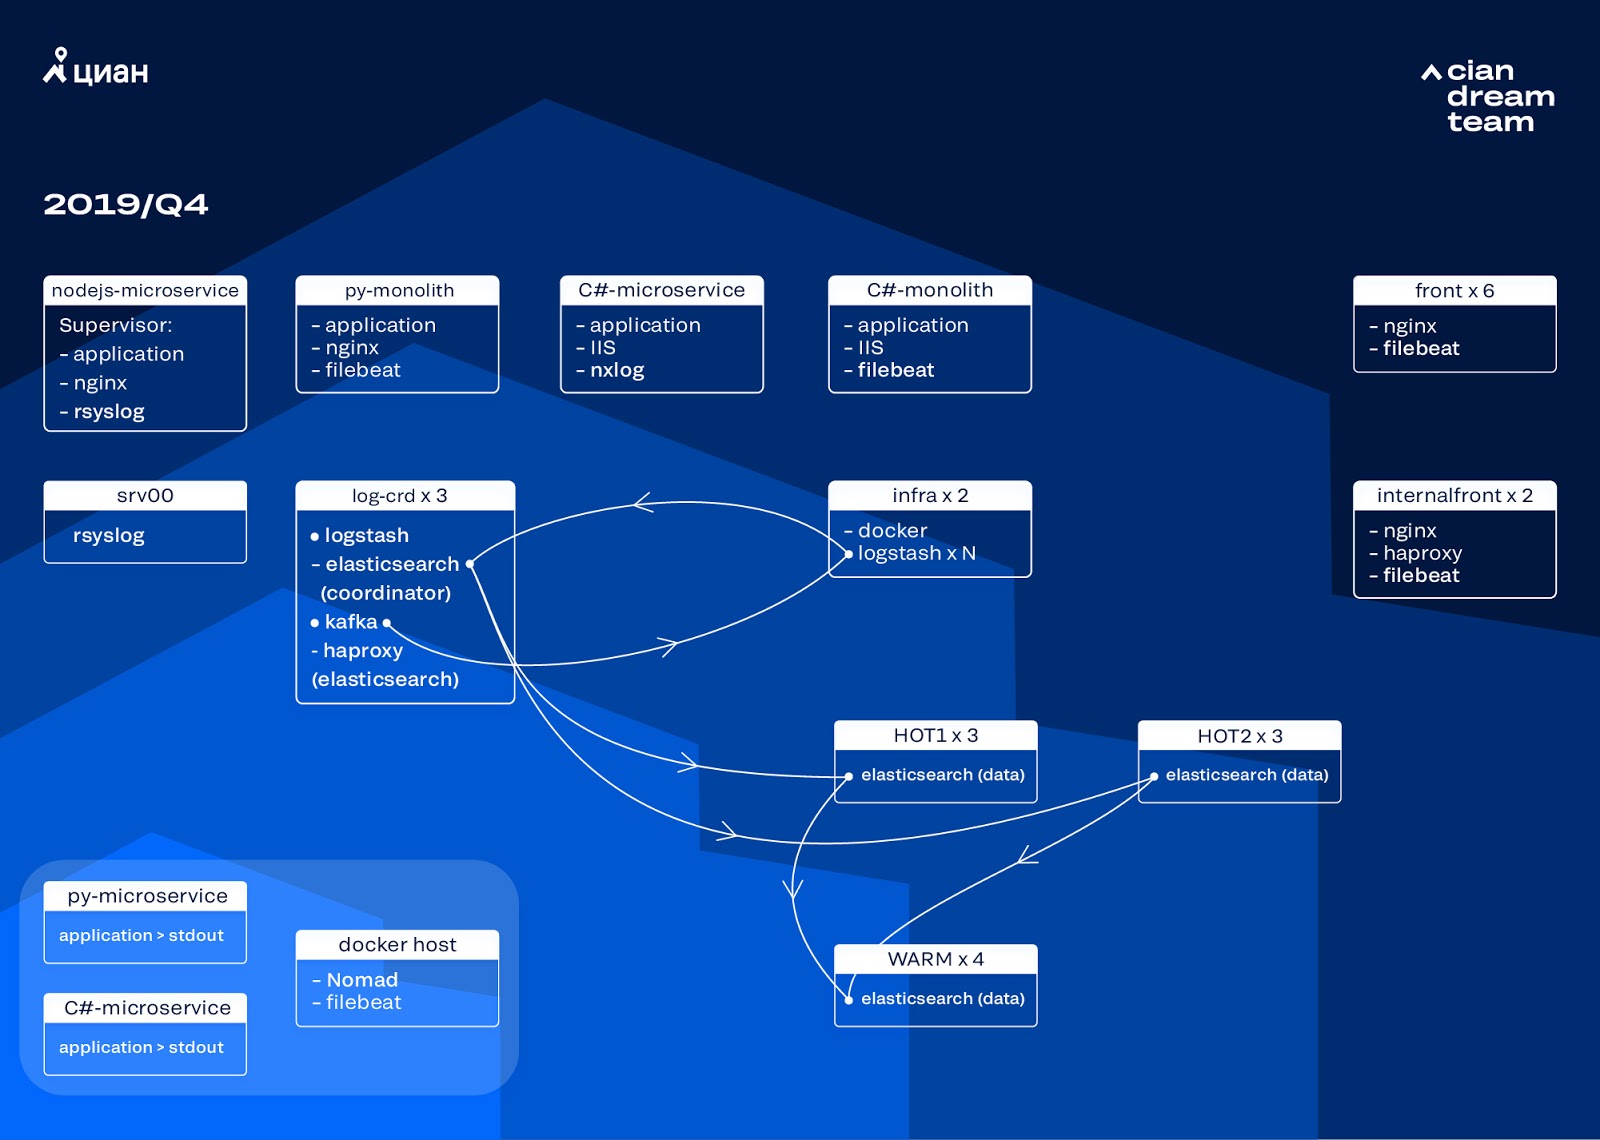
We started the next iteration with updating the iron. We switched from five coordinators to three, replaced data nodes and won in terms of money and storage volume. For nodes, we use two configurations:
- For hot nodes: E3-1270 v6 / 960Gb SSD / 32 Gb x 3 x 2 (3 for Hot1 and 3 for Hot2).
- For warm nodes: E3-1230 v6 / 4Tb SSD / 32 Gb x 4.
At this iteration, we took out the index with microservice access logs, which takes up as much space as the front-end nginx logs, into the second group of three hot nodes. We now store data on “hot” nodes for 20 hours, and then transfer it to “warm” to other logs.
We solved the problem of the disappearance of small indices by reconfiguring their rotation. Indexes are now rotated anyway every 23 hours, even if there is little data. This slightly increased the number of shards (they became about 800), but from the point of view of cluster performance this is tolerable.
As a result, six “hot” and only four “warm” nodes turned out in the cluster. This causes a slight delay in requests over long time intervals, but increasing the number of nodes in the future will solve this problem.
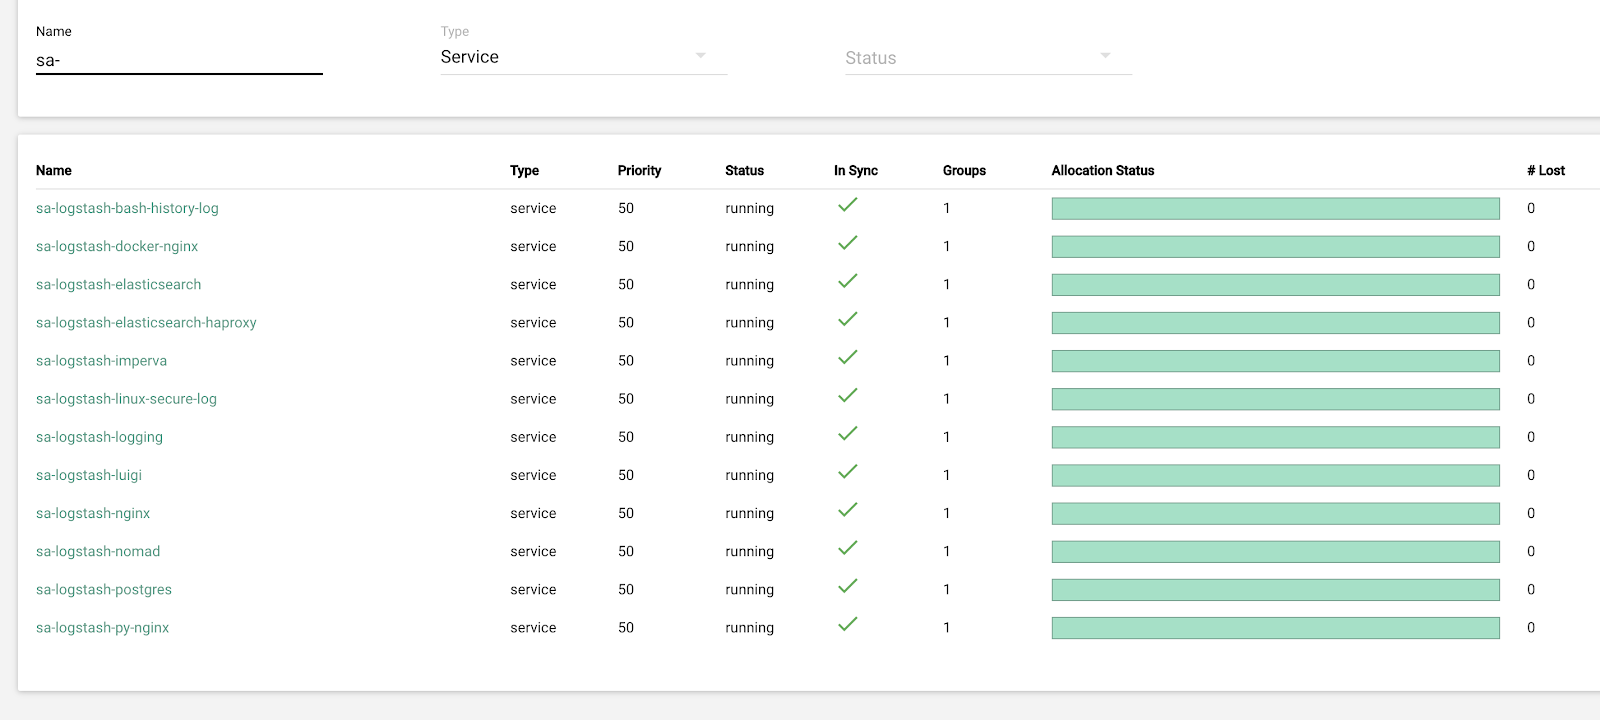
In this iteration, the problem of the lack of semi-automatic scaling was also fixed. To do this, we deployed an infrastructure Nomad cluster - similar to what we have already deployed for production. While the number of Logstash does not automatically change depending on the load, but we will come to this.
Future plans
The implemented configuration scales well, and now we store 13.3 TB of data - all logs in 4 days, which is necessary for emergency analysis of alerts. We convert part of the logs to metrics, which we add to Graphite. To facilitate the work of engineers, we have metrics for the infrastructure cluster and scripts for semi-automatic fixing typical problems. After increasing the number of data nodes, which is scheduled for next year, we will move to data storage from 4 to 7 days. This will be enough for operational work, since we always try to investigate incidents as soon as possible, and telemetry data is available for long-term investigations.
In October 2019, cian.ru traffic grew to 15.3 million unique users per month. This was a serious test of the architectural solution for the delivery of logs.
Now we are preparing to upgrade ElasticSearch to version 7. However, for this we will have to update the mapping of many indexes in ElasticSearch, because they moved from version 5.5 and were declared deprecated in version 6 (in version 7 they simply do not exist). And this means that in the process of updating there will certainly be some force majeure that will leave us without logs for the time being. Of the 7 versions, we are most looking forward to Kibana with an improved interface and new filters.
We achieved the main goal: we stopped losing logs and reduced the downtime of the infrastructure cluster from 2-3 drops per week to a couple of hours of service work per month. All this work on production is almost invisible. However, now we can accurately determine what is happening with our service, we can quickly do it in a calm mode and not worry that the logs will be lost. In general, we are satisfied, happy and are preparing for new feats, which we will talk about later.