Application
Anomaly detection is used in areas such as:
1) Prediction of equipment breakdowns
So, in 2010, Iranian centrifuges were attacked by the Stuxnet virus, which set the equipment to an optimal mode and disabled part of the equipment due to accelerated wear.
If anomaly search algorithms were used on the equipment, failure situations could be avoided.

The search for anomalies in the operation of equipment is used not only in the nuclear industry, but also in metallurgy and aircraft turbines. And in other areas where the use of predictive diagnostics is cheaper than possible losses in case of unpredictable breakdown.
2) Predict fraud
If the card you use in Podolsk is withdrawn in Albania, it is possible that the transaction should be further checked.
3) Identify abnormal consumer patterns
If some customers exhibit abnormal behavior, there may be a problem that you are not aware of.
4) Identification of abnormal demand and load
If sales in the FMCG store fell below the border of the forecast confidence interval, you should find the reason for what is happening.
Anomaly Detection Approaches
1) The method of support vectors with one class One-Class SVM
Suitable when the data in the training set obeys the normal distribution, while the test set contains anomalies.
The single-class support vector method constructs a non-linear surface around the origin. It is possible to set the cutoff boundary, which data is considered abnormal.
Based on the experience of our DATA4 team, One-Class SVM is the most frequently used algorithm for solving the anomaly search problem.

2) Isolate forest method - isolate forest
With the “random” method of constructing trees, emissions will fall into the leaves in the early stages (at a shallow depth of the tree), i.e. emissions are easier to “isolate”. Anomalous values are extracted at the first iterations of the algorithm.

3) Elliptic envelope and statistical methods
Used when data is normally distributed. The closer the measurement to the tail of the mixture of distributions, the more anomalous the value.
Other statistical methods can be attributed to this class.


Image from dyakonov.org
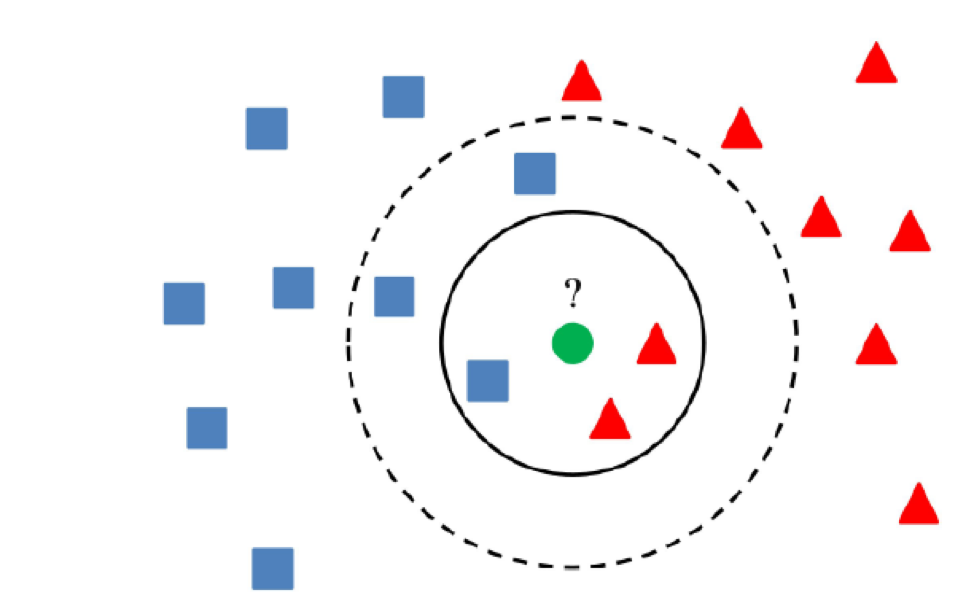
4) Metric methods
Methods include algorithms such as k nearest neighbors, k-th nearest neighbor, ABOD (angle-based outlier detection) or LOF (local outlier factor).
Suitable if the distance between the values in the signs is equivalent or normalized (so as not to measure the boa in the parrots).
The k nearest neighbors algorithm assumes that normal values are located in a certain region of multidimensional space, and the distance to the anomalies will be greater than to the separating hyperplane.
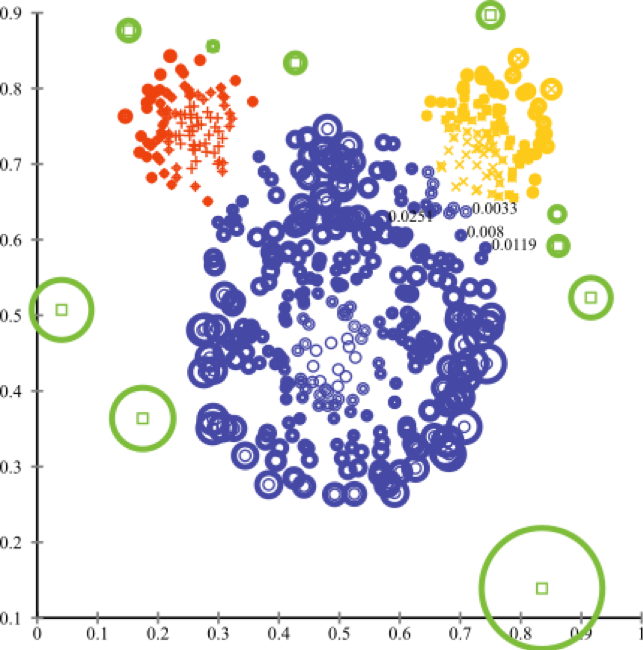
5) Cluster methods
The essence of cluster methods is that if the value is more than a certain distance from the centers of the clusters, the value can be considered anomalous.
The main thing is to use an algorithm that correctly clusters data, which depends on the specific task.
6) The method of principal components
Suitable where the areas of greatest variation in variance are highlighted.
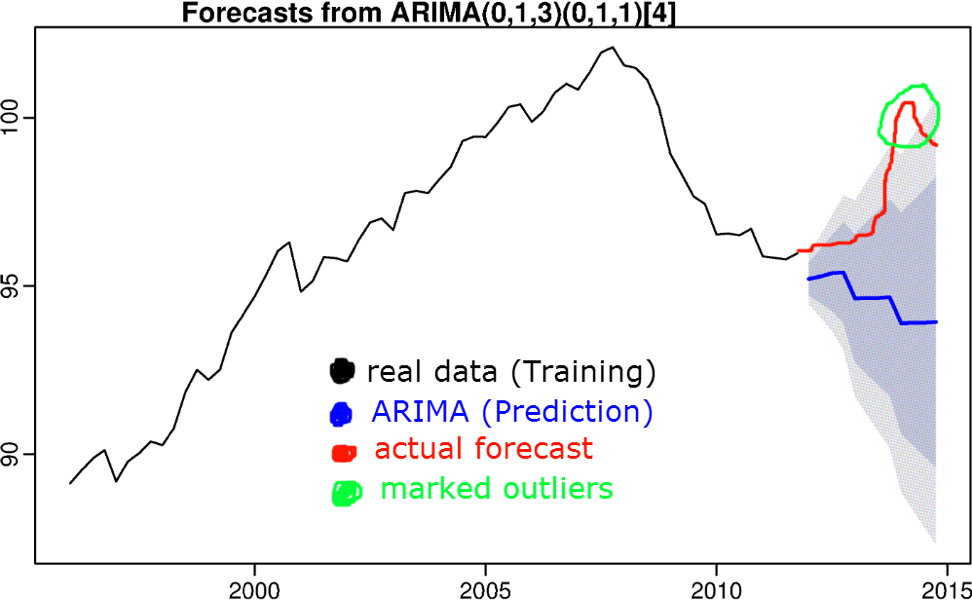
7) Algorithms based on time series forecasting
The idea is that if a value is knocked out of a prediction confidence interval, the value is considered abnormal. Algorithms such as triple smoothing, S (ARIMA), boosting, etc. are used to predict the time series.
Time series forecasting algorithms were discussed in a previous article.
8) Training with a teacher (regression, classification)
If the data allows, we use algorithms from linear regression to recurrent networks. We measure the difference between the prediction and the actual value, and conclude how much the data is knocked out of the norm. It is important that the algorithm has sufficient generalizing ability, and the training sample does not contain abnormal values.
9) Model tests
We approach the problem of searching for anomalies as the task of searching for recommendations. We decompose our feature matrix using SVD or factorization machines, and the values in the new matrix, which are significantly different from the original ones, are considered abnormal.
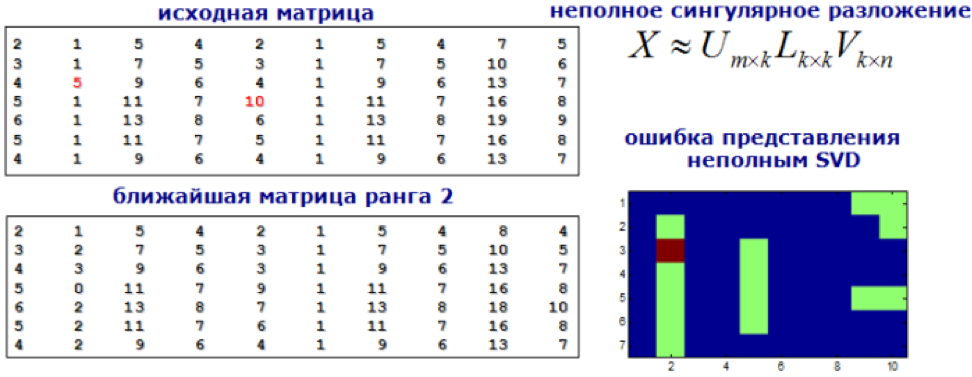
Image from dyakonov.org
Conclusion
In this article, we examined the basic approaches to detecting anomalies.
The search for anomalies can be called art in many ways. There is no ideal algorithm or approach whose application solves all problems. Most often, a set of methods is used to solve a specific case. Anomalies are searched using the single-class method of support vectors, isolating forests, metric and cluster methods, as well as using the main components and time series forecasting.
If you know other methods, write about them in the comment section of the article.