
A couple of years ago, Kubernetes was already discussed on the official GitHub blog. Since then, it has become the standard technology for deploying services. Kubernetes now manages a significant portion of internal and public services. As our clusters grew and performance requirements became more stringent, we began to notice that some services on Kubernetes sporadically display delays that cannot be explained by the load of the application itself.
In fact, in applications, a random network delay of up to 100 ms or more occurs, which leads to timeouts or retries. It was expected that services would be able to respond to requests much faster than 100 ms. But this is not possible if the connection itself takes so much time. Separately, we observed very fast MySQL queries, which were supposed to take milliseconds, and MySQL really managed in milliseconds, but from the point of view of the requesting application, the response took 100 ms or more.
It immediately became clear that the problem only occurs when connecting to the Kubernetes host, even if the call came from outside Kubernetes. The easiest way to reproduce the problem is in the Vegeta test, which runs from any internal host, tests the Kubernetes service on a specific port, and sporadically registers a large delay. In this article, we’ll look at how we managed to track down the cause of this problem.
Eliminate unnecessary complexity in the failure chain
Having reproduced the same example, we wanted to narrow the focus of the problem and remove the extra layers of complexity. Initially, there were too many elements in the stream between Vegeta and pods on Kubernetes. To identify a deeper network problem, you need to exclude some of them.
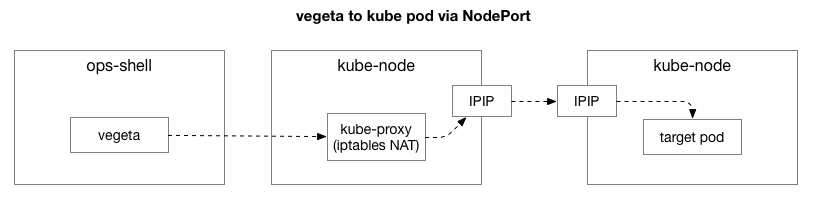
The client (Vegeta) creates a TCP connection with any node in the cluster. Kubernetes acts as an overlay network (over the existing data center network), which uses IPIP , that is, encapsulates the IP packets of the overlay network inside the IP packets of the data center. When connected to the first node, Network Address Translation (NAT) network address translation is performed with state monitoring to convert the IP address and port of the Kubernetes host to the IP address and port on the overlay network (in particular, the pod with the application). For received packets, the reverse sequence is performed. This is a complex system with many states and many elements that are constantly updated and changed as services are deployed and moved.
The
tcpdump
utility in the Vegeta test gives a delay during the TCP handshake (between SYN and SYN-ACK). To remove this unnecessary complexity, you can use
hping3
for simple “pings” with SYN packages. Check if there is a delay in the response packet, and then reset the connection. We can filter the data by including only packets more than 100 ms, and get a simpler option to reproduce the problem than the full network level 7 test in Vegeta. Here are the “pings” of the Kubernetes host using TCP SYN / SYN-ACK on the host “port” of the service (30927) with an interval of 10 ms, filtered by the slowest responses:
theojulienne@shell ~ $ sudo hping3 172.16.47.27 -S -p 30927 -i u10000 | egrep --line-buffered 'rtt=[0-9]{3}\.'
len=46 ip=172.16.47.27 ttl=59 DF id=0 sport=30927 flags=SA seq=1485 win=29200 rtt=127.1 ms
len=46 ip=172.16.47.27 ttl=59 DF id=0 sport=30927 flags=SA seq=1486 win=29200 rtt=117.0 ms
len=46 ip=172.16.47.27 ttl=59 DF id=0 sport=30927 flags=SA seq=1487 win=29200 rtt=106.2 ms
len=46 ip=172.16.47.27 ttl=59 DF id=0 sport=30927 flags=SA seq=1488 win=29200 rtt=104.1 ms
len=46 ip=172.16.47.27 ttl=59 DF id=0 sport=30927 flags=SA seq=5024 win=29200 rtt=109.2 ms
len=46 ip=172.16.47.27 ttl=59 DF id=0 sport=30927 flags=SA seq=5231 win=29200 rtt=109.2 ms
Immediately can make the first observation. The serial numbers and timings show that these are not one-time congestion. The delay often accumulates, and is ultimately processed.
Next, we want to find out which components may be involved in the appearance of congestion. Maybe these are some of the hundreds of iptables rules in NAT? Or some problems with IPIP tunneling on the network? One way to verify this is to verify each step of the system by excluding it. What happens if you remove the NAT and firewall logic, leaving only part of the IPIP:
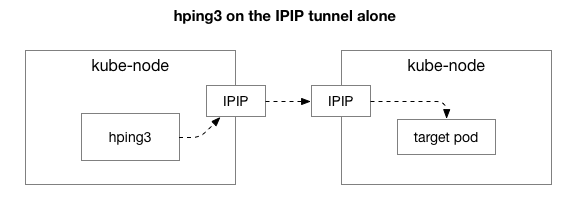
Fortunately, Linux makes it easy to directly access the IP overlay layer if the machine is on the same network:
theojulienne@kube-node-client ~ $ sudo hping3 10.125.20.64 -S -i u10000 | egrep --line-buffered 'rtt=[0-9]{3}\.'
len=40 ip=10.125.20.64 ttl=64 DF id=0 sport=0 flags=RA seq=7346 win=0 rtt=127.3 ms
len=40 ip=10.125.20.64 ttl=64 DF id=0 sport=0 flags=RA seq=7347 win=0 rtt=117.3 ms
len=40 ip=10.125.20.64 ttl=64 DF id=0 sport=0 flags=RA seq=7348 win=0 rtt=107.2 ms
Judging by the results, the problem still remains! This excludes iptables and NAT. So the problem is in TCP? Let's see how regular ICMP ping goes:
theojulienne@kube-node-client ~ $ sudo hping3 10.125.20.64 --icmp -i u10000 | egrep --line-buffered 'rtt=[0-9]{3}\.'
len=28 ip=10.125.20.64 ttl=64 id=42594 icmp_seq=104 rtt=110.0 ms
len=28 ip=10.125.20.64 ttl=64 id=49448 icmp_seq=4022 rtt=141.3 ms
len=28 ip=10.125.20.64 ttl=64 id=49449 icmp_seq=4023 rtt=131.3 ms
len=28 ip=10.125.20.64 ttl=64 id=49450 icmp_seq=4024 rtt=121.2 ms
len=28 ip=10.125.20.64 ttl=64 id=49451 icmp_seq=4025 rtt=111.2 ms
len=28 ip=10.125.20.64 ttl=64 id=49452 icmp_seq=4026 rtt=101.1 ms
len=28 ip=10.125.20.64 ttl=64 id=50023 icmp_seq=4343 rtt=126.8 ms
len=28 ip=10.125.20.64 ttl=64 id=50024 icmp_seq=4344 rtt=116.8 ms
len=28 ip=10.125.20.64 ttl=64 id=50025 icmp_seq=4345 rtt=106.8 ms
len=28 ip=10.125.20.64 ttl=64 id=59727 icmp_seq=9836 rtt=106.1 ms
The results show that the problem has not disappeared. Perhaps this is an IPIP tunnel? Let's simplify the test:
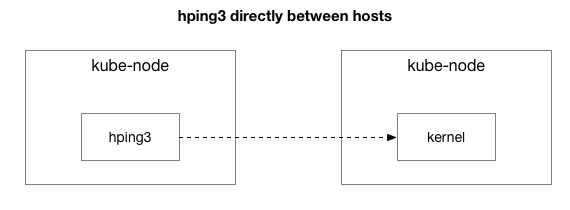
Are all packets sent between these two hosts?
theojulienne@kube-node-client ~ $ sudo hping3 172.16.47.27 --icmp -i u10000 | egrep --line-buffered 'rtt=[0-9]{3}\.'
len=46 ip=172.16.47.27 ttl=61 id=41127 icmp_seq=12564 rtt=140.9 ms
len=46 ip=172.16.47.27 ttl=61 id=41128 icmp_seq=12565 rtt=130.9 ms
len=46 ip=172.16.47.27 ttl=61 id=41129 icmp_seq=12566 rtt=120.8 ms
len=46 ip=172.16.47.27 ttl=61 id=41130 icmp_seq=12567 rtt=110.8 ms
len=46 ip=172.16.47.27 ttl=61 id=41131 icmp_seq=12568 rtt=100.7 ms
len=46 ip=172.16.47.27 ttl=61 id=9062 icmp_seq=31443 rtt=134.2 ms
len=46 ip=172.16.47.27 ttl=61 id=9063 icmp_seq=31444 rtt=124.2 ms
len=46 ip=172.16.47.27 ttl=61 id=9064 icmp_seq=31445 rtt=114.2 ms
len=46 ip=172.16.47.27 ttl=61 id=9065 icmp_seq=31446 rtt=104.2 ms
We simplified the situation to two Kubernetes nodes sending any packet to each other, even ICMP ping. They still see a delay if the target host is “bad” (some worse than others).
Now the last question: why does the delay only occur on kube-node servers? And does it happen when kube-node is the sender or receiver? Fortunately, this is also pretty easy to figure out by sending a packet from a host outside Kubernetes, but with the same "known bad" recipient. As you can see, the problem has not disappeared:
theojulienne@shell ~ $ sudo hping3 172.16.47.27 -p 9876 -S -i u10000 | egrep --line-buffered 'rtt=[0-9]{3}\.'
len=46 ip=172.16.47.27 ttl=61 DF id=0 sport=9876 flags=RA seq=312 win=0 rtt=108.5 ms
len=46 ip=172.16.47.27 ttl=61 DF id=0 sport=9876 flags=RA seq=5903 win=0 rtt=119.4 ms
len=46 ip=172.16.47.27 ttl=61 DF id=0 sport=9876 flags=RA seq=6227 win=0 rtt=139.9 ms
len=46 ip=172.16.47.27 ttl=61 DF id=0 sport=9876 flags=RA seq=7929 win=0 rtt=131.2 ms
Then we perform the same requests from the previous source kube-node to the external host (which excludes the original host, since ping includes both the RX and TX components):
theojulienne@kube-node-client ~ $ sudo hping3 172.16.33.44 -p 9876 -S -i u10000 | egrep --line-buffered 'rtt=[0-9]{3}\.'
^C
--- 172.16.33.44 hping statistic ---
22352 packets transmitted, 22350 packets received, 1% packet loss
round-trip min/avg/max = 0.2/7.6/1010.6 ms
After examining the delayed packet captures, we got some additional information. In particular, that the sender (below) sees this timeout, but the receiver (above) does not see it - see the Delta column (in seconds):

In addition, if you look at the difference in the order of TCP and ICMP packets (by sequence numbers) on the recipient side, then ICMP packets always arrive in the same sequence in which they were sent, but with different timing. At the same time, TCP packets sometimes alternate, and some of them get stuck. In particular, if we examine the ports of the SYN packets, then on the sender side they go in order, but on the recipient side they do not.
There is a subtle difference in how network cards of modern servers (as in our data center) process packets containing TCP or ICMP. When a packet arrives, the network adapter "hashes it over the connection", that is, it tries to break the connections in turns and send each queue to a separate processor core. For TCP, this hash includes both the source and destination IP address and port. In other words, each connection is hashed (potentially) differently. For ICMP, only IP addresses are hashed, since there are no ports.
Another new observation: during this period we see ICMP delays on all communications between the two hosts, but TCP does not. This tells us that the reason is probably due to hashing of the RX queues: it is almost certain that the congestion occurs in the processing of RX packets, rather than in sending responses.
This excludes sending packets from the list of possible reasons. Now we know that the problem with packet processing is on the receiving side on some kube-node servers.
Understanding Package Processing in the Linux Kernel
To understand why the problem occurs with the recipient on some kube-node servers, let's see how the Linux kernel processes packets.
Returning to the simplest traditional implementation, the network card receives the packet and sends an interrupt to the Linux kernel, which is the packet that needs to be processed. The kernel stops another operation, switches the context to the interrupt handler, processes the package, and then returns to the current tasks.

This context switch is slow: the delay was probably invisible on 10-megabyte network cards in the 90s, but on modern 10G cards with a maximum throughput of 15 million packets per second, each core of a small eight-core server can be interrupted millions of times per second.
In order not to constantly deal with interrupt handling, many years ago Linux added NAPI : a network API that all modern drivers use to increase performance at high speeds. At low speeds, the kernel still accepts interrupts from the network card in the old way. As soon as a sufficient number of packets arrives that exceeds the threshold, the kernel disables interrupts and instead starts polling the network adapter and taking packets in batches. Processing is performed in softirq, that is, in the context of software interrupts after system calls and hardware interrupts when the kernel (unlike user space) is already running.
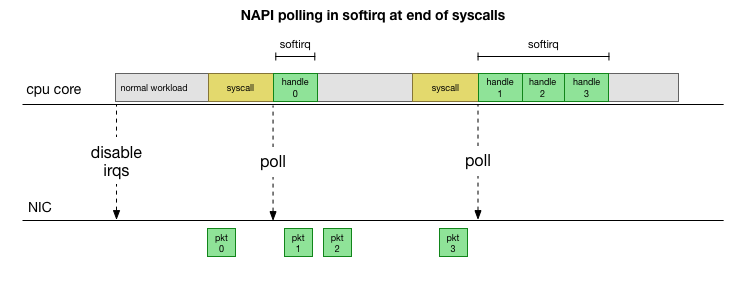
This is much faster, but causes a different problem. If there are too many packets, all the time it takes to process packets from the network card, and user space processes do not have time to actually empty these queues (reading from TCP connections, etc.). In the end, the queues fill up, and we begin to drop packets. Trying to find a balance, the kernel sets a budget for the maximum number of packets processed in the softirq context. Once this budget is exceeded, a separate
ksoftirqd
thread
ksoftirqd
(you will see one of them in
ps
for each core), which processes these softirqs outside the normal syscall / interrupt path. This thread is planned using a standard process scheduler that attempts to distribute resources fairly.
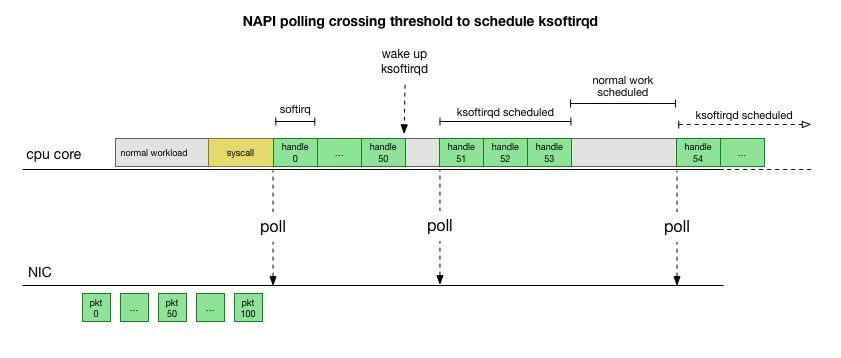
After examining how the kernel processes packets, you can see that there is a certain probability of congestion. If softirq calls are received less frequently, packets will have to wait some time for processing in the RX queue on the network card. Perhaps this is due to some task blocking the processor core, or something else prevents the kernel from starting softirq.
We narrow down the processing to the kernel or method
Softirq delays are just an assumption. But it makes sense, and we know that we are seeing something very similar. Therefore, the next step is to confirm this theory. And if it is confirmed, then find the reason for the delays.
Back to our slow packages:
len=46 ip=172.16.53.32 ttl=61 id=29573 icmp_seq=1953 rtt=99.3 ms
len=46 ip=172.16.53.32 ttl=61 id=29574 icmp_seq=1954 rtt=89.3 ms
len=46 ip=172.16.53.32 ttl=61 id=29575 icmp_seq=1955 rtt=79.2 ms
len=46 ip=172.16.53.32 ttl=61 id=29576 icmp_seq=1956 rtt=69.1 ms
len=46 ip=172.16.53.32 ttl=61 id=29577 icmp_seq=1957 rtt=59.1 ms
len=46 ip=172.16.53.32 ttl=61 id=29790 icmp_seq=2070 rtt=75.7 ms
len=46 ip=172.16.53.32 ttl=61 id=29791 icmp_seq=2071 rtt=65.6 ms
len=46 ip=172.16.53.32 ttl=61 id=29792 icmp_seq=2072 rtt=55.5 ms
As discussed earlier, these ICMP packets are hashed into a single NIC RX queue and processed by a single CPU core. If we want to understand how Linux works, it’s useful to know where (on which CPU core) and how (softirq, ksoftirqd) these packages are processed to track the process.
Now it's time to use tools that allow real-time monitoring of the Linux kernel. Here we used bcc . This toolkit allows you to write small C programs that intercept arbitrary functions in the kernel and buffer events into a user-space Python program that can process them and return you the result. Hooks for arbitrary functions in the kernel are complex, but the utility is designed for maximum security and is designed to track precisely such production problems that are not easy to reproduce in a testing or development environment.
The plan here is simple: we know that the kernel processes these ICMP pings, so we hook the icmp_echo kernel function , which receives the incoming ICMP packet "echo request" and initiates the sending of the ICMP response "echo response". We can identify the package by increasing the icmp_seq number, which shows
hping3
above.
The bcc script code looks complicated, but it's not as scary as it seems. The
icmp_echo
function passes
struct sk_buff *skb
: this is the packet with the "echo request" request. We can track it, pull out the
echo.sequence
sequence (which maps to
icmp_seq
from hping3
), and send it to user space. It is also convenient to capture the current process name / identifier. Below are the results that we see directly during the processing of packages by the kernel:
  TGID PID PROCESS NAME ICMP_SEQ
 0 0 swapper / 11,770
 0 0 swapper / 11 771
 0 0 swapper / 11,772
 0 0 swapper / 11 773
 0 0 swapper / 11,774
 20041 20086 prometheus 775
 0 0 swapper / 11,776
 0 0 swapper / 11,777
 0 0 swapper / 11 778
 4512 4542 spokes-report-s 779
Here it should be noted that in the context of
softirq
processes that made system calls appear as “processes”, although in fact this kernel safely processes packets in the context of the kernel.
With this tool, we can establish the connection of specific processes with specific packages that show a delay in
hping3
. We make a simple
grep
on this capture for specific
icmp_seq
values. Packets corresponding to the above icmp_seq values were marked with their RTT, which we observed above (in parentheses are the expected RTT values for packets that we filtered due to RTT values less than 50 ms):
  TGID PID PROCESS NAME ICMP_SEQ ** RTT
 -
 10137 10436 cadvisor 1951
 10137 10436 cadvisor 1952
 76 76 ksoftirqd / 11 1953 ** 99ms
 76 76 ksoftirqd / 11 1954 ** 89ms
 76 76 ksoftirqd / 11 1955 ** 79ms
 76 76 ksoftirqd / 11 1956 ** 69ms
 76 76 ksoftirqd / 11 1957 ** 59ms
 76 76 ksoftirqd / 11 1958 ** (49ms)
 76 76 ksoftirqd / 11 1959 ** (39ms)
 76 76 ksoftirqd / 11 1960 ** (29ms)
 76 76 ksoftirqd / 11 1961 ** (19ms)
 76 76 ksoftirqd / 11 1962 ** (9ms)
 -
 10137 10436 cadvisor 2068
 10137 10436 cadvisor 2069
 76 76 ksoftirqd / 11 2070 ** 75ms
 76 76 ksoftirqd / 11 2071 ** 65ms
 76 76 ksoftirqd / 11 2072 ** 55ms
 76 76 ksoftirqd / 11 2073 ** (45ms)
 76 76 ksoftirqd / 11 2074 ** (35ms)
 76 76 ksoftirqd / 11 2075 ** (25ms)
 76 76 ksoftirqd / 11 2076 ** (15ms)
 76 76 ksoftirqd / 11 2077 ** (5ms)
The results tell us a few things. First, the
ksoftirqd/11
context handles all of these packages. This means that for this particular pair of machines, ICMP packets were hashed on the host 11 core. We also see that at each traffic jam there are packets that are processed in the context of the
cadvisor
system call. Then
ksoftirqd
takes on the task and fulfills the accumulated queue: exactly the number of packets that accumulated after
cadvisor
.
The fact that a
cadvisor
always works immediately before this implies his involvement in the problem. Ironically, the purpose of cadvisor is to “analyze resource utilization and performance characteristics of running containers,” rather than cause this performance problem.
As with other aspects of container handling, these are all extremely advanced tools from which performance problems can be expected in some unforeseen circumstances.
What does cadvisor do that slows the packet queue?
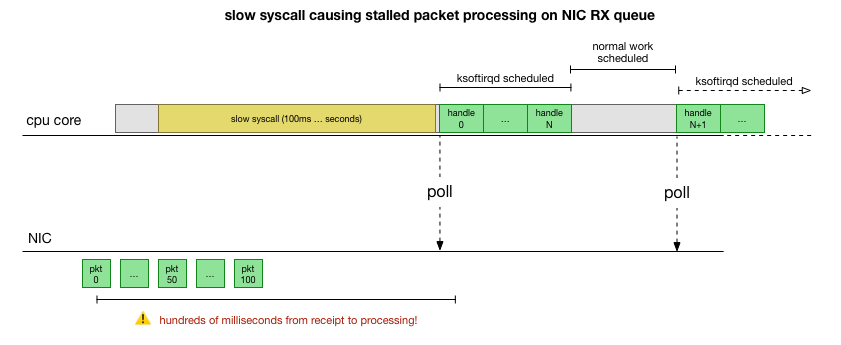
Now we have a pretty good understanding of how the failure occurs, which process causes it, and on which CPU. We see that due to hard locking, the Linux kernel does not have time to schedule
ksoftirqd
. And we see that packages are processed in the context of
cadvisor
. It is logical to assume that
cadvisor
starts a slow syscall, after which all packets accumulated at this time are processed:
This is a theory, but how to test it? What we can do is to track the operation of the CPU core throughout this process, find the point where the budget is exceeded by the number of packets and ksoftirqd is called, and then look a little earlier - what exactly worked on the CPU core just before that moment. It's like an x-ray of a CPU every few milliseconds. It will look something like this:
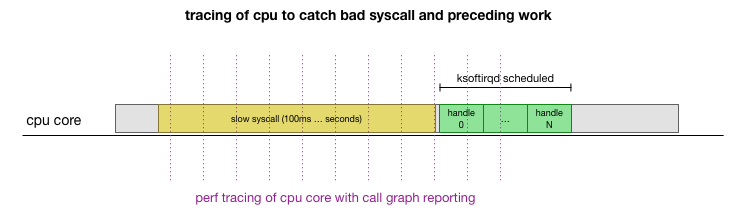
Conveniently, all this can be done with existing tools. For example, perf record checks the specified CPU core with the indicated frequency and can generate a schedule of calls to a running system, including both user space and the Linux kernel. You can take this record and process it using a small fork of the FlameGraph program from Brendan Gregg, which preserves the stack trace order. We can save one-line stack traces every 1 ms, and then select and save the sample for 100 milliseconds before
ksoftirqd
gets into the trace:
# record 999 times a second, or every 1ms with some offset so not to align exactly with timers
sudo perf record -C 11 -g -F 999
# take that recording and make a simpler stack trace.
sudo perf script 2>/dev/null | ./FlameGraph/stackcollapse-perf-ordered.pl | grep ksoftir -B 100
Here are the results:
( , )
cadvisor;[cadvisor];[cadvisor];[cadvisor];[cadvisor];[cadvisor];[cadvisor];[cadvisor];[cadvisor];[cadvisor];[cadvisor];[cadvisor];[cadvisor];[cadvisor];[cadvisor];entry_SYSCALL_64_after_swapgs;do_syscall_64;sys_read;vfs_read;seq_read;memcg_stat_show;mem_cgroup_nr_lru_pages;mem_cgroup_node_nr_lru_pages cadvisor;[cadvisor];[cadvisor];[cadvisor];[cadvisor];[cadvisor];[cadvisor];[cadvisor];[cadvisor];[cadvisor];[cadvisor];[cadvisor];[cadvisor];[cadvisor];[cadvisor];entry_SYSCALL_64_after_swapgs;do_syscall_64;sys_read;vfs_read;seq_read;memcg_stat_show;mem_cgroup_nr_lru_pages;mem_cgroup_node_nr_lru_pages cadvisor;[cadvisor];[cadvisor];[cadvisor];[cadvisor];[cadvisor];[cadvisor];[cadvisor];[cadvisor];[cadvisor];[cadvisor];[cadvisor];[cadvisor];[cadvisor];[cadvisor];entry_SYSCALL_64_after_swapgs;do_syscall_64;sys_read;vfs_read;seq_read;memcg_stat_show;mem_cgroup_iter cadvisor;[cadvisor];[cadvisor];[cadvisor];[cadvisor];[cadvisor];[cadvisor];[cadvisor];[cadvisor];[cadvisor];[cadvisor];[cadvisor];[cadvisor];[cadvisor];[cadvisor];entry_SYSCALL_64_after_swapgs;do_syscall_64;sys_read;vfs_read;seq_read;memcg_stat_show;mem_cgroup_nr_lru_pages;mem_cgroup_node_nr_lru_pages cadvisor;[cadvisor];[cadvisor];[cadvisor];[cadvisor];[cadvisor];[cadvisor];[cadvisor];[cadvisor];[cadvisor];[cadvisor];[cadvisor];[cadvisor];[cadvisor];[cadvisor];entry_SYSCALL_64_after_swapgs;do_syscall_64;sys_read;vfs_read;seq_read;memcg_stat_show;mem_cgroup_nr_lru_pages;mem_cgroup_node_nr_lru_pages ksoftirqd/11;ret_from_fork;kthread;kthread;smpboot_thread_fn;smpboot_thread_fn;run_ksoftirqd;__do_softirq;net_rx_action;ixgbe_poll;ixgbe_clean_rx_irq;napi_gro_receive;netif_receive_skb_internal;inet_gro_receive;bond_handle_frame;__netif_receive_skb_core;ip_rcv_finish;ip_rcv;ip_forward_finish;ip_forward;ip_finish_output;nf_iterate;ip_output;ip_finish_output2;__dev_queue_xmit;dev_hard_start_xmit;ipip_tunnel_xmit;ip_tunnel_xmit;iptunnel_xmit;ip_local_out;dst_output;__ip_local_out;nf_hook_slow;nf_iterate;nf_conntrack_in;generic_packet;ipt_do_table;set_match_v4;ip_set_test;hash_net4_kadt;ixgbe_xmit_frame_ring;swiotlb_dma_mapping_error;hash_net4_test ksoftirqd/11;ret_from_fork;kthread;kthread;smpboot_thread_fn;smpboot_thread_fn;run_ksoftirqd;__do_softirq;net_rx_action;gro_cell_poll;napi_gro_receive;netif_receive_skb_internal;inet_gro_receive;__netif_receive_skb_core;ip_rcv_finish;ip_rcv;ip_forward_finish;ip_forward;ip_finish_output;nf_iterate;ip_output;ip_finish_output2;__dev_queue_xmit;dev_hard_start_xmit;dev_queue_xmit_nit;packet_rcv;tpacket_rcv;sch_direct_xmit;validate_xmit_skb_list;validate_xmit_skb;netif_skb_features;ixgbe_xmit_frame_ring;swiotlb_dma_mapping_error;__dev_queue_xmit;dev_hard_start_xmit;__bpf_prog_run;__bpf_prog_run
There is a lot of things here, but the main thing is that we find the “cadvisor before ksoftirqd” template that we saw earlier in the ICMP tracer. What does it mean?
Each line is a trace of the CPU at a particular point in time. Each call down the stack in a line is separated by a semicolon. In the middle of the lines we see syscall called:
read(): .... ;do_syscall_64;sys_read; ...
read(): .... ;do_syscall_64;sys_read; ...
Thus, cadvisor spends a lot of time on the
read()
system call related to
mem_cgroup_*
functions (top of the call stack / end of line).
In the call trace, it’s inconvenient to see what exactly is being read, so run
strace
and see what the cadvisor does, and find system calls longer than 100 ms:
theojulienne@kube-node-bad ~ $ sudo strace -p 10137 -T -ff 2>&1 | egrep '<0\.[1-9]'
[pid 10436] <... futex resumed> ) = 0 <0.156784>
[pid 10432] <... futex resumed> ) = 0 <0.258285>
[pid 10137] <... futex resumed> ) = 0 <0.678382>
[pid 10384] <... futex resumed> ) = 0 <0.762328>
[pid 10436] <... read resumed> "cache 154234880\nrss 507904\nrss_h"..., 4096) = 658 <0.179438>
[pid 10384] <... futex resumed> ) = 0 <0.104614>
[pid 10436] <... futex resumed> ) = 0 <0.175936>
[pid 10436] <... read resumed> "cache 0\nrss 0\nrss_huge 0\nmapped_"..., 4096) = 577 <0.228091>
[pid 10427] <... read resumed> "cache 0\nrss 0\nrss_huge 0\nmapped_"..., 4096) = 577 <0.207334>
[pid 10411] <... epoll_ctl resumed> ) = 0 <0.118113>
[pid 10382] <... pselect6 resumed> ) = 0 (Timeout) <0.117717>
[pid 10436] <... read resumed> "cache 154234880\nrss 507904\nrss_h"..., 4096) = 660 <0.159891>
[pid 10417] <... futex resumed> ) = 0 <0.917495>
[pid 10436] <... futex resumed> ) = 0 <0.208172>
[pid 10417] <... futex resumed> ) = 0 <0.190763>
[pid 10417] <... read resumed> "cache 0\nrss 0\nrss_huge 0\nmapped_"..., 4096) = 576 <0.154442>
As you might expect, here we see slow
read()
calls. From the contents of the read operations and the
mem_cgroup
context,
mem_cgroup
can be seen that these
read()
calls refer to the
memory.stat
file, which shows the memory usage and cgroup limitations (resource isolation technology in Docker). The cadvisor tool polls this file for resource usage information for containers. Let's check if this kernel or cadvisor does something unexpected:
theojulienne@kube-node-bad ~ $ time cat /sys/fs/cgroup/memory/memory.stat >/dev/null
real 0m0.153s
user 0m0.000s
sys 0m0.152s
theojulienne@kube-node-bad ~ $
Now we can reproduce the bug and understand that the Linux kernel is facing pathology.
What makes reading so slow?
At this stage, it is much easier to find other users' messages about similar problems. As it turned out, in the cadvisor tracker this bug was reported as a problem of excessive CPU usage , just no one noticed that the delay was also randomly reflected in the network stack. Indeed, it was noticed that cadvisor consumes more processor time than expected, but this was not given much importance, because our servers have a lot of processor resources, so we did not carefully study the problem.
The problem is that control groups (cgroups) take into account the memory usage inside the namespace (container). When all processes in this cgroup terminate, Docker frees up a control group of memory. However, "memory" is not just the memory of a process. Although the process memory itself is no longer used, it turns out that the kernel also assigns cached content, such as dentries and inodes (directory and file metadata), which are cached in memory cgroup. From the description of the problem:
cgroups zombies: control groups in which there are no processes and they are deleted, but for which memory is still allocated (in my case, from the dentry cache, but it can also be allocated from the page cache or tmpfs).
The kernel checking all the pages in the cache when cgroup is freed up can be very slow, so the lazy process is chosen: wait until these pages are requested again, and even when the memory is really needed, finally clear cgroup. Until now, cgroup is still taken into account when collecting statistics.
In terms of performance, they sacrificed memory for performance: speeding up the initial cleanup due to the fact that a bit of cached memory remains. This is normal. When the kernel uses the last part of the cached memory, cgroup is eventually cleared, so this cannot be called a “leak”. Unfortunately, the specific implementation of the
memory.stat
search mechanism in this kernel version (4.9), combined with the huge amount of memory on our servers, leads to the fact that it takes much longer to restore the latest cached data and clear cgroup zombies.
It turns out that there were so many cgroup zombies on some of our nodes that reading and latency exceeded a second.
A workaround for the cadvisor problem is to immediately clear dentries / inodes caches throughout the system, which immediately eliminates read latency as well as network latency on the host, since deleting the cache includes cgroup zombie cached pages, and they are also freed. This is not a solution, but confirms the cause of the problem.
It turned out that newer versions of the kernel (4.19+) improved the performance of calling
memory.stat
, so switching to this kernel fixed the problem. At the same time, we had tools for detecting problem nodes in Kubernetes clusters, gracefully draining them and rebooting. We combed through all the clusters, found the nodes with a sufficiently high delay and rebooted them. This gave us time to update the OS on other servers.
Summarizing
Since this bug stopped the processing of NIC RX queues for hundreds of milliseconds, it simultaneously caused a large delay on short connections and a delay in the middle of the connection, for example, between MySQL queries and response packets.
Understanding and maintaining the performance of the most fundamental systems, such as Kubernetes, is critical to the reliability and speed of all services based on them. All running systems benefit from Kubernetes performance improvements.