Note: the full source code for this project can be found [ here ]. Since it is part of a larger project, I recommend watching the commit at the time this article was released, or the
/source/helpers/arraymath.h
file, as well as
/source/world/blueprint.cpp
.
In this article I want to talk in detail about the principles of using Markov chains and statistics for the procedural generation of 3D buildings and other systems.
I will explain the mathematical foundations of the system and try to make the explanation as general as possible so that you can apply this concept in other situations, for example, to generate 2D dungeons. The explanation will be accompanied by images and source code.
This method is a generalized method for the procedural generation of systems that satisfy certain requirements, so I recommend reading at least until the end of the first section so that you can understand whether this technique can be useful in your case, because below I explain the necessary requirements.
The results will be used in my voxel engine so that task bots can build buildings, and then cities. At the very end of the article there is an example!
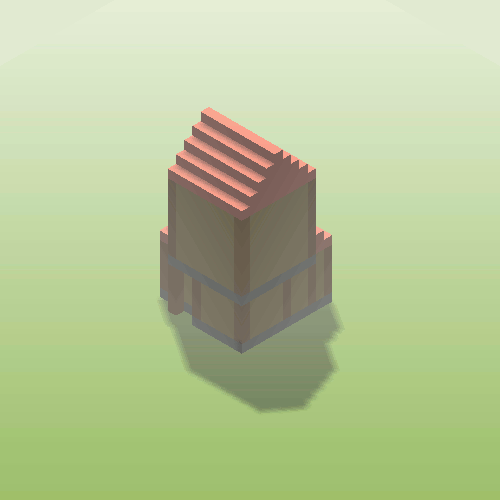
A couple of examples with the results.
The basics
Markov Chains
Markov chains are a sequence of states along which a system moves, described by transitions in time. Transitions between states are stochastic, that is, they are described by probabilities, which are a characteristic of the system.
The system is defined by the state space, which is the space of all possible system configurations. If the system is described correctly, then we can also describe the transitions between states as discrete steps.
It should be noted that from one state of the system there are often several possible discrete transitions, each of which leads to a different state of the system.
The probability of transition from state i to state j is equal to:
The Markov process is the process of studying this state space with the help of probabilities transferred to it.
The important thing is that Markov processes “have no memory”. It just means that the probabilities of transition from the current state to the new one depend only on the current state and no longer on any other conditions visited earlier.
Example: text generation
A system is a sequence of bits. The state space is all possible sequences of bits. A discrete transition will change one bit from 0 to 1 or 1 to 0. If the system has n bits, then from each state we have n possible transitions to a new state. The Markov process will consist in the study of the state space by changing the values of bits in a sequence using certain probabilities.
Example: weather forecasting
The system is the current weather conditions. The state space is all possible states in which the weather can be (for example, “rainy”, “cloudy”, “sunny”, etc.). The transition will be a switch from any state to another state in which we can set the probability of the transition (for example, “what is the probability that if it is sunny today, then tomorrow it will rain, regardless of yesterday’s weather?”).
Monte Carlo Method for Markov Chains
Since transitions between states are determined by probabilities, we can also set the probability of a “stable” being in any state (or, if time tends to infinity, the average time that we will be in a particular state). This is an internal distribution of states.
Then the Monte Carlo algorithm for Markov chains (Markov-Chain Monte-Carlo, MCMC) is a technique for obtaining a sample from the state space. Sampling (sampling) means the choice of state based on the probability of selection, taking into account the internal distribution.
They say that the probability of being in a state is proportional * to a certain cost function that gives an “estimate” of the current state in which the system is located. It is believed that if the costs are low, then the probability of being in this state is high, and this ratio is monotonous. The cost function is defined as follows:
Note: I am not sure if the word “proportional” is used correctly, because the ratio is not necessarily linear.
Then a sample from the state distribution will return a configuration with low costs (or a good “estimate”) with a higher probability!
Even with an extremely large state space (possibly infinite, but “countably infinite”), regardless of the complexity of the system, the MCMC algorithm will find a solution with low costs if we give it enough time for convergence.
Such a performance of state space research is a standard technique of stochastic optimization and has many applications in areas such as machine learning.
Gibbs distribution
Note: if this section is not clear to you, you can safely skip it. You can still take advantage of the implementation of the system.
After we have determined the costs for a possible condition, how do we determine the likelihood of this condition?
Solution: The Gibbs distribution is the distribution of maximum entropy for a given set of constraints.
In essence, this means that if we set many constraints on the probabilities of the system, then the Gibbs distribution will create the “least amount of assumptions” about the shape of the distribution.
Note: the Gibbs distribution is also the distribution with the least sensitivity to variations in constraints (according to the Kullback-Leibler divergence metric).
The only restriction that we impose on the distribution of states is the cost function, so we use it in the Gibbs distribution to calculate the probability of transition between states:
Where Z is the partition function of the set of transitions from state i. This is a normalizing factor, ensuring that the sum of the transition probabilities from any state is 1.
Note that if we decide that the next state will be the same state, then the relative costs are zero, that is, the probability after normalization will be non-zero (due to the shape of the distribution with the indicator)! This means that in many transitions it is necessary to include the probability of unchanged states.
It is also worth noting that the Gibbs distribution is parameterized by the “computational temperature” T.
One of the key advantages of using probabilities in the study of the state space is that the system can perform transitions to more expensive states (since they have a nonzero transition probability), turning the algorithm into a “non-greedy” optimization method.
Note that as the temperature tends to infinity, the probability of any individual transition tends to unity in such a way that when the set of probabilities of all transitions from the state is normalized, they become equally probable (or the Gibbs distribution approaches the normal distribution), despite the fact that their costs are greater!
As the computational temperature approaches zero, transitions with lower costs become more likely, that is, the probability of preferred transitions increases.
When performing research / optimization of the state space, we gradually lower the temperature. This process is called "simulated annealing . " Thanks to this, at the beginning we can easily get out of the local minimum, and in the end we can choose the best solutions.
When the temperature is low enough, then all the probabilities tend to zero, except for the probability of no transition!
This is because only the absence of a transition has a zero cost difference, that is, being in the same state does not depend on temperature. Due to the shape of the exponential function at T = 0, this turns out to be the only probability with a nonzero value, that is, after normalization, it turns into unity. Consequently, our system will converge to a stable point and further cooling will no longer be necessary. This is an integral property of probability generation using the Gibbs distribution.
The process of convergence of the system can be adjusted by changing the cooling rate!
If cooling is slower, then as a result we usually come to a solution with lower costs (to a certain extent), but at the cost of more steps of convergence. If cooling is faster, then it is more likely that the system in the early stages will fall into the trap of a subregion with greater costs, that is, we will get "less optimal" results.
Consequently, the Markov process does not just generate random results, but tries to generate “good” results, and with high probability it will succeed!
By definition of arbitrary cost functions, a unique optimum does not have to exist. This method of probabilistic optimization generates only approaching the optimum, trying to minimize the cost function, and due to sampling, it will generate different results each time (if the random number generator has a different seed).
The sampling process itself can be performed using the inverse transformation method over the mass distribution function of our discrete set of transitions. Later I will show how this is done.
Procedural Generation
How is this method useful for procedural generation?
In some systems, it is often difficult to define a simple algorithm that generates good results, especially in the case of complex systems.
Setting arbitrary generation rules is not only difficult, but also limited only by our imagination and the processing of boundary cases.
If the system satisfies a certain set of requirements, then the use of MCMC allows us not to worry about the selection of an algorithm or rules. Instead, we define a method for generating any possible result, and consciously choose a good one based on its “assessment”.
The following requirements are presented:
- The system may be in a discrete (possibly infinite) state configuration.
- We can define discrete transitions between states.
- We can set a cost function that estimates the current state of the system.
Below I will give some other examples in which, in my opinion, this method can be applied.
Implementation
Pseudo code
In our implementation, we want to achieve the following:
- Set system status.
- Set all possible transitions to the next state.
- Calculate the costs of the current state.
- Calculate the costs of all possible next states (or a subset of them).
- Using the Gibbs distribution, calculate the probability of transitions.
- Sample (sample) transitions using probabilities.
- Perform a sample transition.
- Reduce computational temperature.
- Repeat steps until you get satisfactory results.
In the form of pseudo-code, the MCMC algorithm is as follows:
// MCMC T = 200; // State s = initialState(); Transitions t[n] = {...} //n thresh = 0.01; // ( ) // , while(T > thresh){ // curcost = costfunc(s); newcost[n] = {0}; // newcost 0 probability[n] = {0}; // 0 // for(i = 0; i < n; i++){ newcost[i] = costfunc(doTransition(s, t[i])); probability[i] = exp(-(newcost[i] - curcost)/T); } // probability /= sum(probability); // sampled = sample_transition(t, probability); // s = doTransition(s, sampled); // T *= 0.975; }
3D building generation
State Space and Transitions
To generate buildings in 3D, I generate many rooms with the volume specified by the bounding box.
struct Volume{ // glm::vec3 a; glm::vec3 b; void translate(glm::vec3 shift); int getVol(); }; // int Volume::getVol(){ return abs((bx-ax)*(by-ay)*(bz-az)); } // void Volume::translate(glm::vec3 shift){ a += shift; b += shift; }
If I generate n rooms, then the state of the system is the configuration of bounding boxes in 3D space.
It should be noted that the possible configurations for these volumes are endless, but countably endless (they can be listed in an infinite amount of time)!
// ( !) std::vector<Volume> rooms; // N for(int i = 0; i < n; i++){ // Volume x; xa = glm::vec3(0); xb = glm::vec3(rand()%4+5); // // . rooms.push_back(x); } //...
Many possible transitions will be a shift of rooms in one of the six directions of space by one step, including the absence of a transition:
//... // std::array<glm::vec3, 7> moves = { glm::vec3( 0, 0, 0), // ! glm::vec3( 1, 0, 0), glm::vec3(-1, 0, 0), glm::vec3( 0, 1, 0), glm::vec3( 0,-1, 0), glm::vec3( 0, 0, 1), glm::vec3( 0, 0,-1), }; //...
Note: it is important that we keep the system able to remain in its current state!
Cost function
I wanted the volumes in 3D space to behave like “magnets”, that is:
- If their volumes intersect, then this is bad.
- If their surfaces touch, then this is good.
- If they don’t touch at all, then this is bad.
- If they touch the floor, that's good.
For two cuboids in 3D space, we can easily define a bounding box:
Volume boundingBox(Volume v1, Volume v2){ // Volume bb; // bb.ax = (v1.ax < v2.ax)?v1.ax:v2.ax; bb.ay = (v1.ay < v2.ay)?v1.ay:v2.ay; bb.az = (v1.az < v2.az)?v1.az:v2.az; // bb.bx = (v1.bx > v2.bx)?v1.bx:v2.bx; bb.by = (v1.by > v2.by)?v1.by:v2.by; bb.bz = (v1.bz > v2.bz)?v1.bz:v2.bz; return bb; }
Using the bounding box of volumes, we can calculate one 3D vector that gives me information about the intersection of two volumes.
If the length of the parallelepiped along one side is greater than the sum of the lengths of two volumes along this side, then from this side they do not touch. If they are equal, then the surfaces touch, and if less, then the volumes intersect.
// 3 glm::vec3 overlapVolumes(Volume v1, Volume v2){ // Volume bb = boundingBox(v1, v2); // glm::vec3 ext1 = glm::abs(v1.b - v1.a); // v1 3 glm::vec3 ext2 = glm::abs(v2.b - v2.a); // v2 3 glm::vec3 extbb = glm::abs(bb.b - bb.a); // // return ext1 + ext2 - extbb; }
This code is used to calculate the number of quantities for which I form a weighted amount, which is ultimately used as a cost.
int volumeCostFunction(std::vector<Volume> rooms){ // int metric[6] = { 0, // 0, // 0, // 0, // 0, // , 0};// int weight[6] = {2, 4, -5, -5, -5, 5}; // for(unsigned int i = 0; i < rooms.size(); i++){ // for(unsigned int j = 0; j < rooms.size(); j++){ // , . if(i == j) continue; // . glm::vec3 overlap = overlapVolumes(rooms[i], rooms[j]); // glm::vec3 posOverlap = glm::clamp(overlap, glm::vec3(0), overlap); metric[0] += glm::abs(posOverlap.x*posOverlap.y*posOverlap.z); // // glm::vec3 negOverlap = glm::clamp(overlap, overlap, glm::vec3(0)); metric[1] += glm::abs(negOverlap.x*negOverlap.y*negOverlap.z); // // if(overlap.y == 0){ metric[2] += overlap.x*overlap.z; } // (X) if(overlap.x == 0){ // 0, , .. overlap.z = 0 metric[3] += overlap.z*overlap.y; } // (Z) if(overlap.z == 0){ // 0, , .. overlap.x = 0 metric[4] += overlap.x*overlap.y; } } // , - . if(rooms[i].ay == 0){ // , , . metric[4] += rooms[i].ax*rooms[i].az; } //, ! if(rooms[i].ay < 0){ //, if(rooms[i].by < 0){ metric[5] += rooms[i].getVol(); } else{ metric[5] += abs(rooms[i].ay)*(rooms[i].bz-rooms[i].az)*(rooms[i].bx-rooms[i].ax); } } } // Metric * Weights return metric[0]*weight[0] + metric[1]*weight[1] + metric[2]*weight[2] + metric[3]*weight[3] + metric[4]*weight[4] + metric[5]*weight[5]; }
Note: “positive intersection volume” means that the volumes actually intersect. “Negative intersection volume” means that they do not touch at all and the intersection is defined by the volume in space located between the two nearest points of two cuboids in 3D space.
Weights are chosen in such a way as to give priority to one thing and fine others. For example, here I severely fine the rooms located under the floor, and also increase the priority of those whose surface areas touch (more than I fine the intersection of volumes).
I generate costs for all pairs of rooms, ignoring rooms that are paired with themselves.
Finding a low cost solution
The convergence is performed as described in the pseudo-code. When making the transition, I only move one room at a time. This means that with n rooms and 7 possible transitions, I need to calculate 7 * n probabilities, and I select from all of them, moving only that room, which is probably the most preferable.
// float T = 250; while(T > 0.1){ // std::vector<std::array<double, moves.size()>> probabilities; // () int curEnergy = volumeCostFunction(rooms); // ... for(int i = 0; i < n; i++){ // std::array<double, moves.size()> probability; // , for(unsigned int m = 0; m < moves.size(); m++){ // . rooms[i].translate(moves[m]); // ! probability[m] = exp(-(double)(volumeCostFunction(rooms) - curEnergy)/T); // rooms[i].translate(-moves[m]); } // probabilities.push_back(probability); } // ( ) double Z = 0; for(unsigned int i = 0; i < probabilities.size(); i++){ for(unsigned int j = 0; j < probabilities[i].size(); j++){ Z += probabilities[i][j]; } } // for(unsigned int i = 0; i < probabilities.size(); i++){ for(unsigned int j = 0; j < probabilities[i].size(); j++){ probabilities[i][j] /= Z; } } // (CDF) ( ) std::vector<double> cdf; for(unsigned int i = 0; i < probabilities.size(); i++){ for(unsigned int j = 0; j < probabilities[i].size(); j++){ if(cdf.empty()) cdf.push_back(probabilities[i][j]); else cdf.push_back(probabilities[i][j] + cdf.back()); } } // std::random_device rd; std::mt19937 e2(rd()); std::uniform_real_distribution<> dist(0, 1); double uniform = dist(e2); int sampled_index = 0; // CDF for(unsigned int i = 0; i < cdf.size(); i++){ // , ... if(cdf[i] > uniform){ sampled_index = i; break; } } // int _roomindex = sampled_index/moves.size(); int _moveindex = sampled_index%moves.size(); // rooms[_roomindex].translate(moves[_moveindex]); // T T *= 0.99; // !!! } //!! //...
Sampling is performed by the formation of a cumulative distribution function over the mass distribution function of all possible transitions; this operation is called “inverse transform sampling”.
This is done by generating the accumulated sum of transition probabilities, which gives us the cumulative distribution function (CDF). For sampling, we generate a random variable with a uniform distribution between 0 and 1. Since the first element of the CDF is zero and the last one, we just need to find "in which index of the CDF array is our sampled variable with uniform distribution", and this will be sampled transition index. Here is an illustration:

Instead of a continuous function, there may be discrete steps. More details can be read here .
In addition, I have room volume data in 3D space!
I use them to generate a “schema” using the blueprint class, applying a theme to known bulk data. So houses get their appearance. The blueprint class is described in the previous article [ here ] ([ translation ] on Habré). For complete generation of the house from these volumes, see the source code.
results
The results for such a generalized method are quite good. The only thing I had to set up was the correct priority and penalty weights in the cost function.
A few examples of building generation using this algorithm and the theme applied to them.
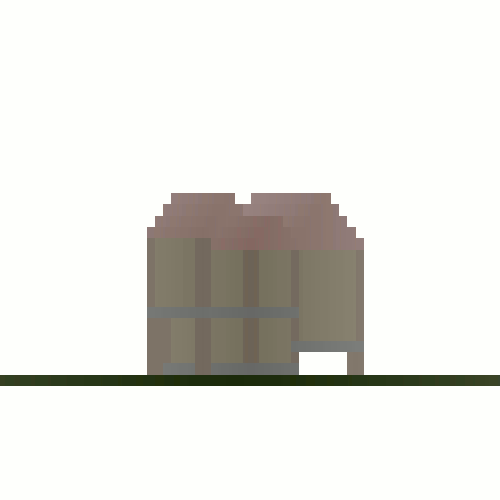
Side view (other buildings).
The convergence itself is very fast, especially for a small number of rooms (3-5), because calculating bounding boxes and estimating the cost function is very simple.
In the current version, houses have no doors and windows, but this is more a matter of interpreting 3D volume data, rather than a task for the MCMC algorithm.
Sometimes the method gives ugly results, because this is a stochastic process, so before placing a building in the world, you need to check its correctness, especially if the cost function is not very reliable. I suspect that ugliness mainly occurs in the first few steps when the temperature is high.
Usually defects appear as rooms or rooms separated from the building. hanging in the air (on high stilts).
Extensions and other systems
Obviously, my technique with 3D volumes is easy to transfer to the 2D world, simply by reducing the dimension of the task by one.
That is, it can be used for tasks such as procedural generation of dungeons or rooms in 2D games with a top view - attaching rooms to each other uses a cost function similar to that described above.
A possible way to make the generation more interesting is to first generate a graph of rooms, each of which has its own type, and then set a cost function that stimulates the connection of rooms connected in the graph on physical surfaces.
The graph itself can be generated using the MCMC algorithm, where the creation and destruction of connections between rooms will be considered separate transitions that stimulate connections between rooms of certain types (bedrooms are more likely to connect to corridors and less likely to to the environment, etc.).
Other possible applications:
- Labyrinth generation; costs are set depending on the tortuosity of the maze, and the transitions are the placement / removal of walls or corridors.
- Networks of roads, installation and destruction of connections between nodes of the graph based on distance, terrain or other factors used as costs.
- Probably many others!
An interesting note: simulated annealing and MCMC algorithms can be used for tasks such as the "traveling salesman problem", the famous NP-hard problem. System status is a route, transitions can be switching route nodes, and costs can be a total distance!
Application for Task Bots
I hope that thanks to this system, task bots will be able to create their own knowledge in the future in accordance with their needs.
Here is a video of how the bot builds a house generated by this algorithm:
( , ). . ( ) . , . , . - , , .