After deploying all this, it was noticed that RQ workers require much more computing resources to solve the same volume of tasks that Celery used to solve.
The material, the translation of which we publish today, is dedicated to the story of how Redash found out the cause of the problem and coped with it.
A few words about the differences between Celery and RQ
Celery and RQ have the concept of process workers. Both there and there, for the organization of parallel tasks, creation of forks is used. When the Celery worker starts, several fork processes are created, each of which autonomously processes tasks. In the case of RQ, the instance of the worker contains only one subprocess (known as the "workhorse"), which performs one task, and then is destroyed. When the worker downloads the next task from the queue, he creates a new “workhorse”.
When working with RQ, you can achieve the same level of parallelism as when working with Celery, simply by running more worker processes. However, there is one subtle difference between Celery and RQ. In Celery, a worker creates many instances of subprocesses at startup, and then uses them repeatedly to complete many tasks. And in the case of RQ, for each job you need to create a new fork. Both approaches have their pros and cons, but here we will not talk about this.
performance measurement
Before I started profiling, I decided to measure the performance of the system by finding out how long the worker container needs to process 1000 jobs. I decided to focus on the
record_event
task, as this is a common lightweight operation. To measure performance, I used the
time
command. This required a couple of changes to the project code:
- To measure the performance of performing 1000 tasks, I decided to use RQ batch mode, in which, after processing the tasks, the process is exited.
- I wanted to avoid influencing my measurements with other tasks that might have been scheduled for the time I was measuring system performance. So I moved
record_event
to a separate queue calledbenchmark
, replacing@job('default')
with@job('benchmark')
. This was done immediately before therecord_event
intasks/general.py
.
Now it was possible to start measurements. To begin with, I wanted to know how long it takes to start and stop a worker without load. This time could be subtracted from the final results obtained later.
$ docker-compose exec worker bash -c "time ./manage.py rq workers 4 benchmark" real 0m14.728s user 0m6.810s sys 0m2.750s
It took 14.7 seconds to initialize the worker on my computer. I remember that.
Then I put 1000
record_event
test
record_event
in the
benchmark
queue:
$ docker-compose run --rm server manage shell <<< "from redash.tasks.general import record_event; [record_event.delay({ 'action': 'create', 'timestamp': 0, 'org_id': 1, 'user_id': 1, 'object_id': 0, 'object_type': 'dummy' }) for i in range(1000)]"
After that, I started the system in the same way as I did before, and found out how long it takes to process 1000 jobs.
$ docker-compose exec worker bash -c "time ./manage.py rq workers 4 benchmark" real 1m57.332s user 1m11.320s sys 0m27.540s
Subtracting 14.7 seconds from what happened, I found out that 4 workers process 1000 tasks in 102 seconds. Now let's try to find out why this is so. To do this, we, while the workers are busy, examine them using
py-spy
.
Profiling
We add another 1,000 tasks to the queue (this must be done due to the fact that during the previous measurements all the tasks were processed), run the workers and spy on them.
$ docker-compose run --rm server manage shell <<< "from redash.tasks.general import record_event; [record_event.delay({ 'action': 'create', 'timestamp': 0, 'org_id': 1, 'user_id': 1, 'object_id': 0, 'object_type': 'dummy' }) for i in range(1000)]" $ docker-compose exec worker bash -c 'nohup ./manage.py rq workers 4 benchmark & sleep 15 && pip install py-spy && rq info -u "redis://redis:6379/0" | grep busy | awk "{print $3}" | grep -o -P "\s\d+" | head -n 1 | xargs py-spy record -d 10 --subprocesses -o profile.svg -p' $ open -a "Google Chrome" profile.svg
I know that the previous team was very long. Ideally, to improve its readability, it would be worth breaking it into separate fragments, dividing it in those places where sequences of
&&
characters are found. But the commands must be executed sequentially within the same
docker-compose exec worker bash
session, so everything looks just like that. Here is a description of what this command does:
- Launches 4 batch workers in the background.
- It waits 15 seconds (approximately so much is needed to complete their download).
- Installs
py-spy
. - Runs
rq-info
and finds out the PID of one of the workers. - Records information about the work of the worker with the previously received PID for 10 seconds and saves the data in the
profile.svg
file
As a result, the following “fiery schedule” was obtained.
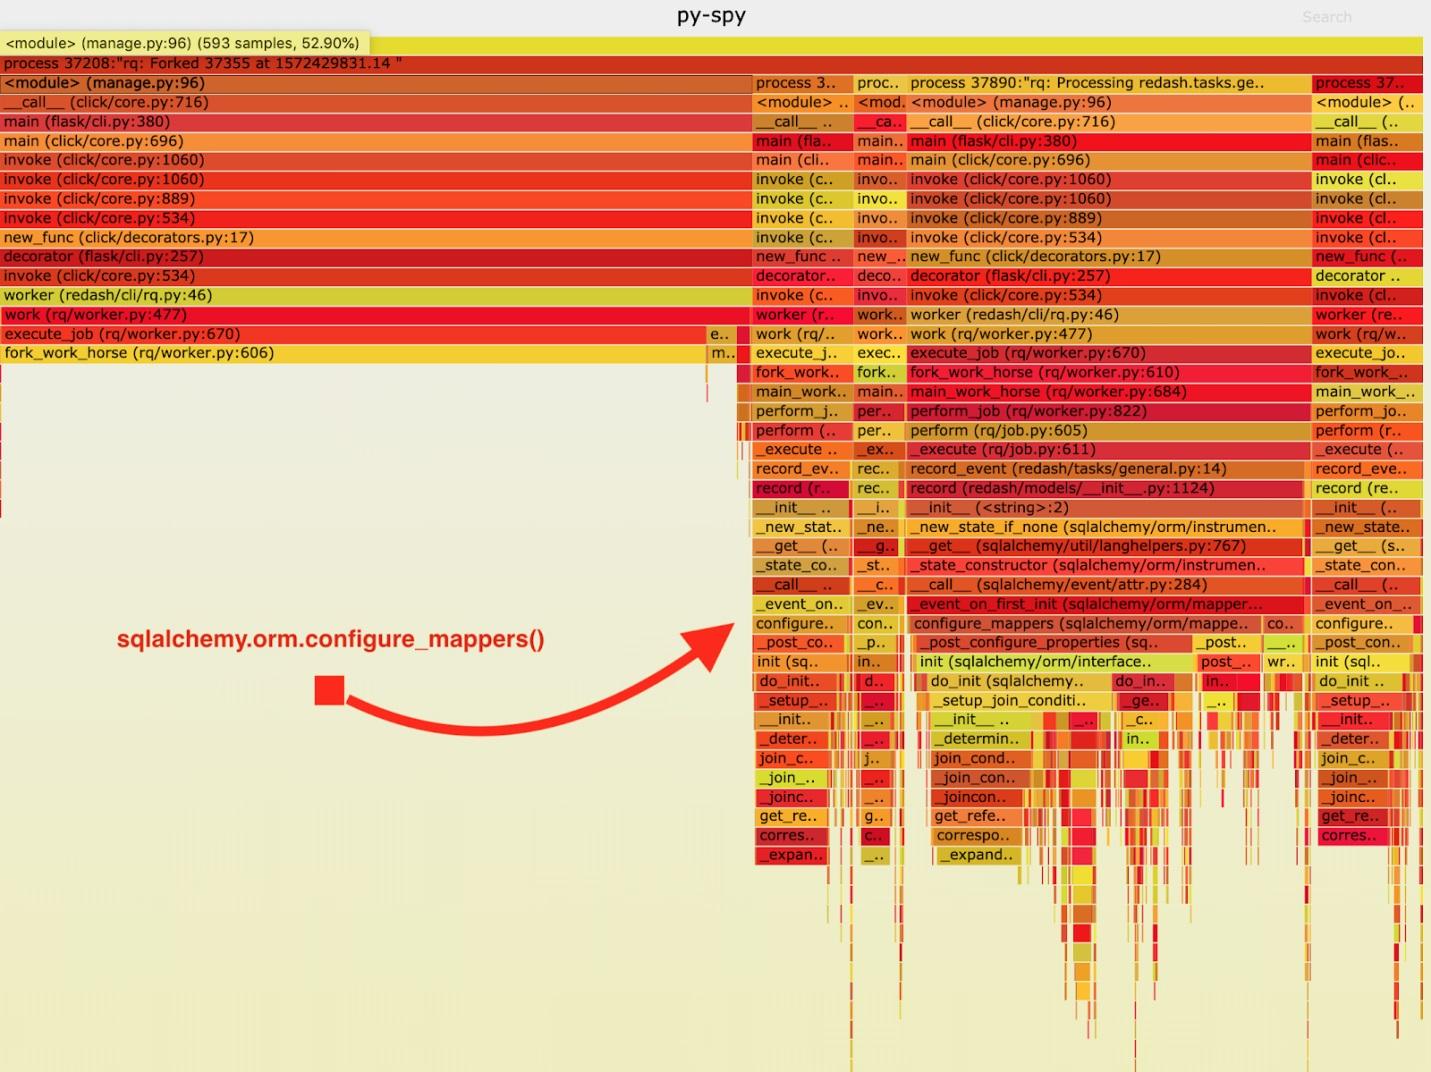
Visualization of data collected by py-spy
After analyzing this data, I noticed that the
record_event
task spends a long time running it in
sqlalchemy.orm.configure_mappers
. This happens during each task. From the documentation I learned that at the time that interests me, the relations of all previously created mappers are initialized.
Such things are absolutely not required to happen with every fork. We can initialize the relationship once in the parent worker and avoid repeating this task in the “workhorses”.
As a result, I added a call to
sqlalchemy.org.configure_mappers()
to the code before starting the “workhorse” and took measurements again.
$ docker-compose run --rm server manage shell <<< "from redash.tasks.general import record_event; [record_event.delay({ 'action': 'create', 'timestamp': 0, 'org_id': 1, 'user_id': 1, 'object_id': 0, 'object_type': 'dummy' }) for i in range(1000)] $ docker-compose exec worker bash -c "time ./manage.py rq workers 4 benchmark" real 0m39.348s user 0m15.190s sys 0m10.330s
If you subtract 14.7 seconds from these results, it turns out that we have improved the time required for 4 workers to process 1000 tasks from 102 seconds to 24.6 seconds. This is a fourfold performance improvement! Thanks to this fix, we were able to quadruple the RQ production resources and maintain the same system throughput.
Summary
From all this, I made the following conclusion: it is worth remembering that the application behaves differently if it is the only process, and if it comes to forks. If during each task you have to solve some difficult official tasks, then it is better to solve them in advance, having done this once before the fork is completed. Such things are not detected during testing and development, therefore, having felt that something is wrong with the project, measure its speed and get to the end while searching for the causes of problems with its performance.
Dear readers! Have you encountered performance problems in Python projects that you could solve by carefully analyzing a working system?