Successful work results are presented as follows:
We will understand in terms.
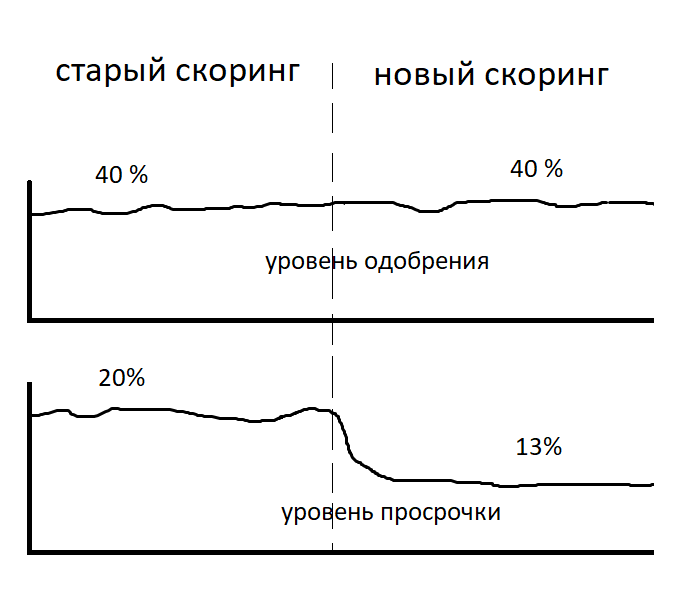
Overdue - the number of bad loans divided by the number of loans issued.
Approval level - the number of approved loan applications divided by the number of applications received.
Is it possible that when the problem is solved in such a formulation, the delay in monetary terms becomes higher?
Answer
It is possible!
The quality of scoring can vary in large and small amounts. Applications for large amounts of money will be worse than a model for applications for small amounts. Such a case can really meet in life. Details were parsed in the article.
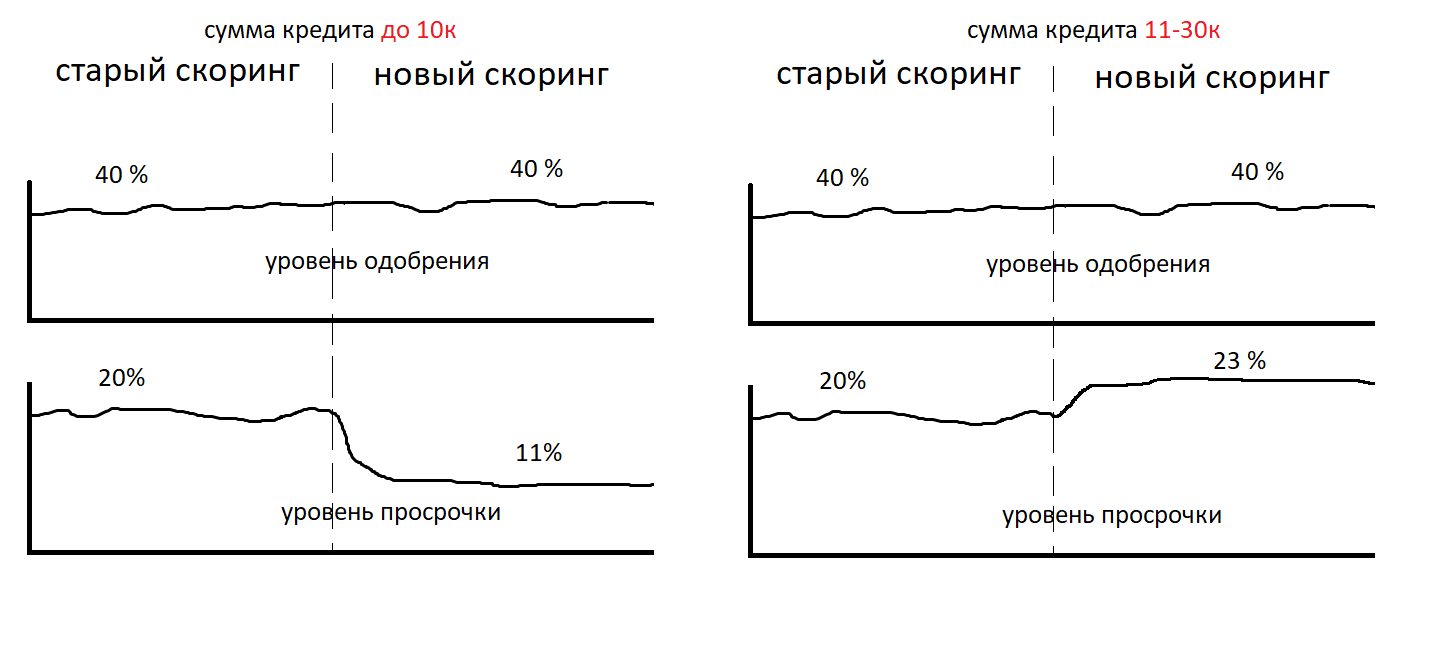
In such a situation, the delay in money may be worse.
Suppose we are not completely stupid, and immediately built a schedule for the delay in both pieces and money. And we conducted an analysis of the quality of the model in different slices. And they got the conclusion that the delay has decreased both in pieces and in money. And the model equally well scores applications for large and small amounts. We also saw improvement on the profitability charts.
Profitability - the sum of all payments divided by the issued loan amount, minus 100% . In financial reports, this value is built on the calendar cohort of customers. Calendar cohort - a group of customers who received a loan in one month. This is how the yield chart in dynamics looks like.
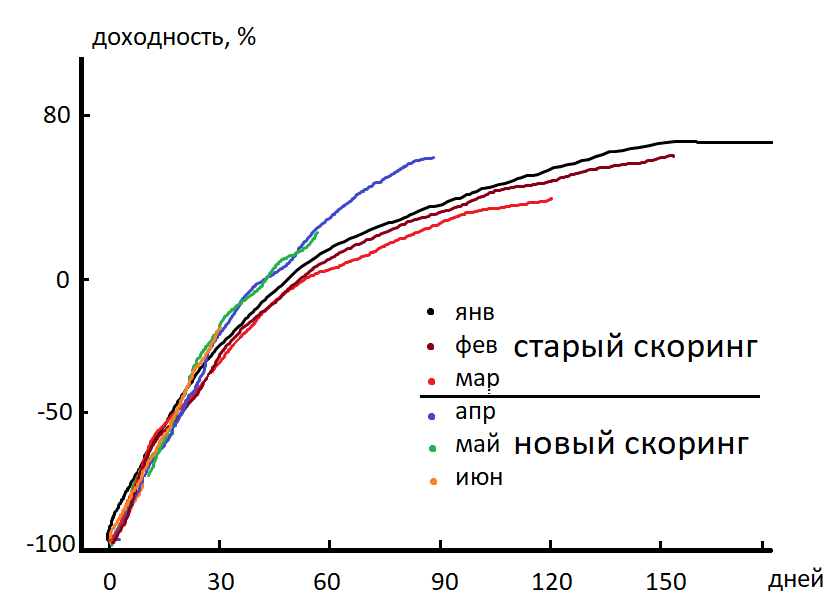
X axis - the number of days since the loan was issued. We see that on the 90th day after the issuance of the loan, the April cohort overtakes March. Delay decreased, profitability increased. The prize is already in our pocket. We go to the office to the authorities. We say: "Hello, I am for the prize!"
Could it be that the level of approval has not changed, the delay has decreased, profitability has grown, and we earn less money?
Answer
Can!
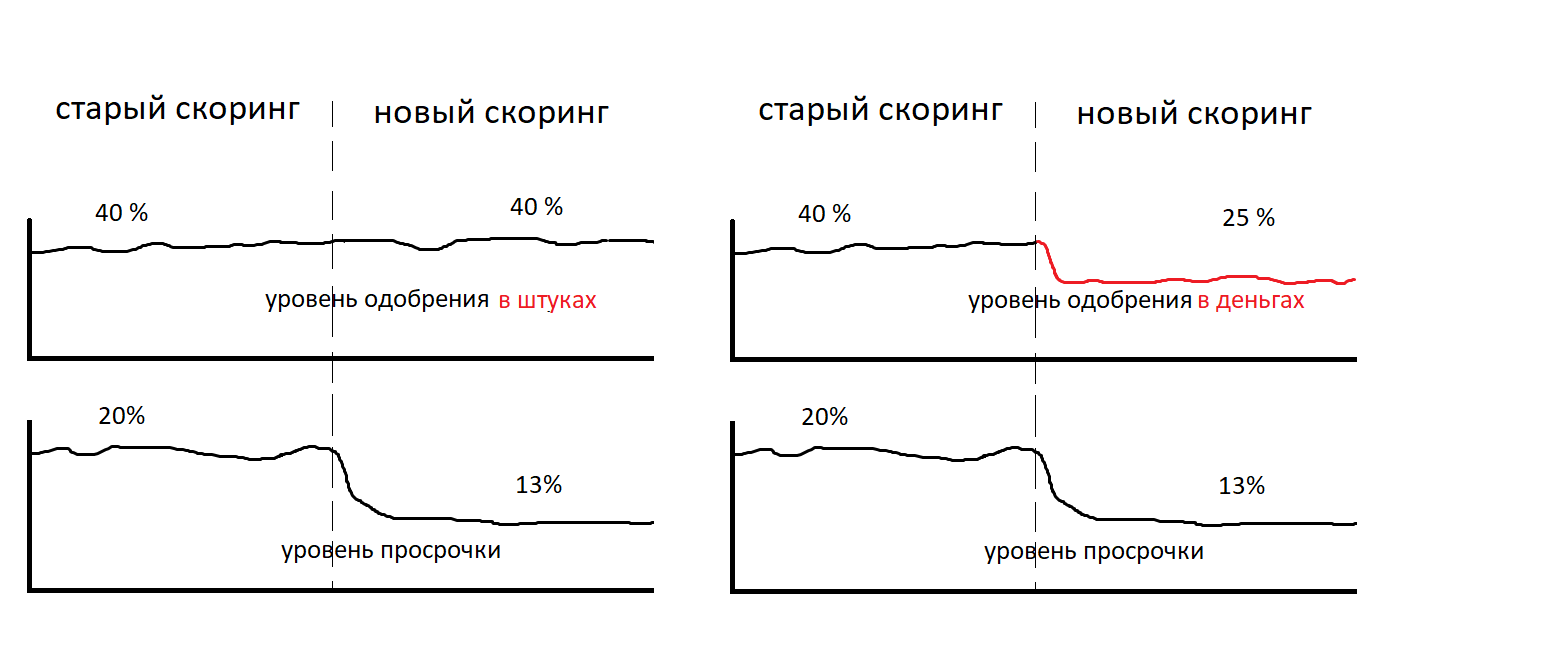
The speed itself and its comparison with the cutoff threshold is not the final decision on granting a loan. The final decision includes determining the amount of credit that can be issued. You can approve a smaller amount than requested by the client. Or a big one. In this case, the level of approval can no longer be interpreted as unambiguously as we did before. Now the approval level can be represented in monetary terms. And to the level of approval in pieces, the concept of an average check is added. We will draw the level of approval in monetary terms. This is the ratio of the approved loan amount to the requested amount in the application.
In practice, you can control the level of delay not only with the help of speed. But also using the method of determining the loan amount. This is a very powerful tool. We conducted research on how the cutting of the amount affects the non-return for customers with the same risk level, the same speed. Below is a graph of the default rate versus rate for the same model.
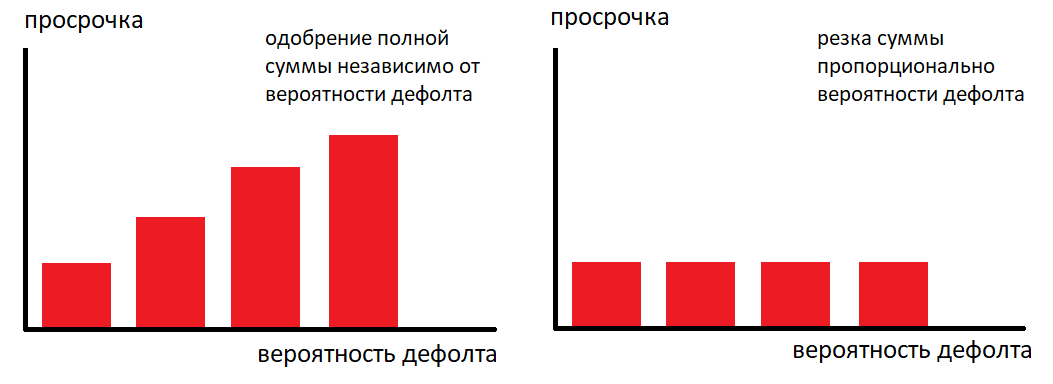
Left - the desired amount was approved. Right - the amount was cut depending on the speed. Once again, we note - on the graphs on the right and left the same model, the same speed. But converting the quick to the final solution - determining the amount of credit that can be approved, was carried out in different ways. This trick allows you to come to a company that is struggling to reduce the delay level, write a table of correspondence between the speed and the approved amount in 5 minutes and you will receive a delay reduction on the same day.
We will simulate a situation where the model equally well scores applications for large and small amounts. The level of approval in pieces has increased. The approval level in money has increased. The delay in pieces has not increased. The level of delay in money has not increased. Could there now be a situation where we still earn less?
Answer
Can!
The level of approval is not the same as the level of rendition. When we approve a loan to a client, it is not a fact that he will use it. When we significantly cut the amount to good customers, they refuse an approved loan and go to another place where they will approve the desired amount immediately. There is an outflow of the client. And we are adding two more indicators - the pick-up rate and the level of delivery.
Withdrawability is the percentage of loans granted among those approved. Level of disbursements - the number of issued loans divided by the number of applications received (similarly, it can be expressed in monetary terms).
A high level of approval in tandem with a strict policy for determining the amount of credit can give the effect of a low conversion of applications to issuance. With the same number of applications received, less money will be issued. However, the percentage of delay and approval level will look better than the previous version of the system.
Suppose we have improved all of these indicators. But we still cannot understand how much we earn. Profitability shows how loans paid cover non-repaid loans. This value is reflected in percent. But the percentage of a million and the percentage of 10 kopecks are different percentages.
As a result, we came to the option where we can monitor the performance of our decision-making system in sufficient detail. We have many different graphs and indicators, but we can’t say how much we earn, we can’t compare the models in the AB test, because we cannot express their quality in one number. And in the end, to answer the question, are we better or worse by the criterion of "make more money".
Let's try to express the effectiveness of the decision-making system with one number and compare the two systems. We have 4 indicators that comprehensively describe our system. Let me remind you what the decrease in the dimension of indicators looks like:
step 1
- profitability
- level of approval in pieces
- average check
- climbability
step 2
- profitability
- level of approval in money = (level of approval in pieces * average check)
- climbability
step 3
- profitability
- issue level in money = (level of approval in units * average bill * pick-up)
Thus, only 2 indicators remained. But we need some one integral indicator, which allows us to easily select the desired model. Is there such an indicator?
Answer
There is! - “Income from the application”
This is the sum of all payments with interest minus the amount issued, divided by the number of applications received. Such an integral indicator includes the average bill, the level of approval in pieces, the percentage of collection, and the conversion of the approval of the application to issue. The problem is solved. We look at this indicator, we see that it has improved, we are going for a premium.
Could there now be a situation where a model with a large revenue from an application brings less money?
Answer
Can!
We consider money and profitability in the context of the first application of the client and his first loan. And we are guided by the principle of momentary marginality. However, if you build a long-term relationship with a client, you can earn not only from the first loan to this client, but also from his subsequent requests. There is such a thing as the conversion of a new client to re-entry and LTV (life-time-value). And it may turn out that the best model by the criterion of income from an application may turn out to be worse in the long run, because will sweep many customers with high LTV. Those. in the context of one application, you can get such a cohort of clients (a client with the same speed / level of risk) for which the profitability of the application is generally negative. Negative! But if you observe these clients for 6 months, you can see that they are paying back the negative profitability of their cohort already at the second or third issue. We also encountered this situation in practice.
Thus, the yield can be reflected not in the context of the first loan, but for all loans of the client cohort for 6 months.

It is evident that the cohort grant can pay off after 6 months, despite the fact that the first loan is unprofitable with a yield of -30%. Such a strategy radically changes the approach to choosing a cutoff (threshold of approval).
We can operate with negative profitability from the application and payback for a certain amount of time 6-12 months. In practice, it is possible to issue loans with negative returns on the first issue. With this strategy, the choice of a model with a higher profitability from the application is not optimal. Now the selection criterion is the indicator - the maximum yield from the cohort for 6 months. The model becomes optimal, giving a larger total LTV within the cohort for 6 months. The choice of a model with a lower profitability from the application, but a large LTV is almost impossible due to the long test time. We can put a small part of the traffic on the worst model in the hope of seeing a larger LTV in six months or a year. However, for this she must have a higher level of approval in pieces. Routing of clients participating in the AB test to this model should be provided. Plus, if after six months or a year it becomes clear that LTV is more important to us and we want to switch all traffic to the best LTV model, it is necessary that the quality of the model be stable over time and the model does not "go bad" by this time. However, over the year, you can manage to pump the model heavily in terms of profitability from the application, without worrying about LTV. In such dynamic external and internal conditions - internal development, new products, new models, changes in legislation, LTV becomes just reporting for reference. We cannot use it as an indicator to select the best model.
In fairness, it is worth adding that this scheme does not take into account expenses. Which include debt collection service and cost of attracting traffic. These parameters may depend on the level of delay, the level of approval, the conversion of a new client into a repeat one, and the average check.
Dmitry Gorelov
telegram: datasanta