Usually, specialized, very expensive, closed source tools are used to build CJMs. But we wanted to come up with something simple, requiring minimal effort and possibly open source. So the idea came up to use Markov chains - and we succeeded. We built a map, interpreted student behavior data as a graph, saw completely unobvious answers to global business questions, and even found deeply hidden bugs. We did all this with the help of open source Python script solutions. In this article I will talk about two cases with the very unobvious results and share the script with everyone.
So, Markov chains show the probability of transitions between events. Here is a primitive Wikipedia example:
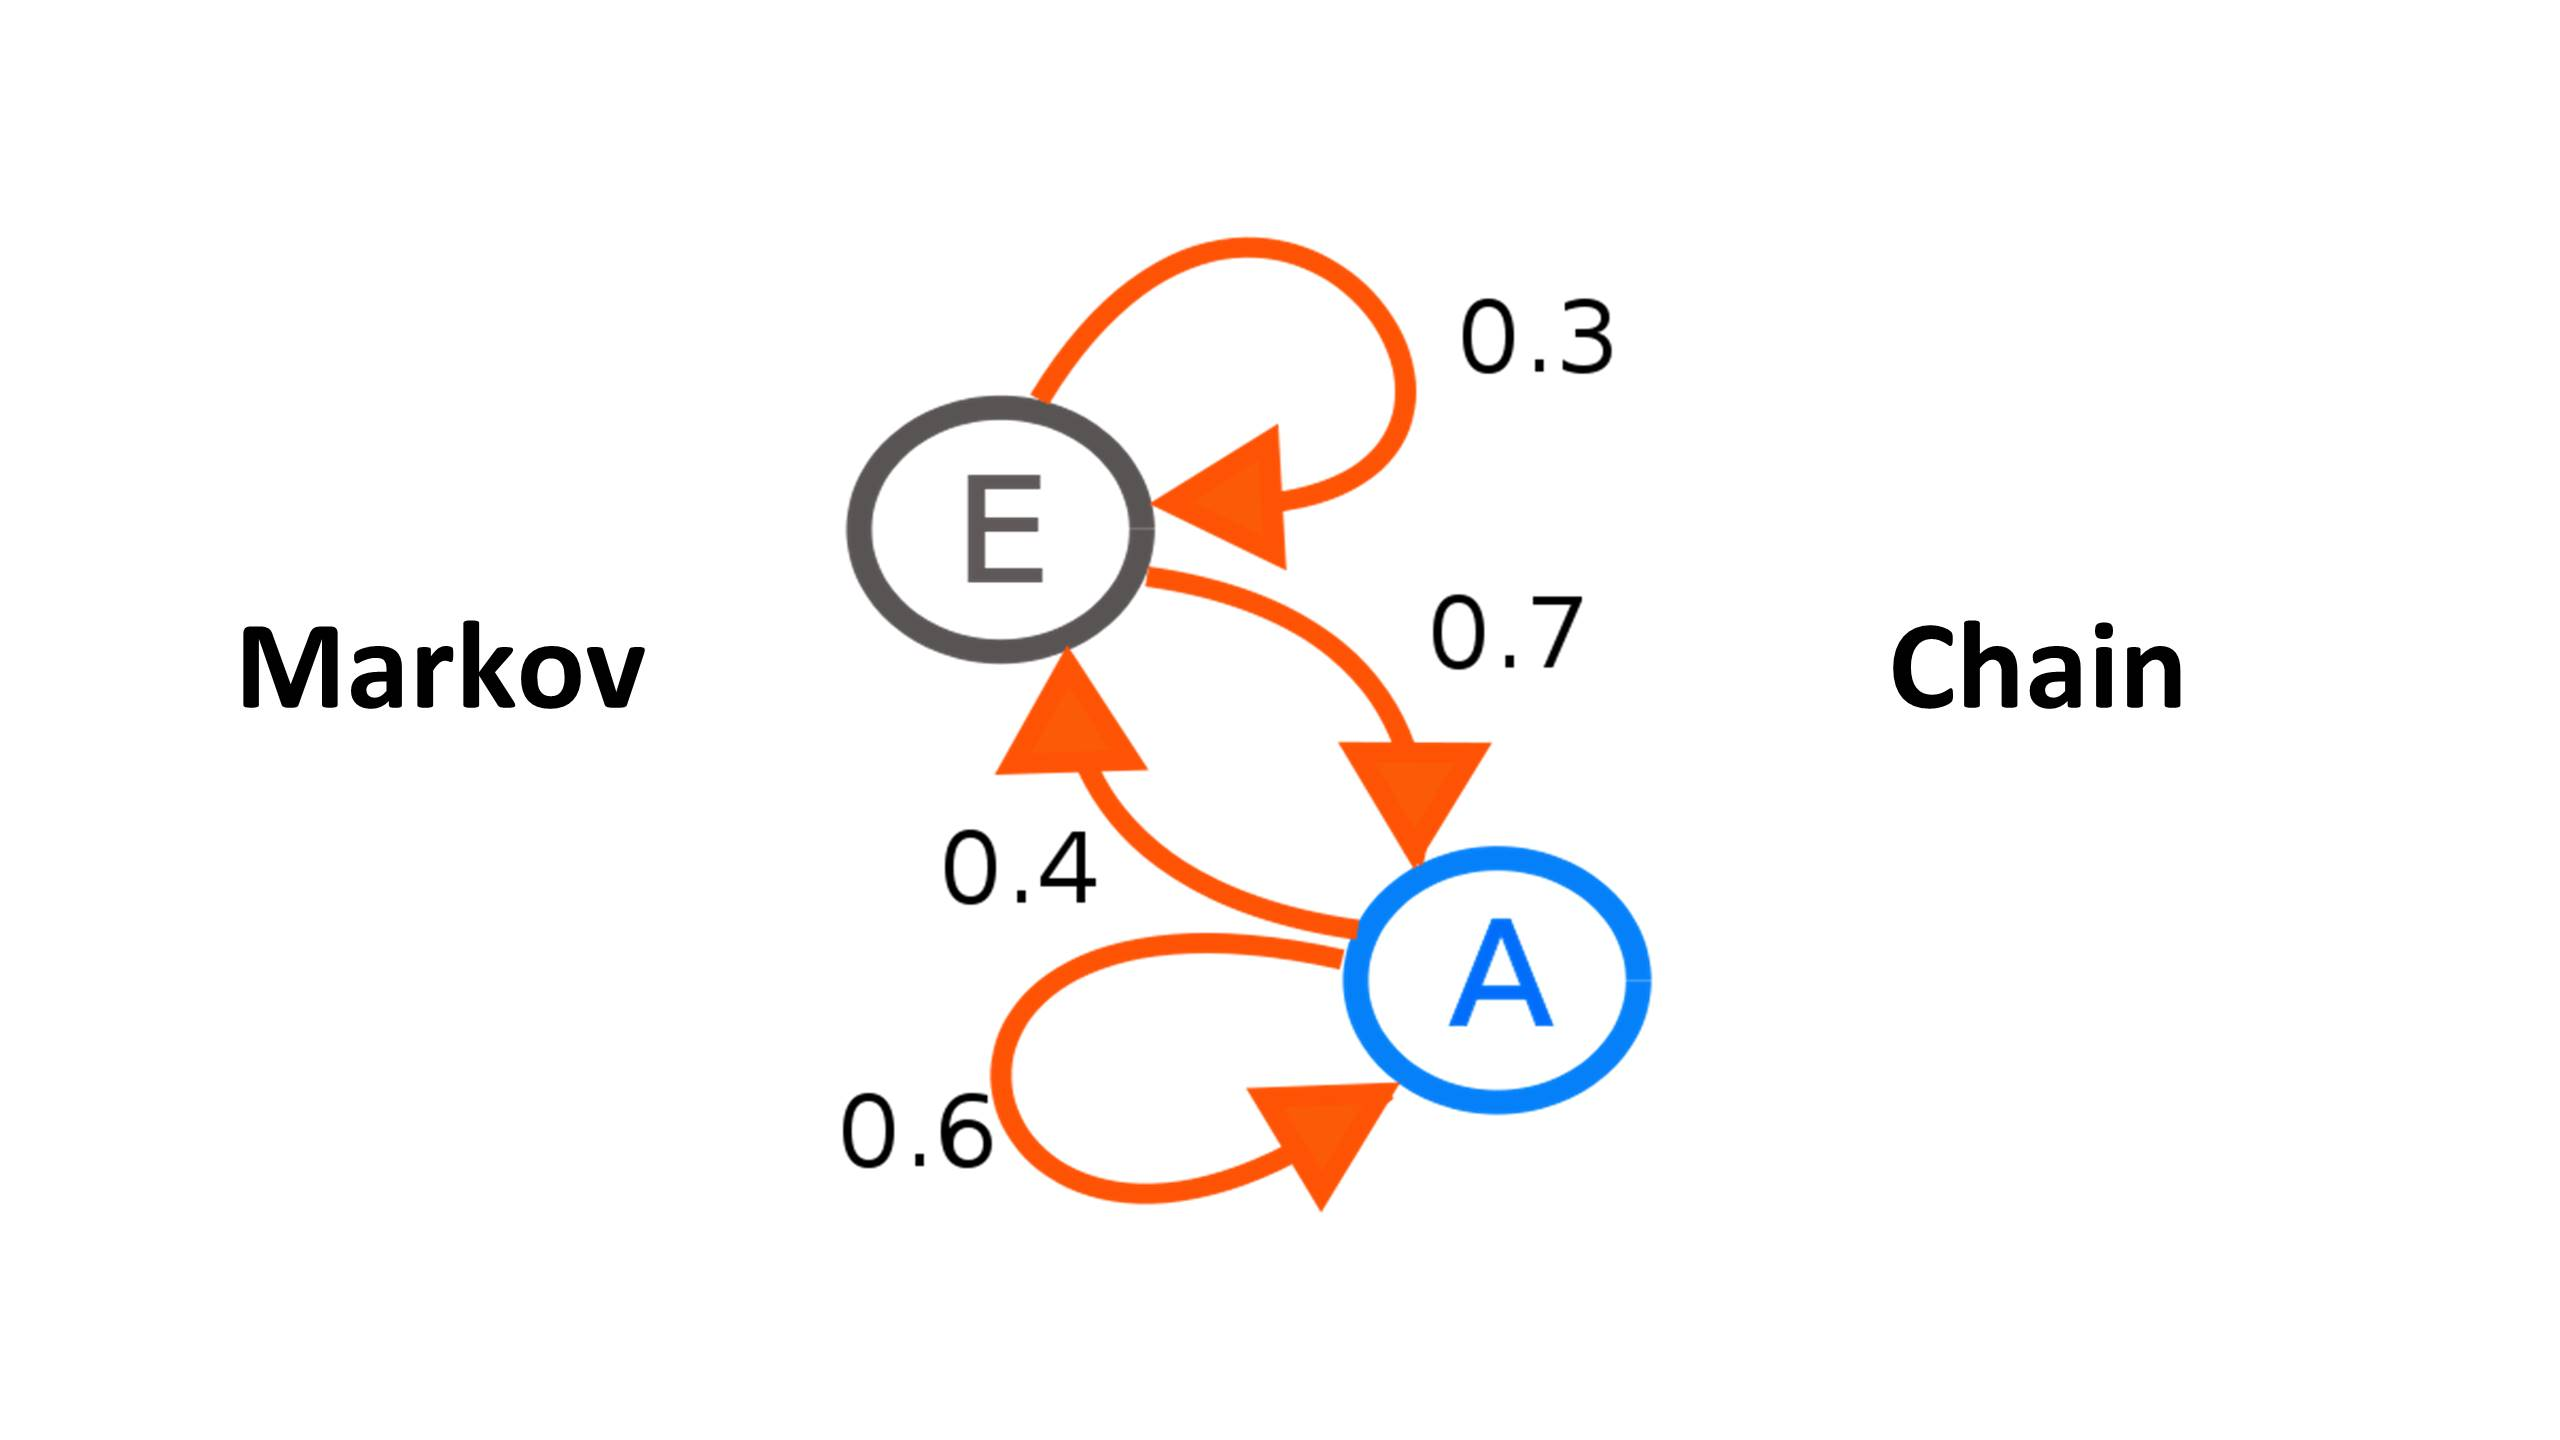
Here, “E” and “A” are events, arrows are transitions between them (including the transition from an event to it), and arrow weights are the probability of transition (“weighted oriented graph”).
What used
The chain was trained by the standard Python functionality, which was fed by student activity logs. The graph on the resulting matrix was built by the NetworkX library.
The log looks like this:
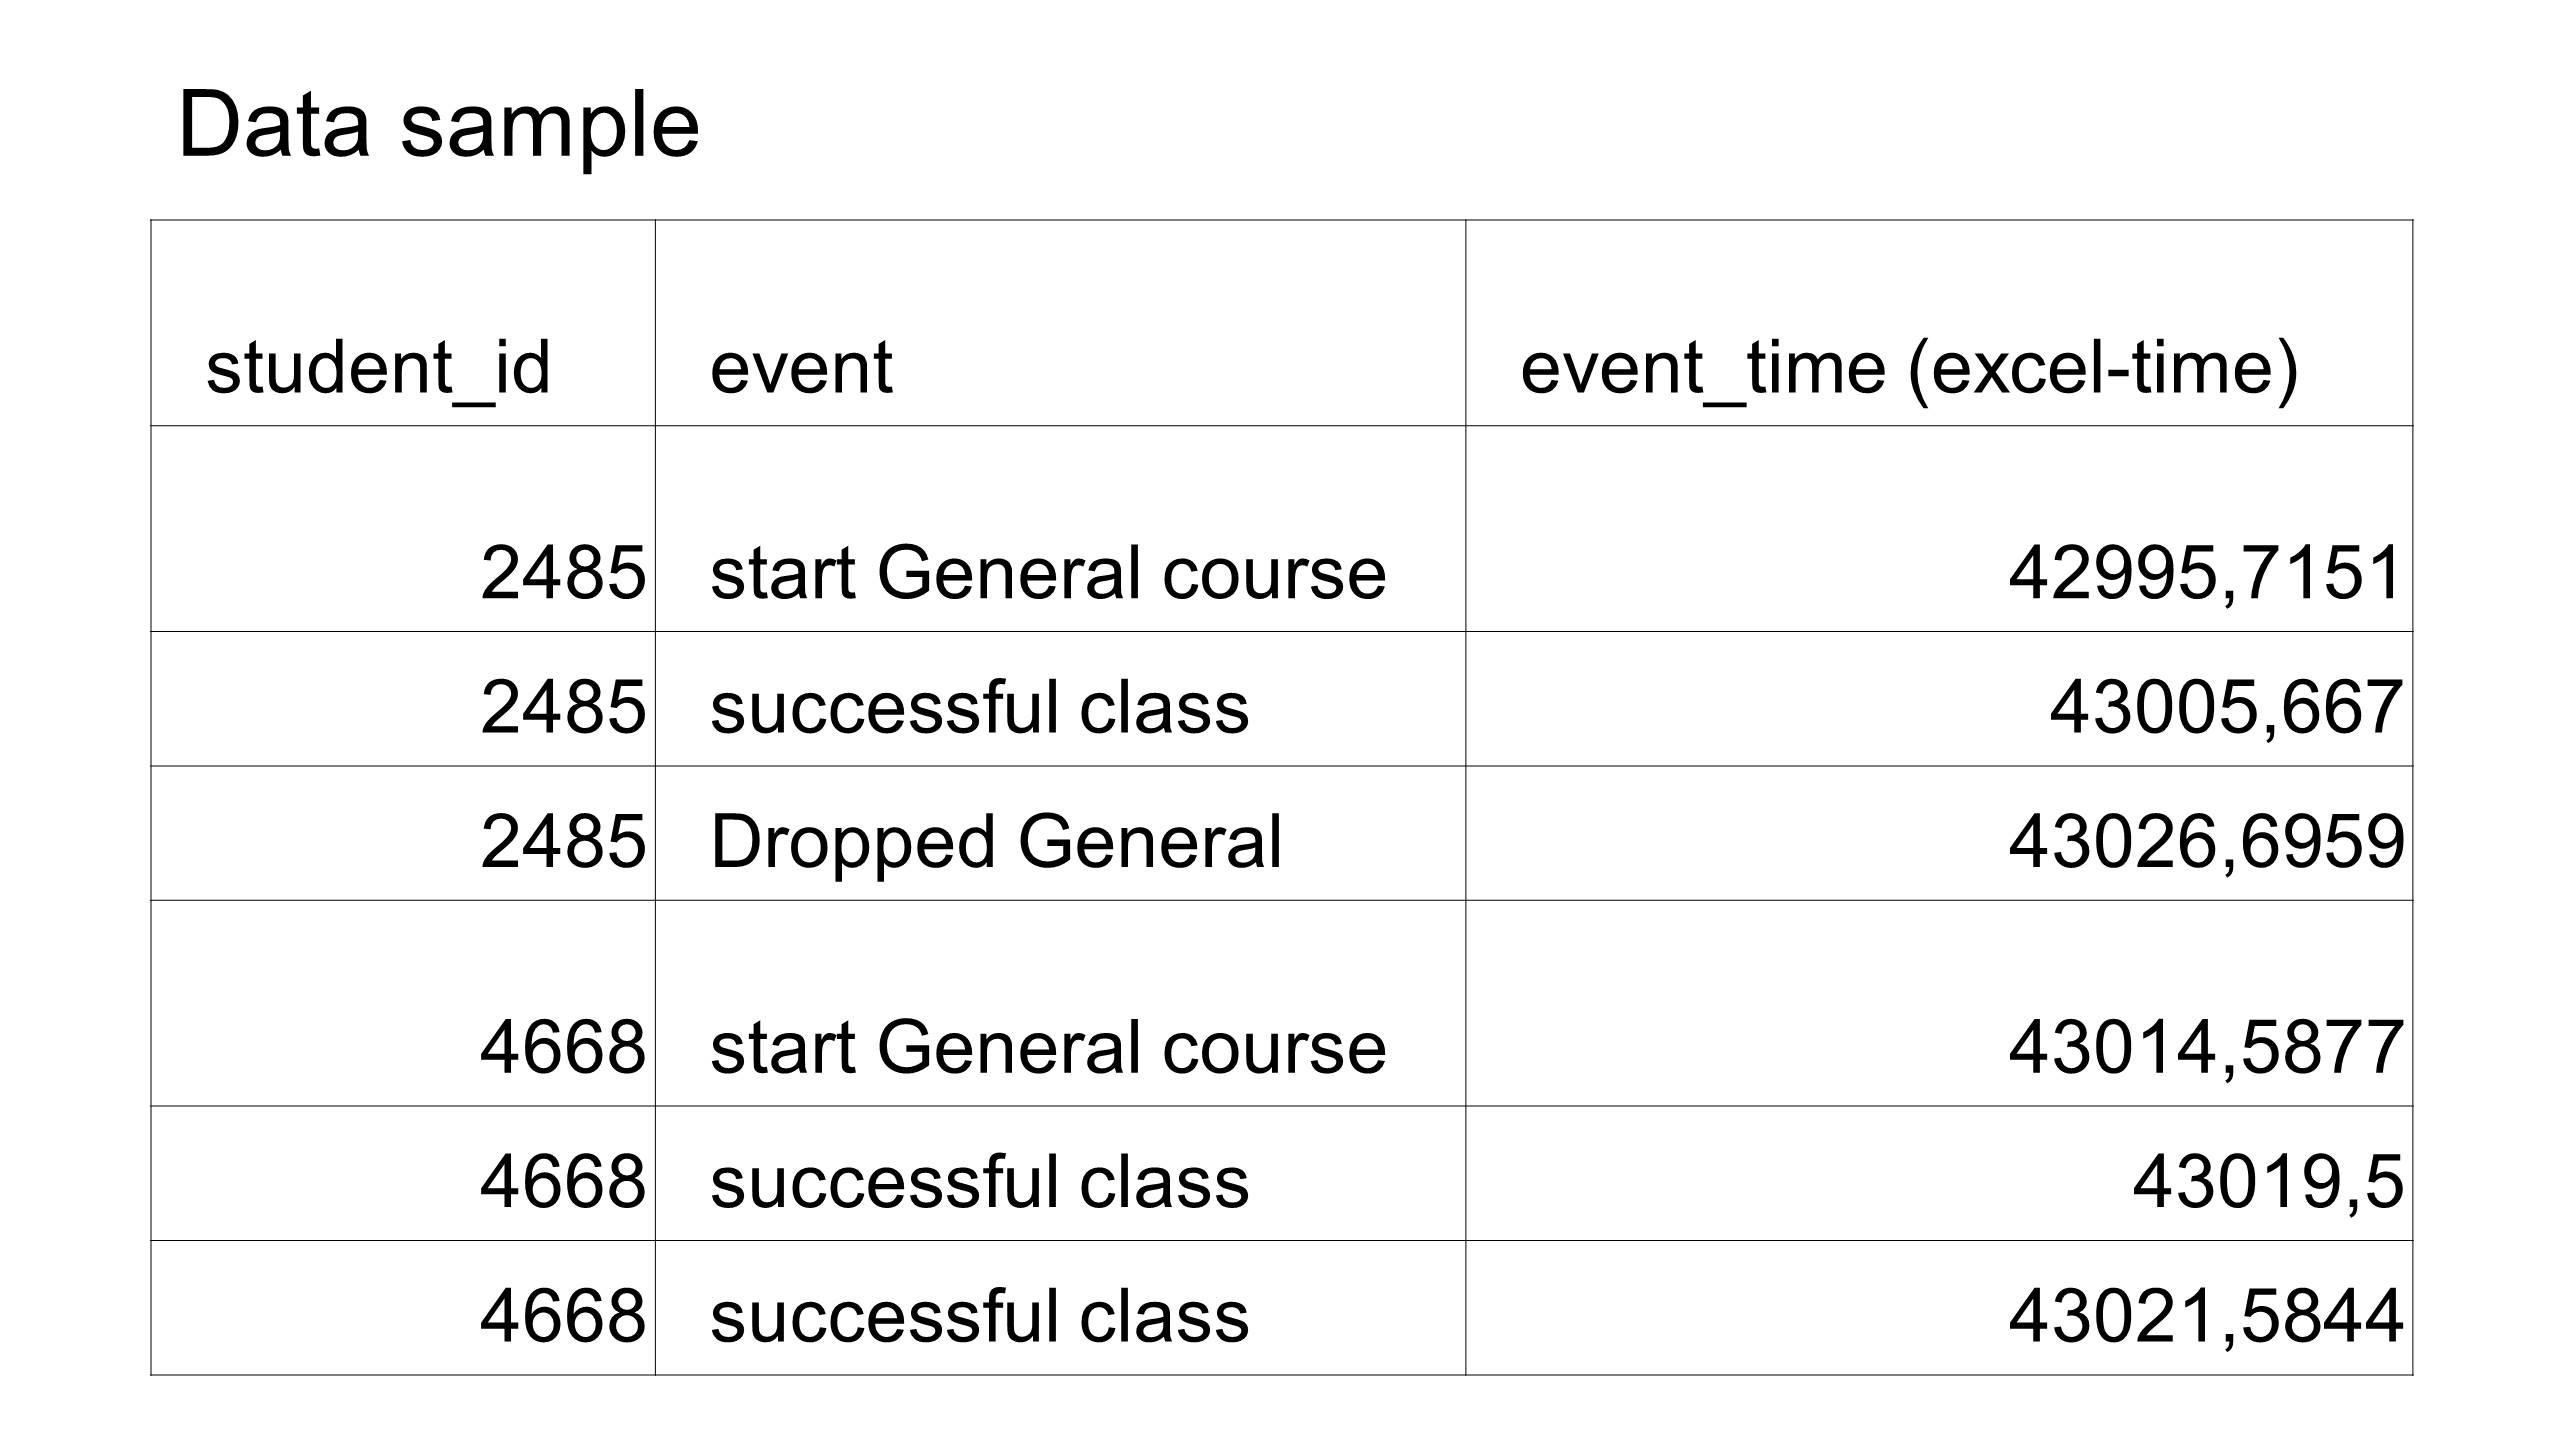
This is a csv file containing a table of three columns: student id, event name, time when it happened. These three fields are enough to trace the client’s movements, build a map and finally get a Markov chain.
The library returns the constructed graphs in .dot or .gexf format. To visualize the former, you can use the free Graphviz package (gvedit tool), we worked with .gexf and Gephi, also free.
Next, I want to give two examples of the use of Markov chains, which allowed us to take a fresh look at our goals, educational processes and the Skyeng ecosystem itself. Well, fix bugs.
First Case: Mobile App
First, we explored the student’s path through our most popular product, General. At that moment, I was working in the Skyeng Children’s Department and we wanted to see how efficiently the mobile application works with our children's audience.
Taking the logs and running them through the script, I got something like this:
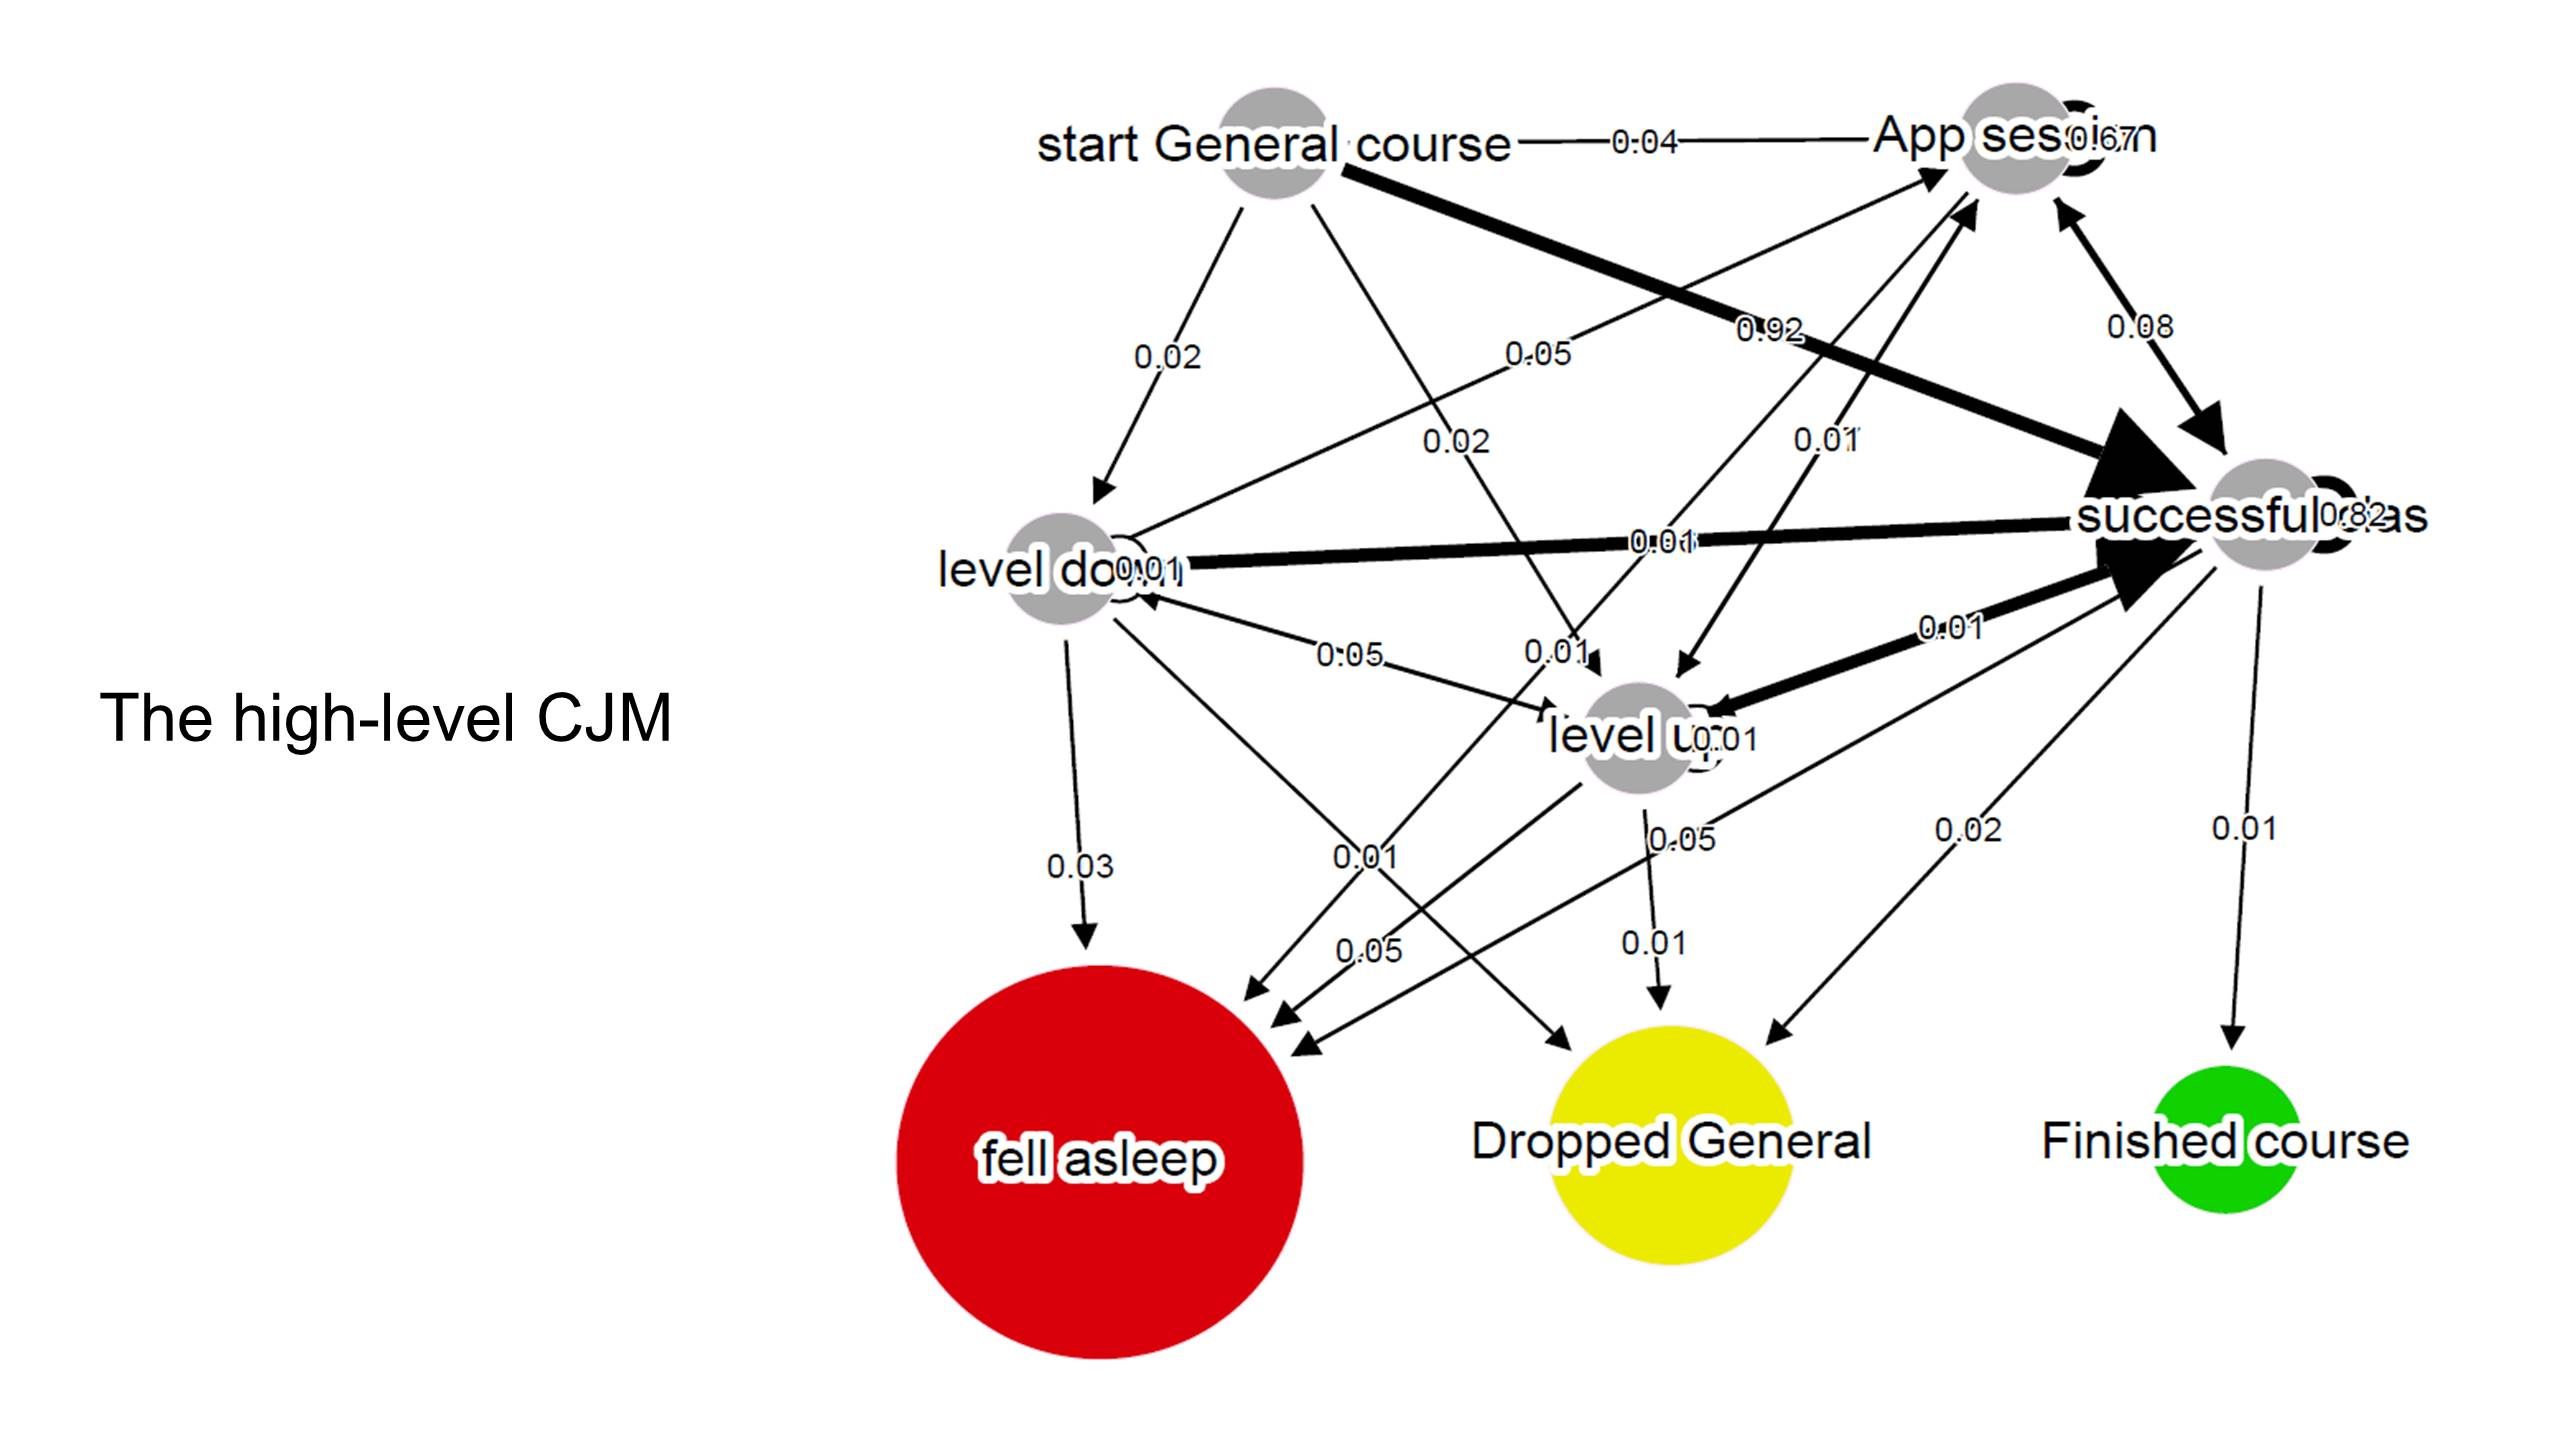
The start node is Start General, and below are three output nodes: the student “fell asleep”, changed course, completed the course.
- Fell asleep, “Fell asleep” - it means that classes are no longer taking place, most likely he fell off. We optimistically call this condition “asleep”, because in theory, he still has the opportunity to continue his studies. Worst result for us.
- Dropped general, Changed course - switched from General to something else and got lost for our Markov chain.
- Finished course, I graduated from the course - perfect condition, the person has completed 80% of the lessons (not all lessons are required).
Getting into the successfull class node means successfully completing the lesson on our platform with the teacher. She fixes the progress on the course and approaching the desired result - "Finished the course." It is important for us that students attend it as much as possible.
To get more accurate quantitative conclusions for a mobile application (app session node), we built separate circuits for each of the final nodes and then compared the weight of the edges in pairs:
- from app session back to it;
- from app session to successful class;
- from successful class to app session.
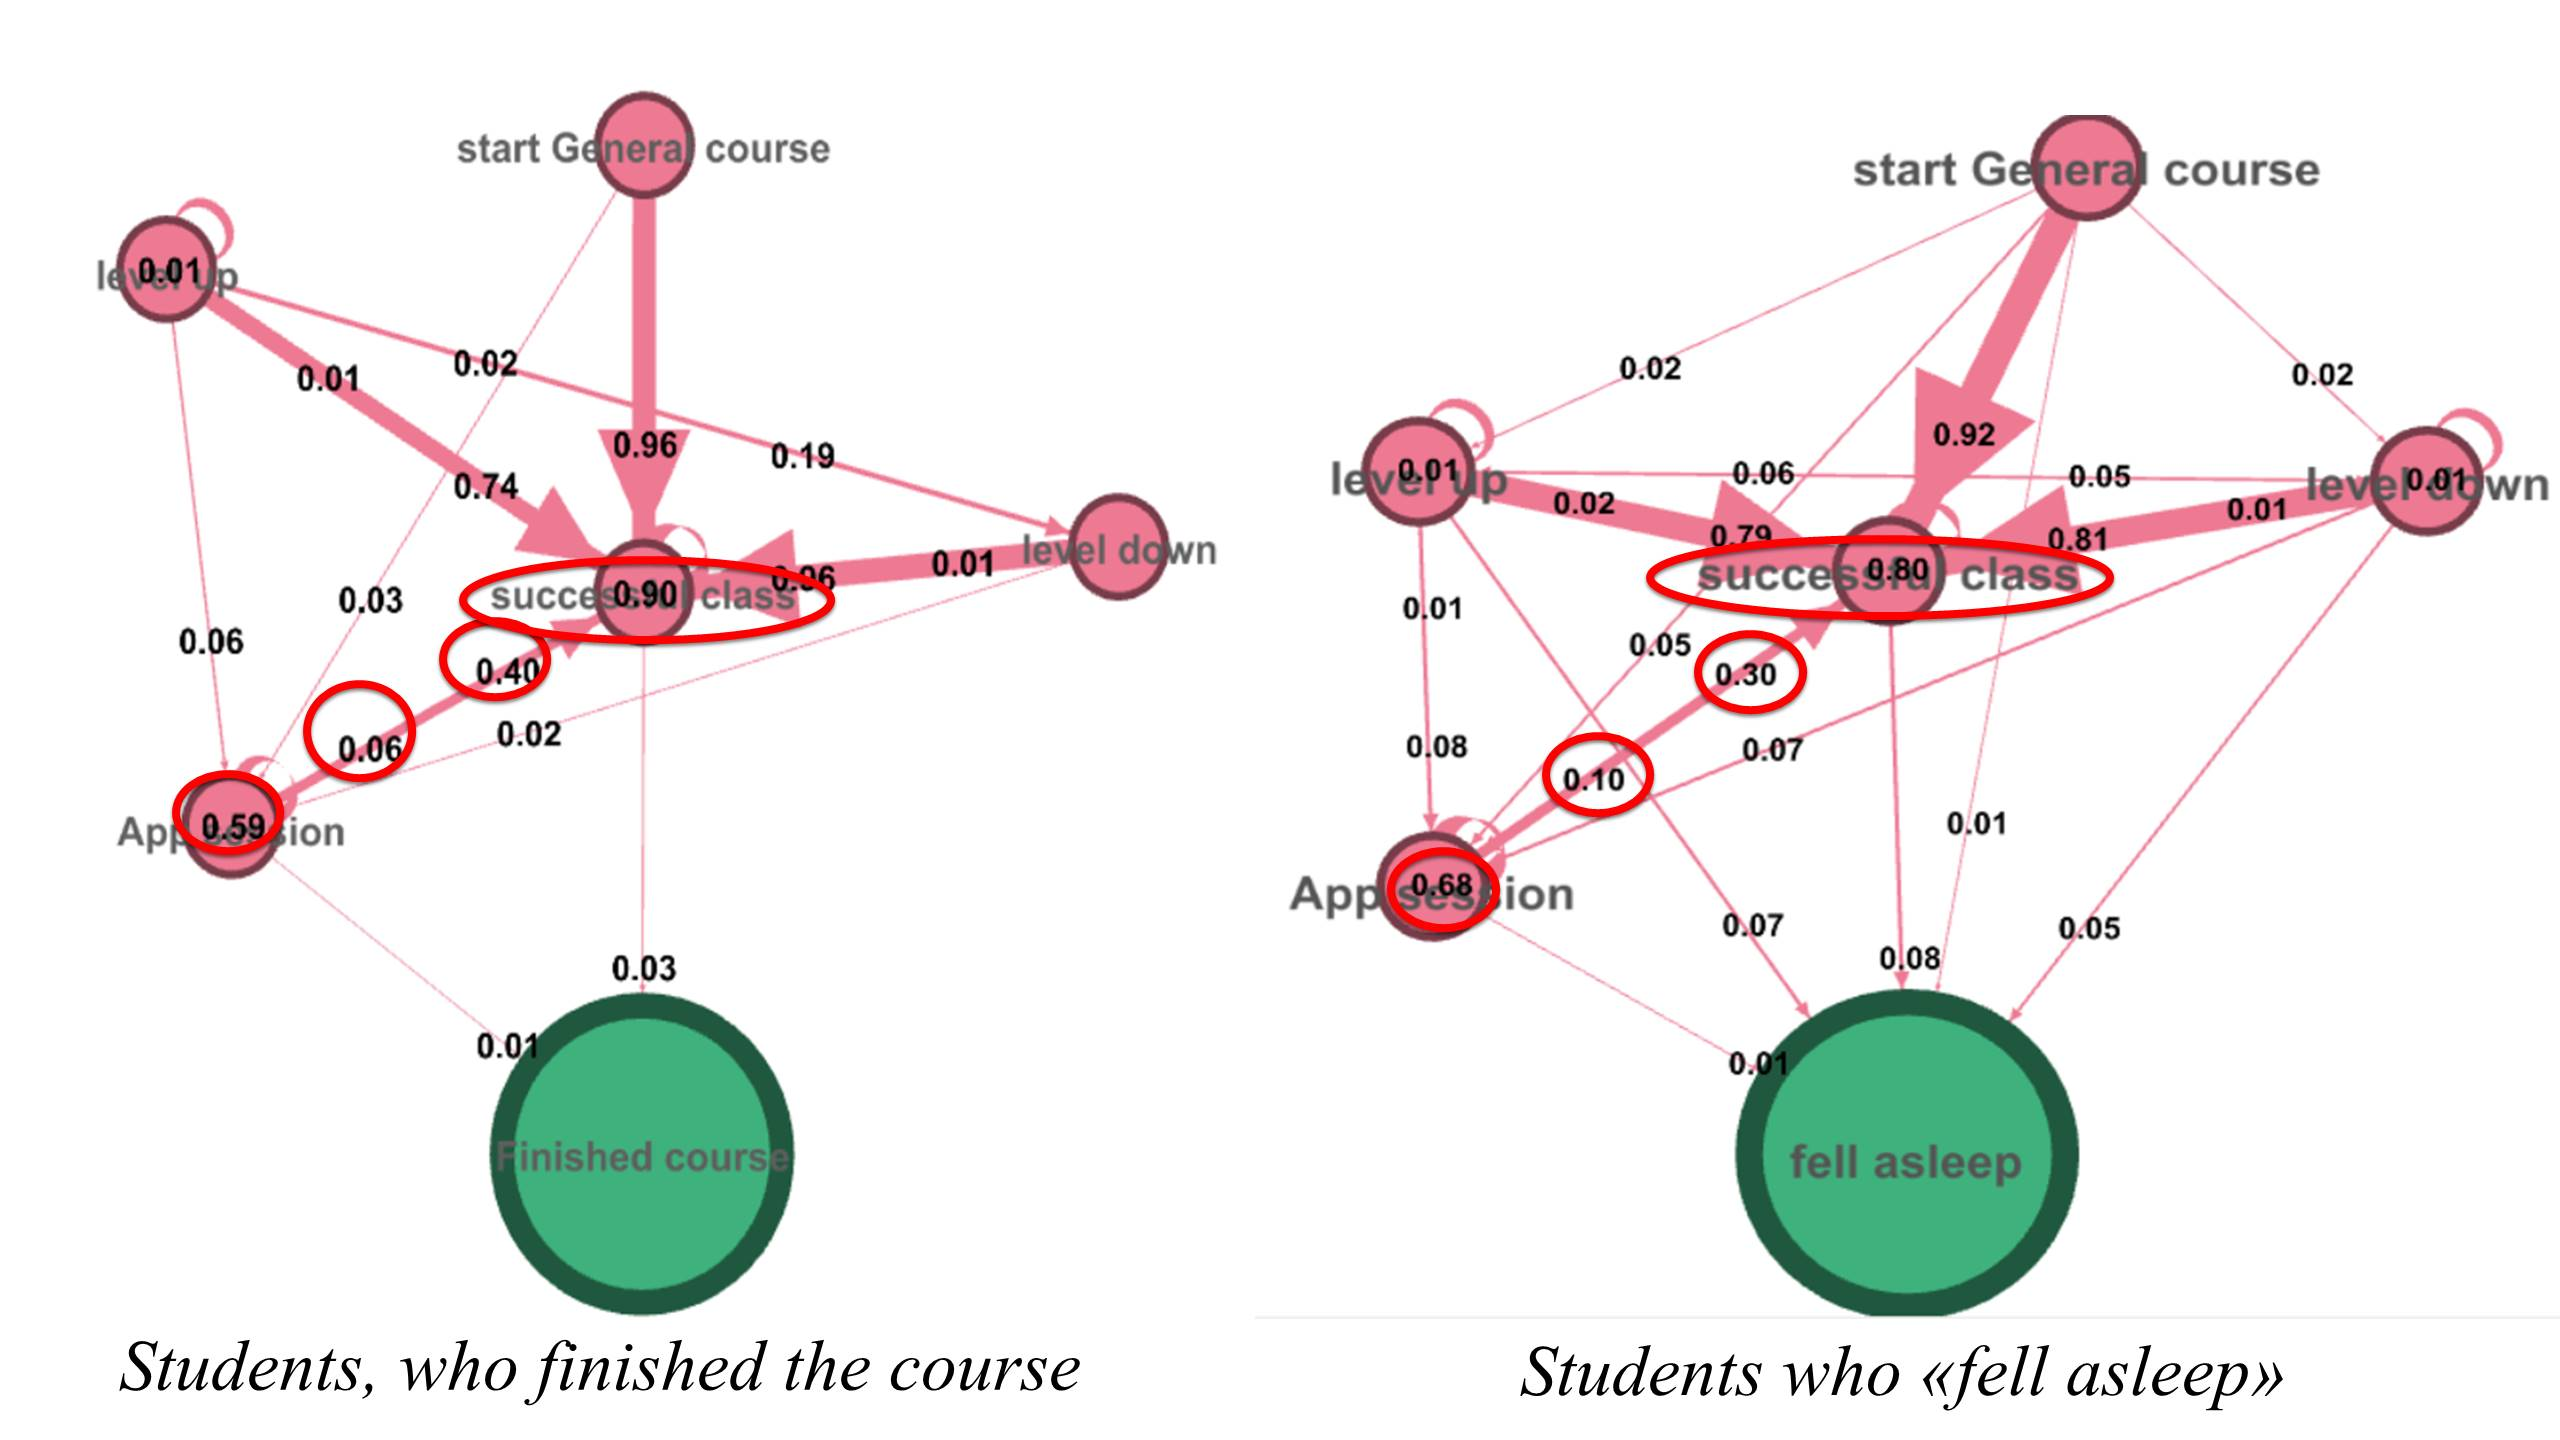
On the left - students who completed the course, on the right - “asleep”
These three ribs show the relationship between student success and their use of a mobile application. We expected to see that students who completed the course will have a stronger connection with the application than those who have “fallen asleep”. However, in fact, they received exactly the opposite results:
- we made sure that different user groups interact differently with the mobile application;
- successful students use the mobile application less intensively;
- falling asleep students are more actively using the mobile application.
This means that “falling asleep” students begin to spend more and more time in a mobile application and, in the end, remain there forever.
At first we were surprised, but, thinking, we realized that this is a completely natural effect. At one time, I myself studied French using two tools: a mobile application and lectures on grammar on YouTube. At first, I divided the time between them in a proportion of 50 to 50. But the application is more fun, there is gamification, everything is simple, quick and understandable, but you need to delve into the lecture, write something, practice in a notebook. Gradually, I began to spend more time on the smartphone until its share reached 100%: if it hangs for three hours, it creates a false sense of work done, because of which there is no desire to go and listen to something.
But how so? After all, we specifically created a mobile application, built in the Ebbinghaus curve , gamified it, made it attractive so that people spent time in it, but it turns out that it only distracts them? In fact, the reason is that the mobile application team did too well with its tasks, as a result of which it became a cool self-sufficient product and began to fall out of our ecosystem.
As a result of the study, it came to an understanding that the mobile application needs to be somehow changed so that it less draws from the main course of study. Moreover, both children and adults. Now this work is underway.
Case Two: Onboarding Bugs
Onboarding is an optional additional procedure when registering a new student, eliminating potential technical problems in the future. The basic scenario implies that a person registered on the landing page, got access to his personal account, they contact him and conduct an introductory lesson. At the same time, we note a large percentage of technical difficulties during the introductory lesson: the wrong browser version, the microphone or sound does not work, the teacher can not immediately suggest a solution, and all this is especially difficult when it comes to children. Therefore, we developed an additional application in your personal account, where you can perform four simple steps: check your browser, camera, microphone and confirm that parents will be there during the introductory lesson (after all, they pay for the education of children).
These few pages of onboarding showed this funnel:
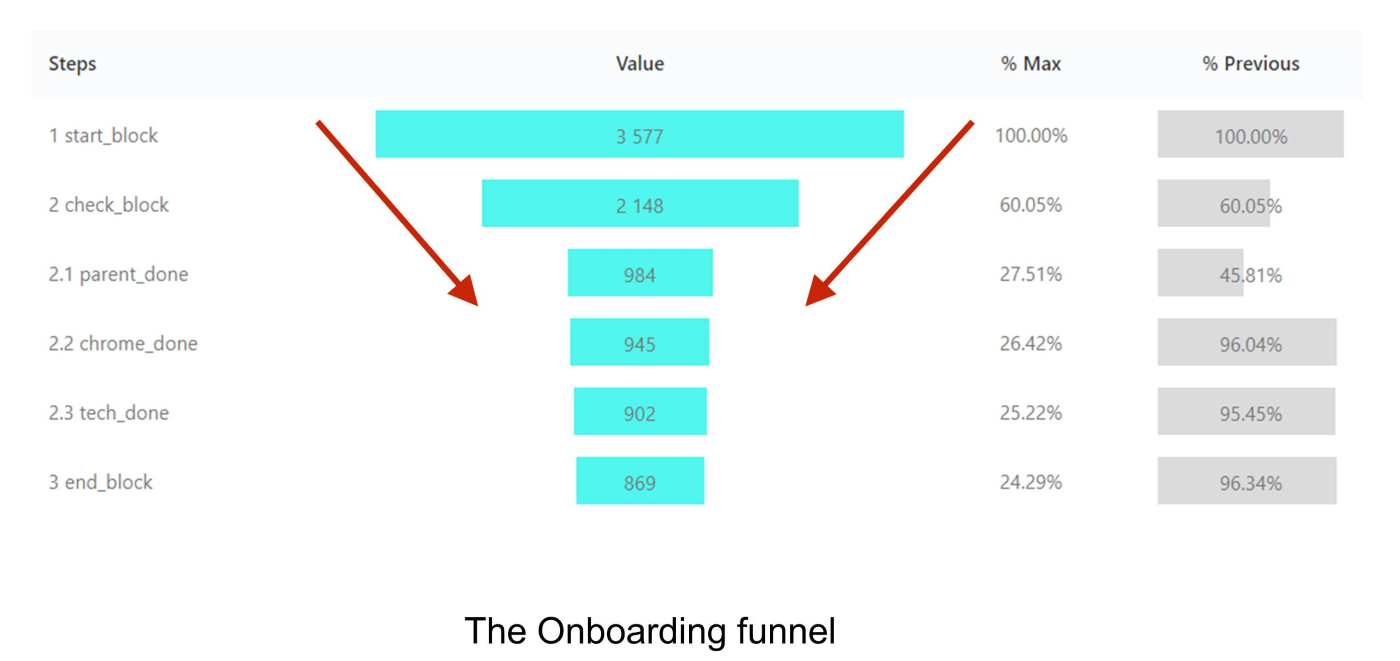
1: start block with three slightly different (depending on the client) login / password entry forms.
2: daw consent to an additional procedure for onboarding.
2.1-2.3: checking the presence of the parent, version of Chrome and sound.
3: final block.
It looks very natural: at the first two steps, most of the visitors merge, realizing that there is something to fill out, check, but there is no time. If the client has reached the third step, then he will almost certainly reach the final. Not a single reason is visible on the funnel to suspect something.
Nevertheless, we decided to analyze our onboarding not on the classic one-dimensional funnel, but using the Markov chain. We turned on a little more events, ran the script and got this:
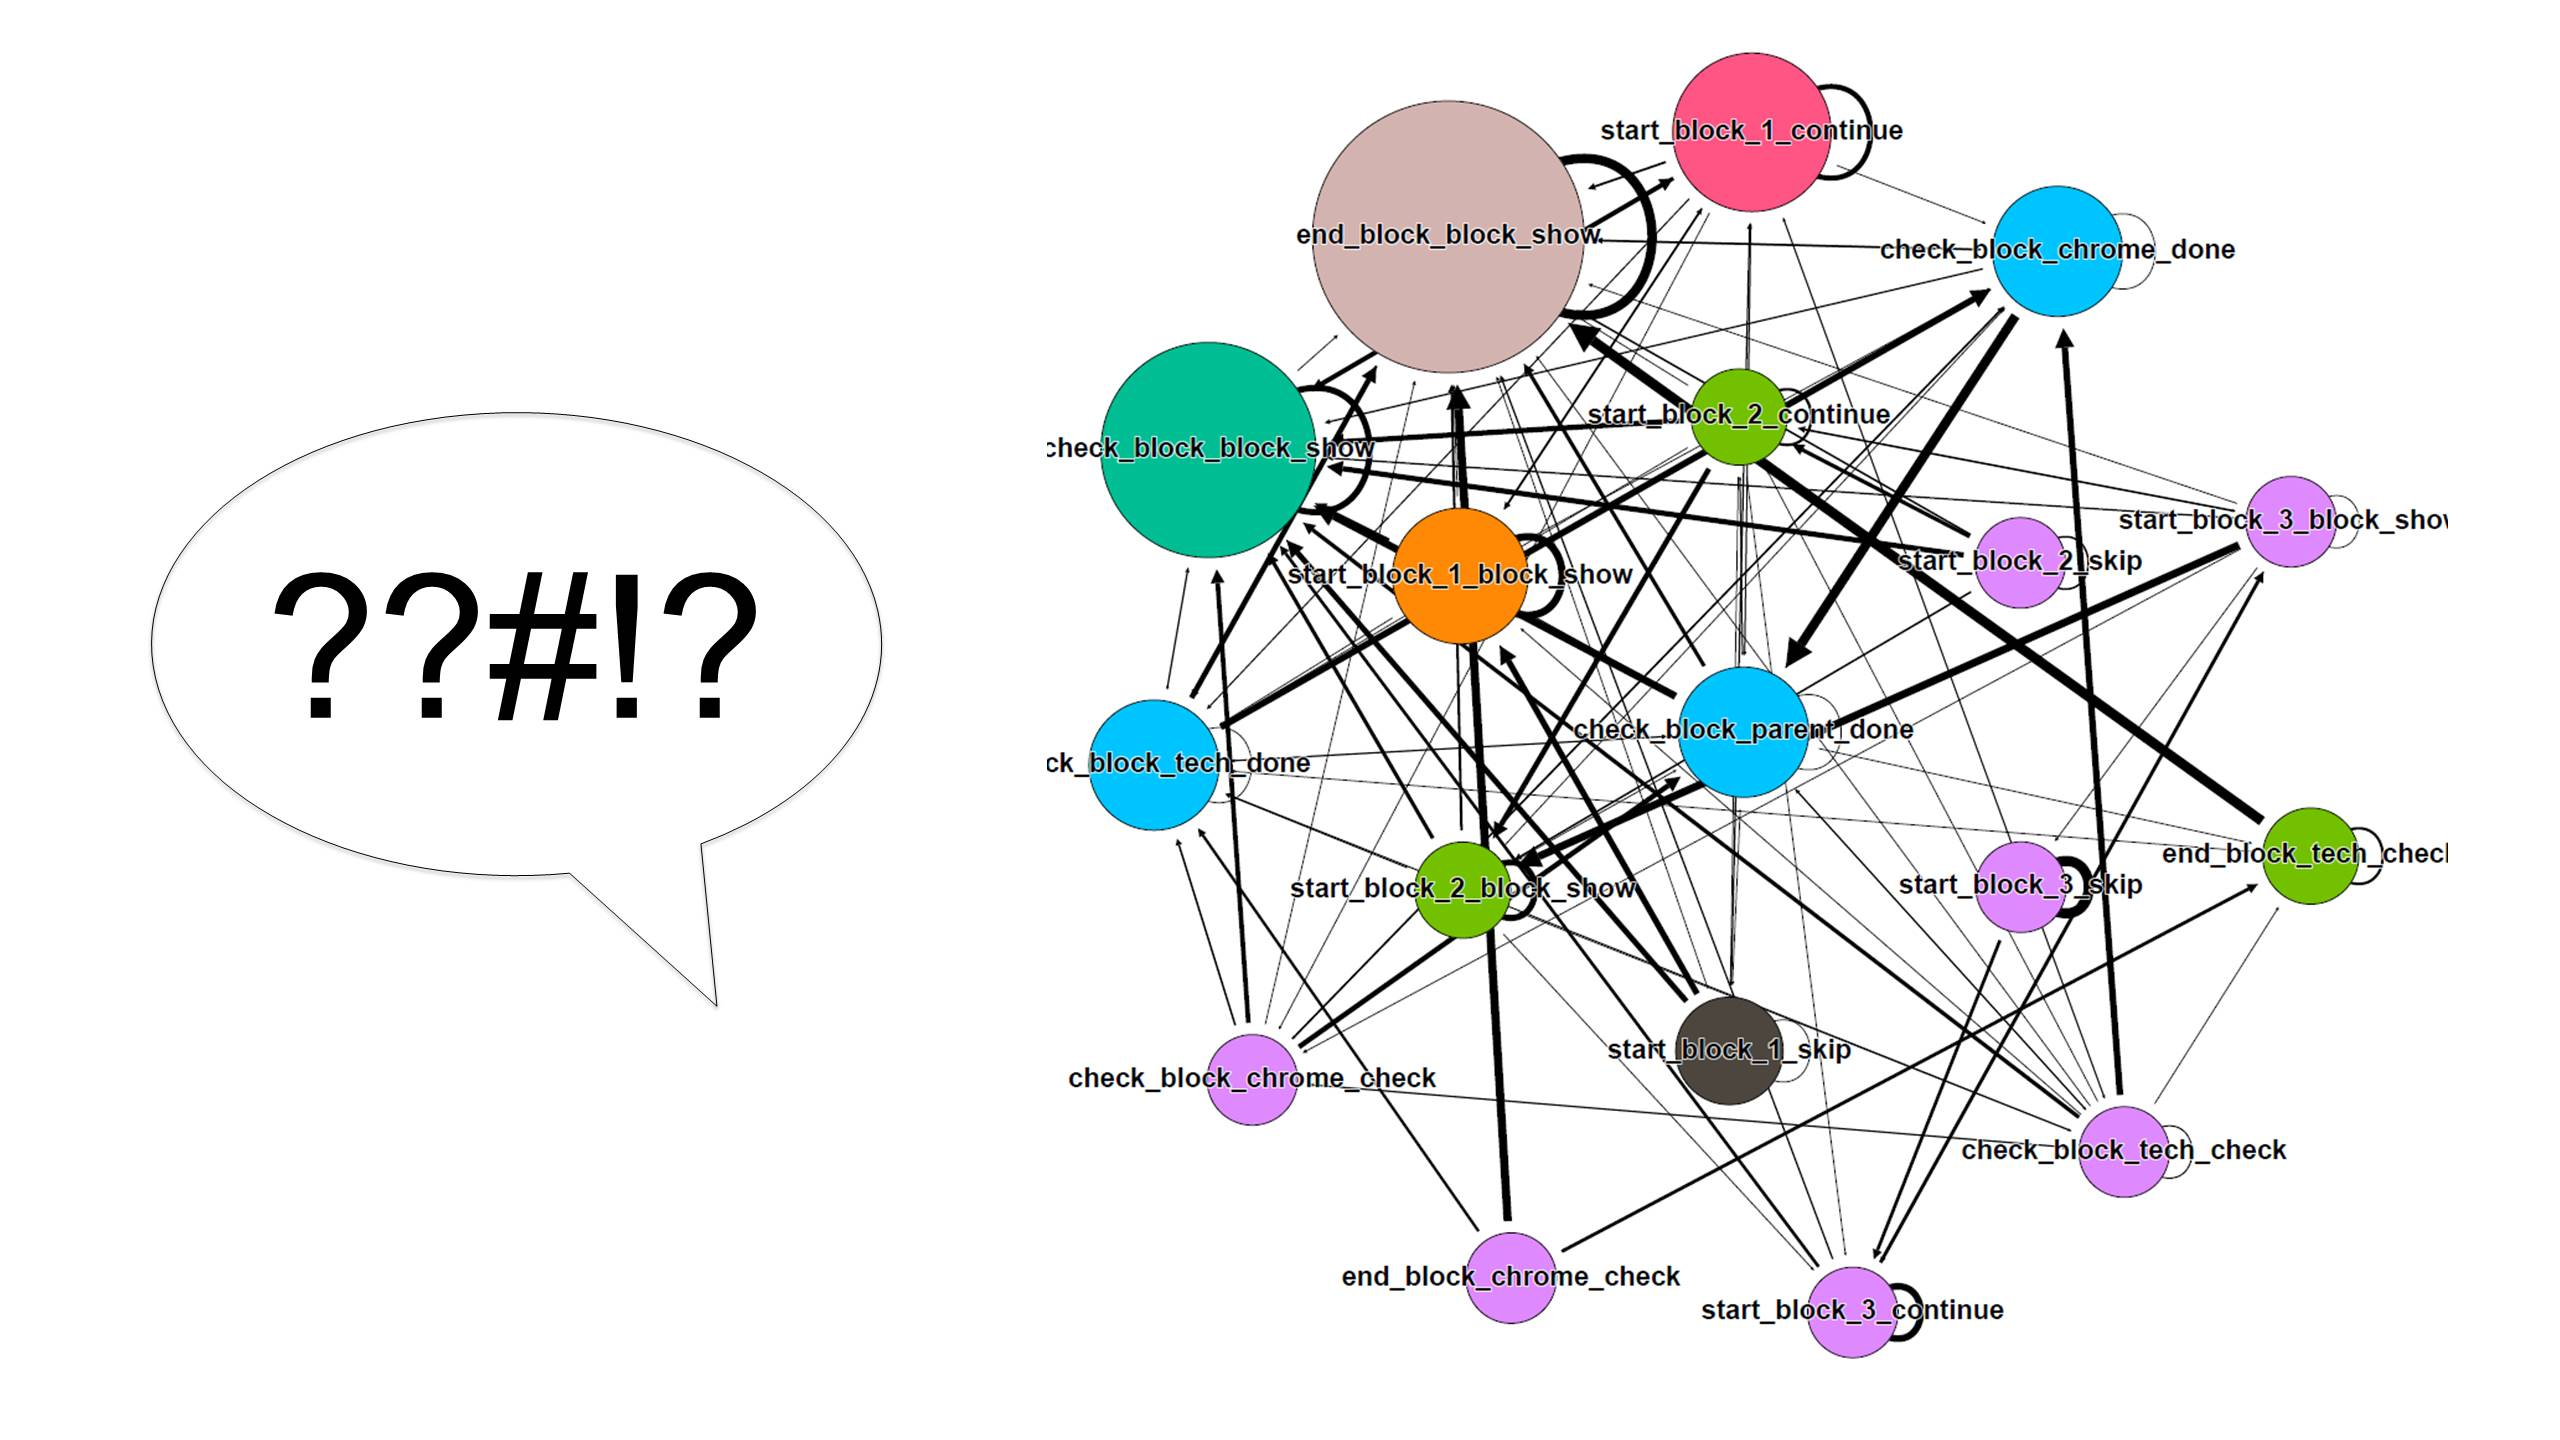
There is only one thing that can be clearly understood in this chaos: something went wrong. The onboarding process is linear, it is inherent in the design, it should not have such a network of links. And here you can immediately see that the user throws between the steps, between which there should be no transitions at all.
There can be two reasons for such a strange picture:
- the jambs crept into the log base;
- Shoals are present in the product itself - onboarding.
The first reason, most likely, takes place, but checking it is rather time-consuming, and fixing the logs will not help to improve the UX. But with the second, if there is one, it was urgent to do something. Therefore, we went to examine the nodes, identify the edges, which should not be, look for the causes of their occurrence. We saw that some users went in cycles and walked in circles, others fell out from the middle to the beginning, and the third, in principle, could not get out of the first two steps. The data was transferred to QA - and yes, it turned out that there were enough bugs in onboarding: this is such a by-product, a bit of a crutch product, it was not tested deep enough, because did not expect any problems. Now the whole recording process has changed.
This story showed us the unexpected application of Markov chains in the field of QA.
Try it yourself!
I posted my Python script for learning Markov chains in the public domain - use it for health. Documentation on GitHub, questions can be asked here, I will try to answer everything.
Well and useful links: NetworkX library , Graphviz visualizer . And here on Habré there is an article about Markov chains. The graphs in the article are made using Gephi .