How people act is understandable: they recognize places they have seen on travels or in movies, rely on erudition and common sense. The neural network has none of this. We became interested in what details in the pictures prompt her the answer. We conducted a study, the results of which today we will share with Habr.
This post will be interesting both to specialists in the field of computer vision, and to everyone who would like to look inside “artificial intelligence” and understand the logic of its work.
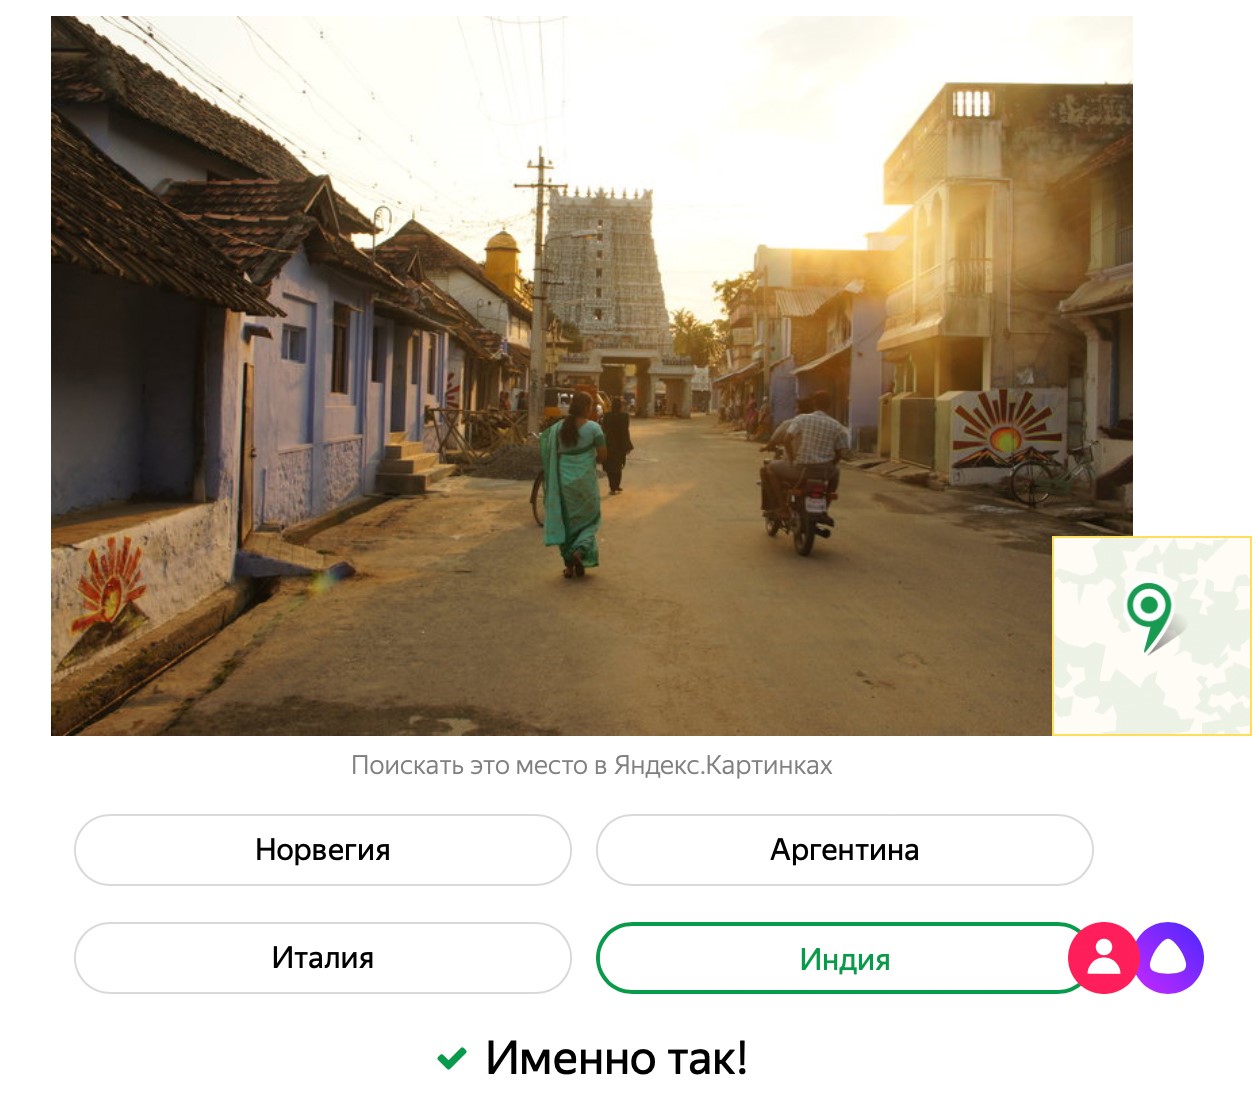
A few words about the game " Guess the country by photo ." In short, we took photos from Yandex.Maps and divided them into two groups. The first group was shown by neural networks, saying where each shot was taken. After looking at thousands of photos, the neural network made an idea of each country - that is, it independently identified combinations of signs by which it can be recognized. We use the second group of pictures in the game, Alice did not see them and does not remember them during the game. Alice plays well, but people have an advantage: we did not train the neural network to recognize license plate numbers, texts of signs and signs, flags of states.
For the game, we trained the model to predict the country from one photograph. We took the model of computer vision SE-ResNeXt-101 , trained on many tasks. The signs obtained from the image using this convolutional neural network are quite universal, so for the country classifier it was necessary to add only a few additional layers (the so-called head). Yandex.Mart data was used for training: approximately 2.5 million photos. Many pictures did not fit the game according to the criterion of beauty and were filtered. Beauty is understood as a combination of factors: the quality of the photo, the presence of people, text, forest, sea. Similar pictures were removed of the same place so that the model did not remember specific sights. After all the filtering, about 1 million photos remained. Having trained the model on this data, we got a fairly accurate classifier, which determines the country only by photo, without using additional information.
Since the classification takes place using a neural network, we cannot easily obtain an interpretation of predictions, in contrast to simpler linear models or decision trees. But we wanted to find out how the neural network determines from a regular photograph of a street or a house which country it is. And the most interesting cases are without attractions in the frame.
To do this, we trained the neural network from scratch, feeding it not whole images, but only small pieces of crop (so that the model does not remember specific places or large objects).
Thus, the task for the model has become noticeably more difficult (try to guess the country by a piece of the sky), the recognition accuracy has greatly decreased. But on the other hand, the neural network had to pay more attention to small details: unusual masonry, specific patterns, type of roof, plants. The size of the crop supplied to the model changed, and various models were obtained that looked at the photo at different levels of abstraction: the smaller the crop, the more difficult the task and the more attentive the model to details.
Algorithms for interpreting predictions can be applied to models that were trained on crop of different sizes. I would like to interpret the predictions in the source photographs. Most modern convolution networks use the Global Average Pooling (GAP) before the last layer - this makes it possible to train the network on one size, and apply on another. This is due to the fact that before the last layer, spatial features, distributed in width and height, are averaged into one number for each channel (feature map). Therefore, models trained on crop (for example, 160 × 160 pixels) can be used on the original, large images (800 × 800).
In fact, the GAP layer is needed not only for using the model at different resolutions or for regularization. It also helps the neural network to store information about the position of objects until the very last layer (just what we need).
The first method we tried is Class Activation Mapping (CAM).
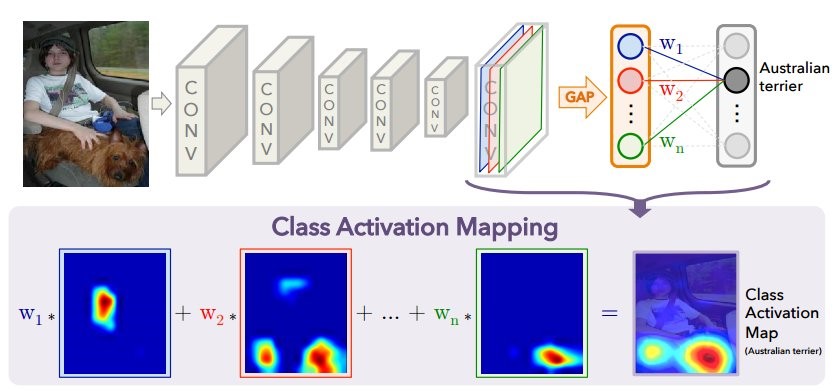
When the image is fed to the input of the neural network, then on the penultimate layer we get a reduced “image” (in fact, the activation tensor) with the most important signs for each predicted class. Using the CAM method, you can change the last layers so that the output is the probability of each class in each region. For example, if you need to predict 60 classes (countries), for an input image of 800 × 800, the final image will consist of 60 activation cards 25 × 25 in size. This is well illustrated in the original publication.
The diagram above shows the usual model with GAP: spatial features are compressed to one number for each channel (feature map), after which there is a fully-connected layer that predicts classes that finds the optimal weights for each channel. The following shows how to change the architecture to obtain the CAM method: the GAP layer is removed, and the weights of the last fully connected layer obtained during training with GAP (above in the diagram) are used for each channel at each point. For each picture, N activation maps are obtained for all predicted classes. For each country, the brighter the area on the “map”, the greater the contribution this section of the image made to the decision to choose a certain country. What is interesting: if after this operation we average each activation map (in essence, apply GAP), then we get just the initial prediction for each class.
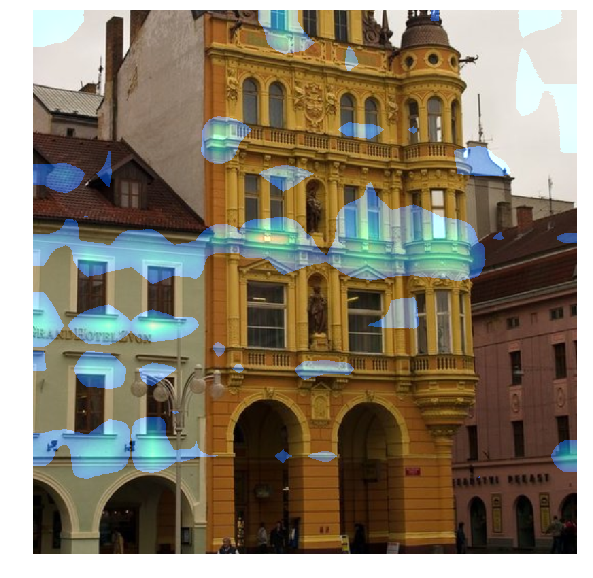
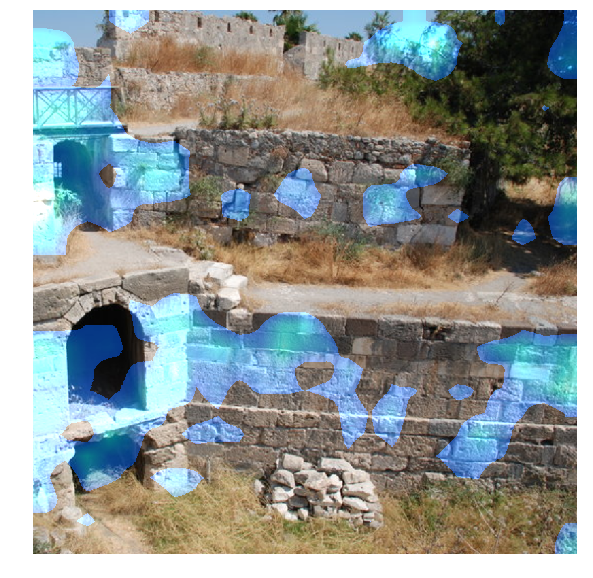
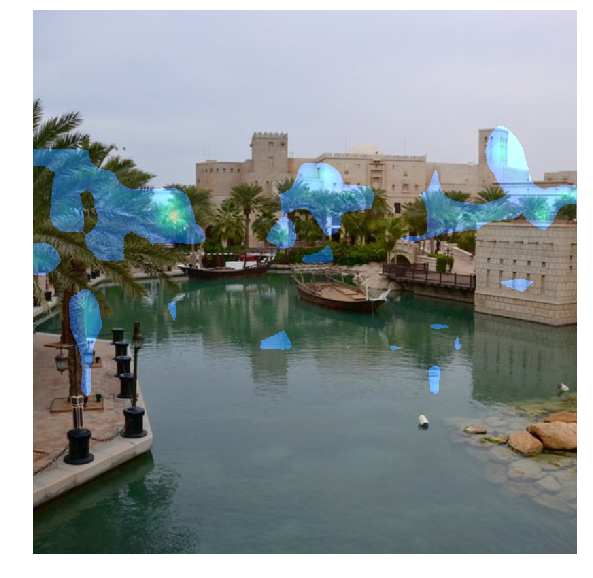
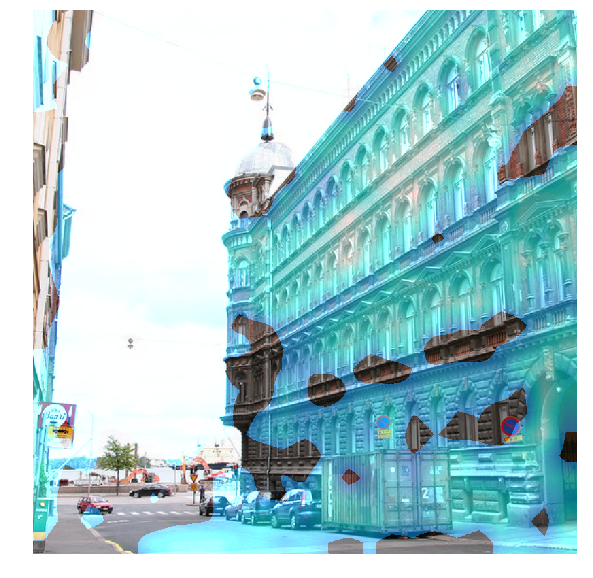
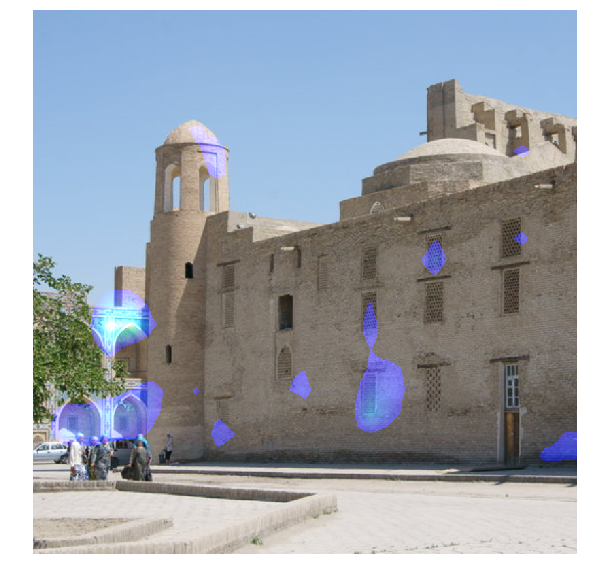
In the image you see an activation map for the most likely (according to the model) class. It was obtained by stretching the activation map 25 × 25 to the size of the original image 800 × 800.
Other examples 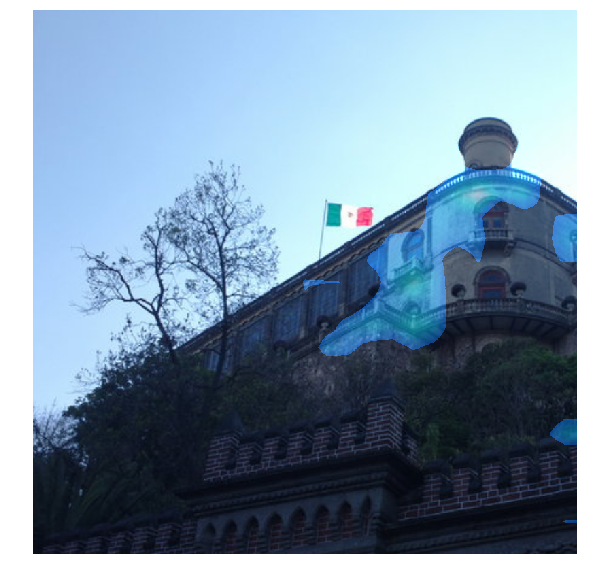


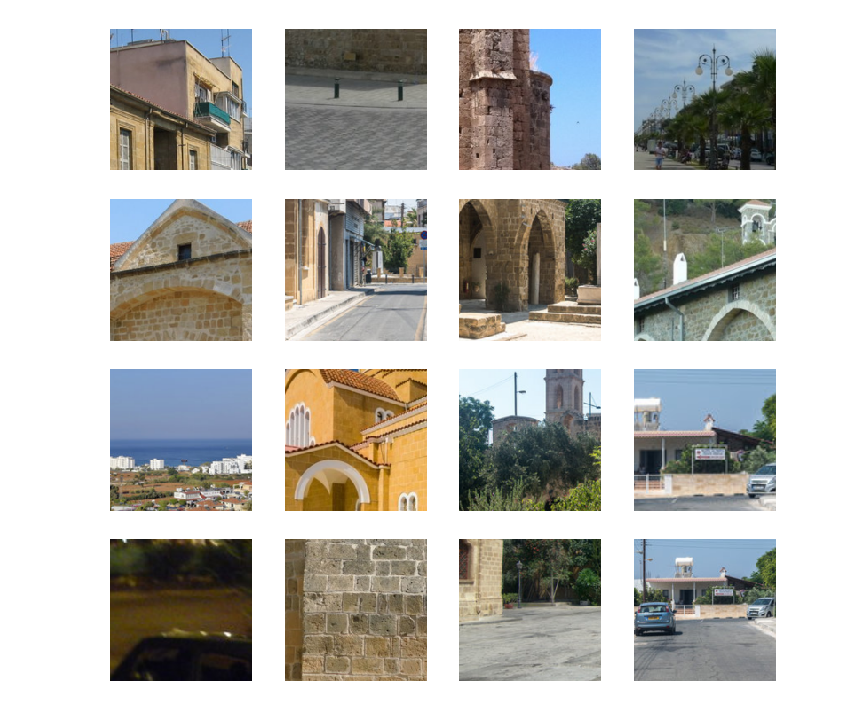
Having received such a map for each image, we can aggregate the most important crop for countries from different images. This allows you to look at the collection of crop, describing the country in the best way.
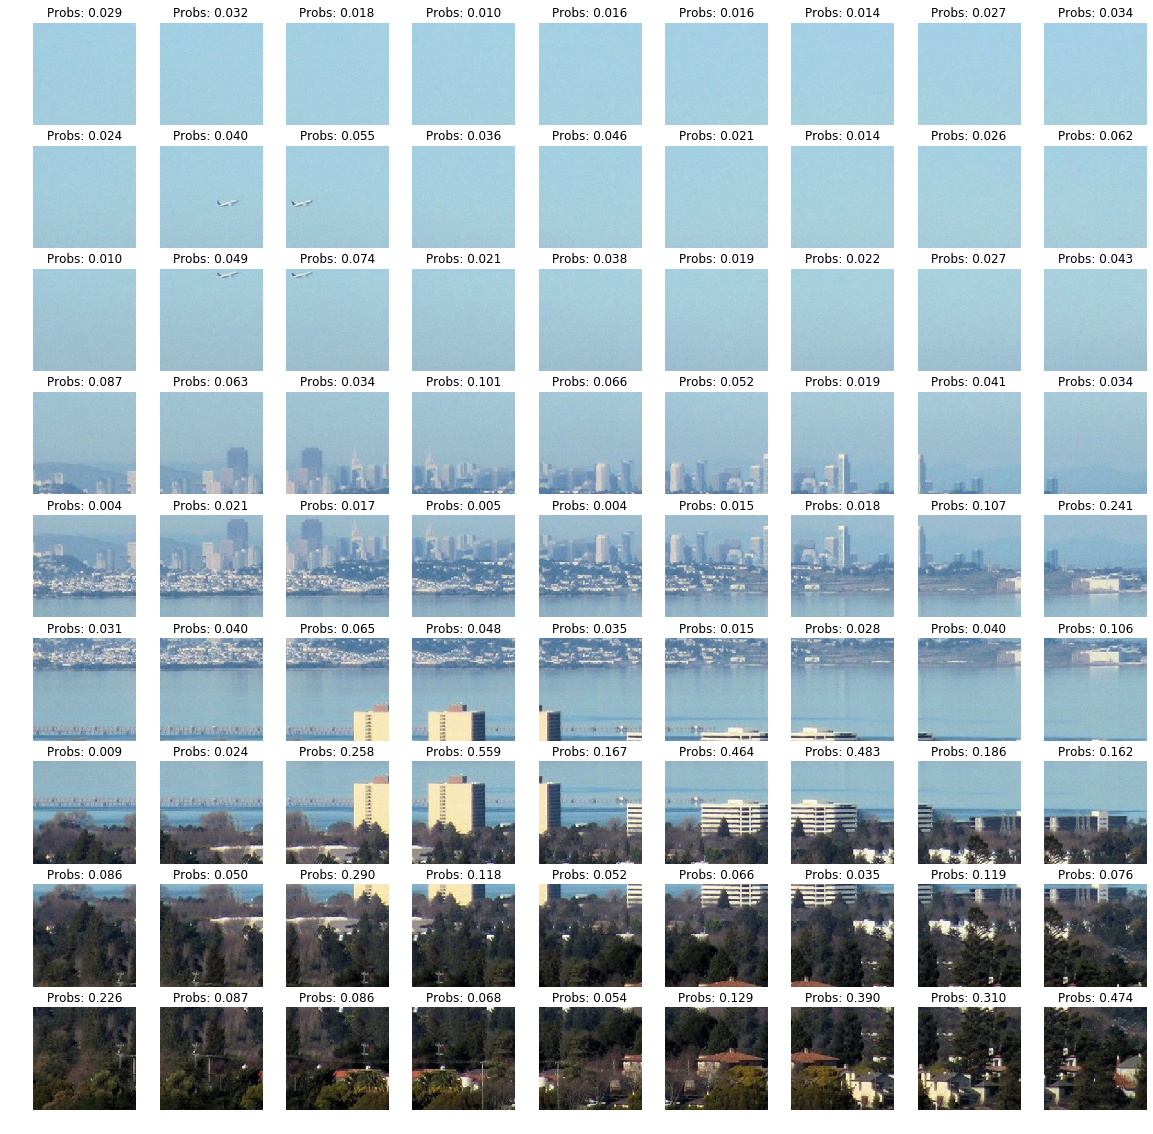
The second method, with which we decided to compare the first, is a simple exhaustive search. What if we take a model trained on small crop (for example, 160 × 160 pixels) and predict each piece on a large 800 × 800 image with it? Passing a sliding window overlaid over each area in the image, we get another version of the activation map, showing how likely each piece of the image belongs to the class of the predicted country.
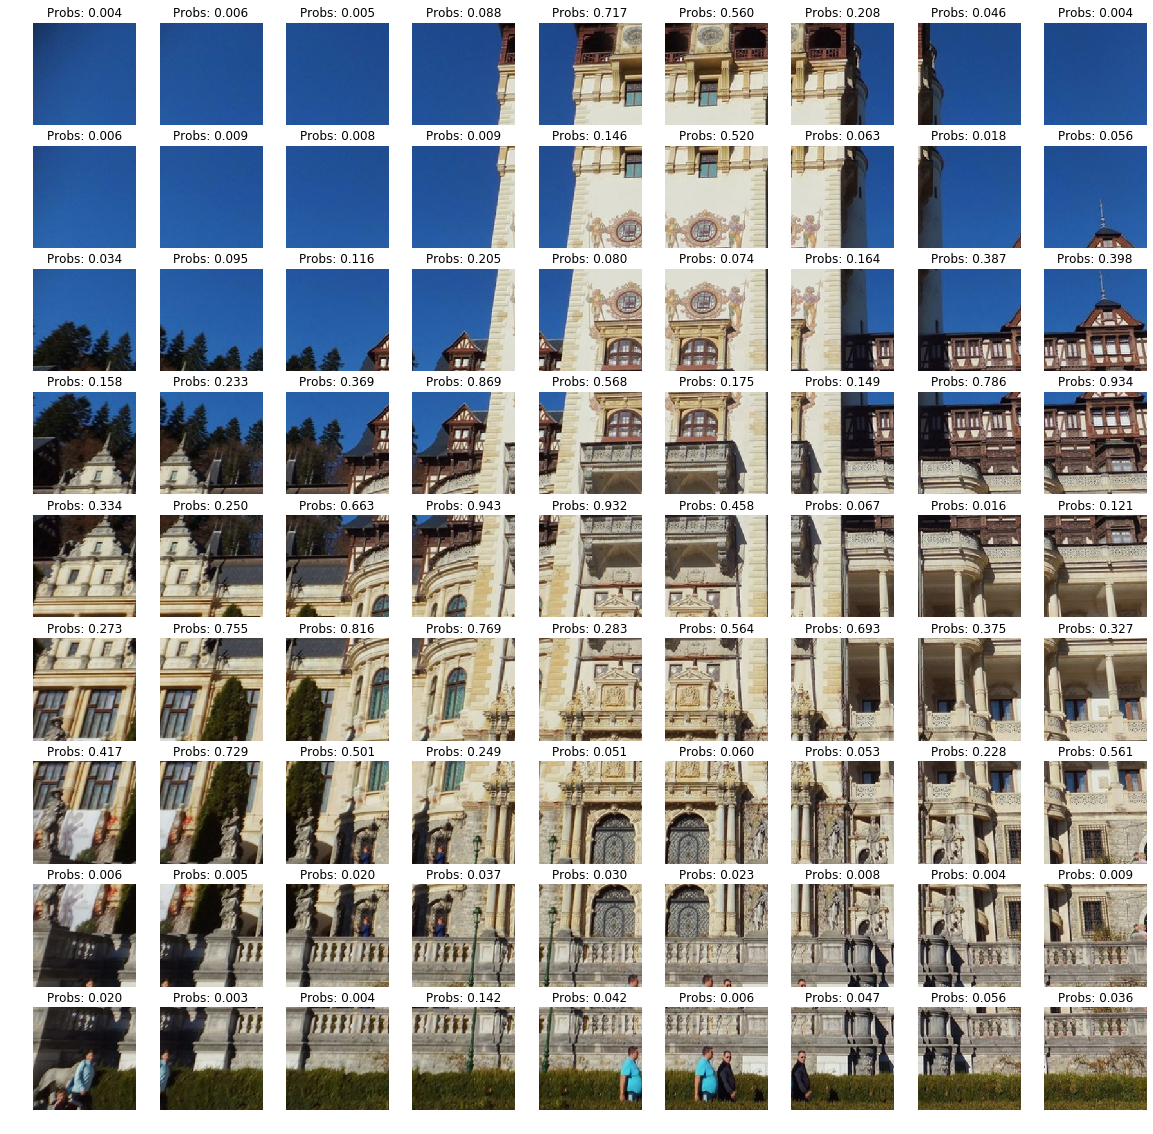
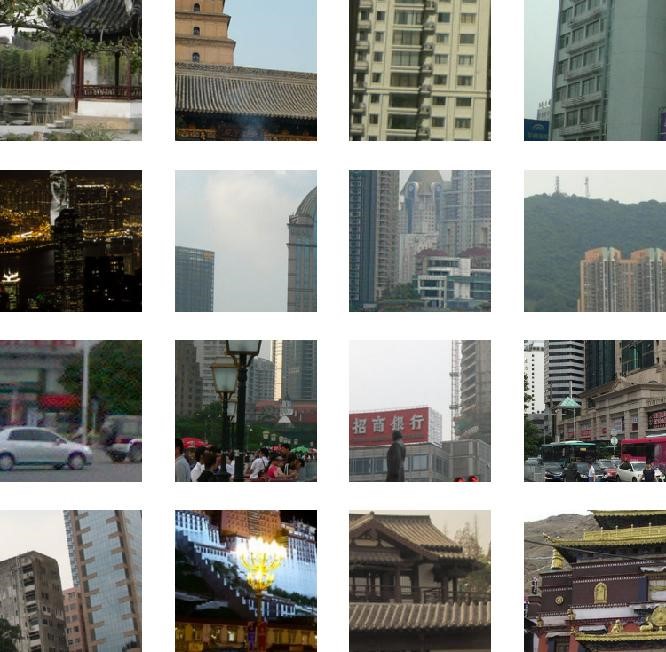
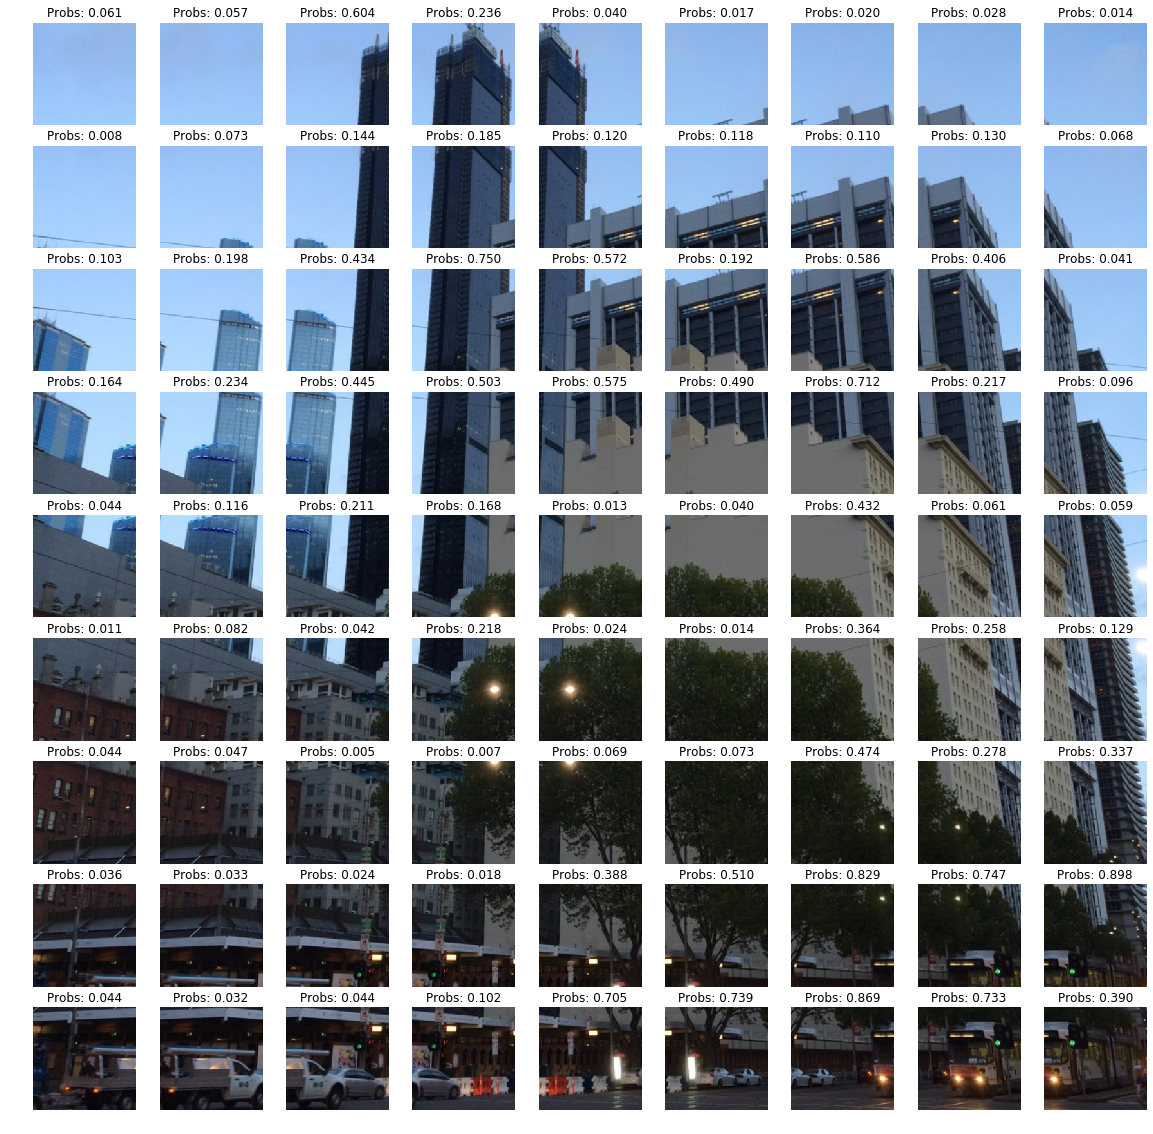
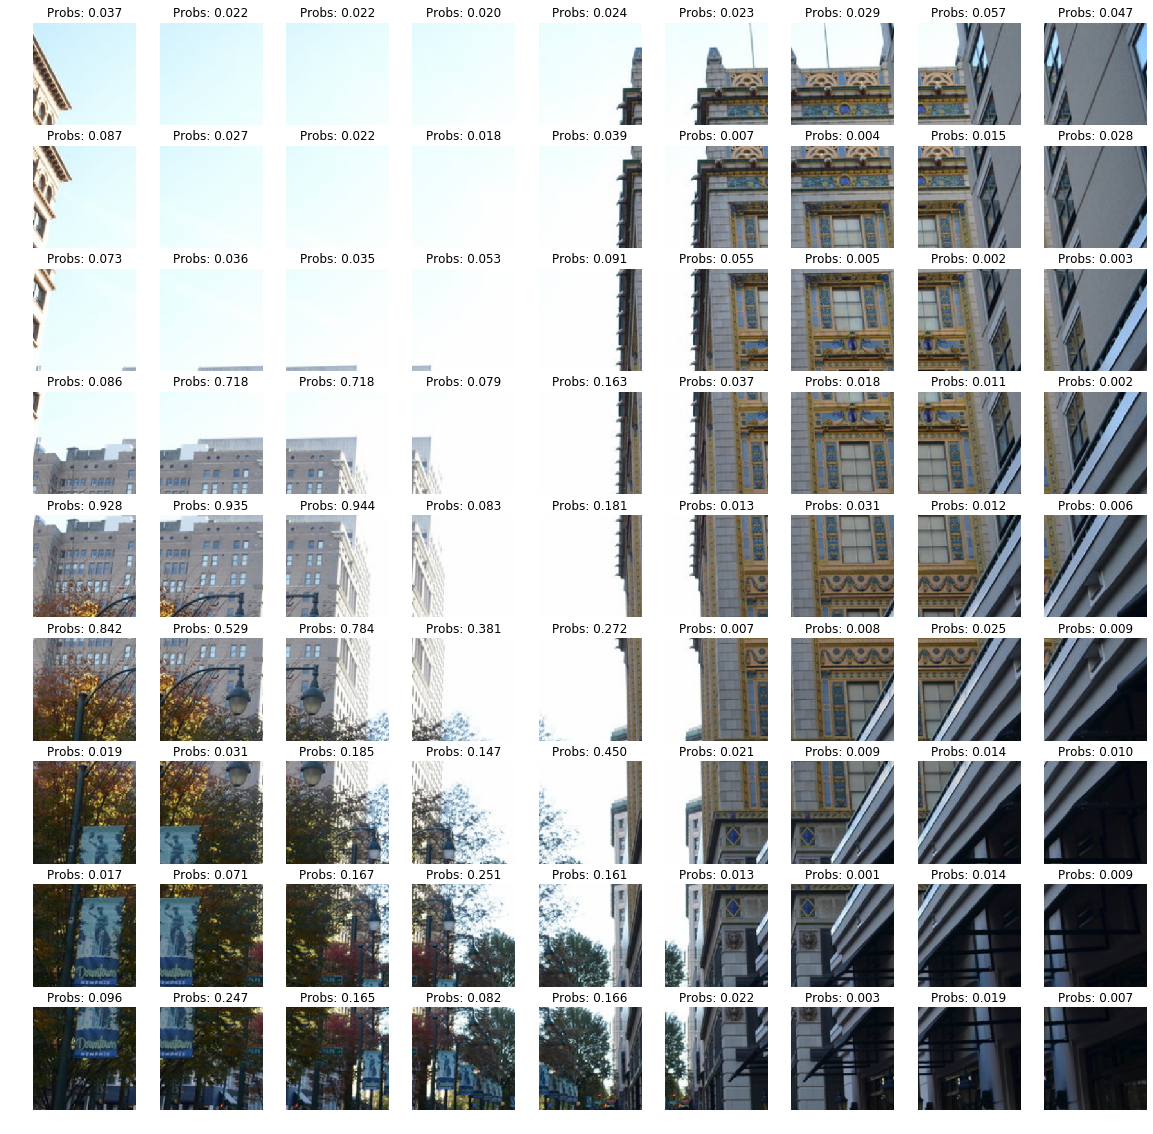
The image is cut into small cropes with a 160 × 160 overlap. For each cropping, the neural network makes predictions, the number above the cropping is the probability of belonging to the class that the model ultimately predicted.
More examples 
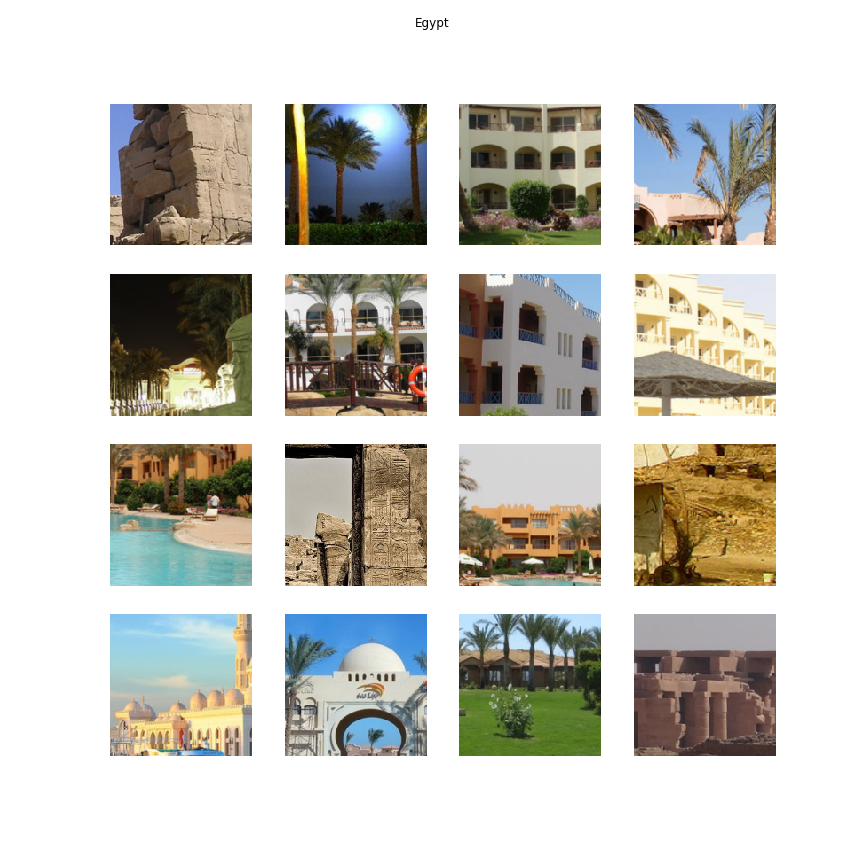
As in the first method, we can again choose the most likely pieces for each country. But the images obtained by both methods for the country can be monotonous (for example, a building from different angles or one version of the texture). Therefore, the best crop for the country is additionally clustered - then most of the similar images will be gathered in one cluster. After that, it will be enough to take one picture from each cluster with the maximum probability - for each country there will be as many images as there are clusters specified. We did clustering based on the characteristics obtained from the last classifier layer. Agglomerative clustering in our case proved to be the best.
China 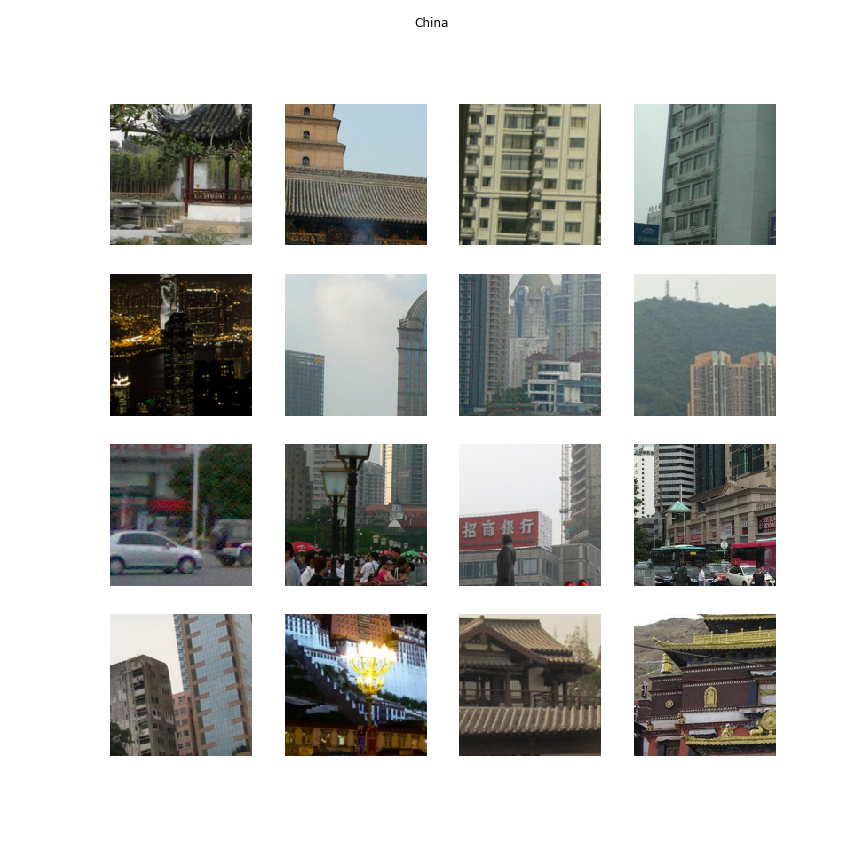
Italy 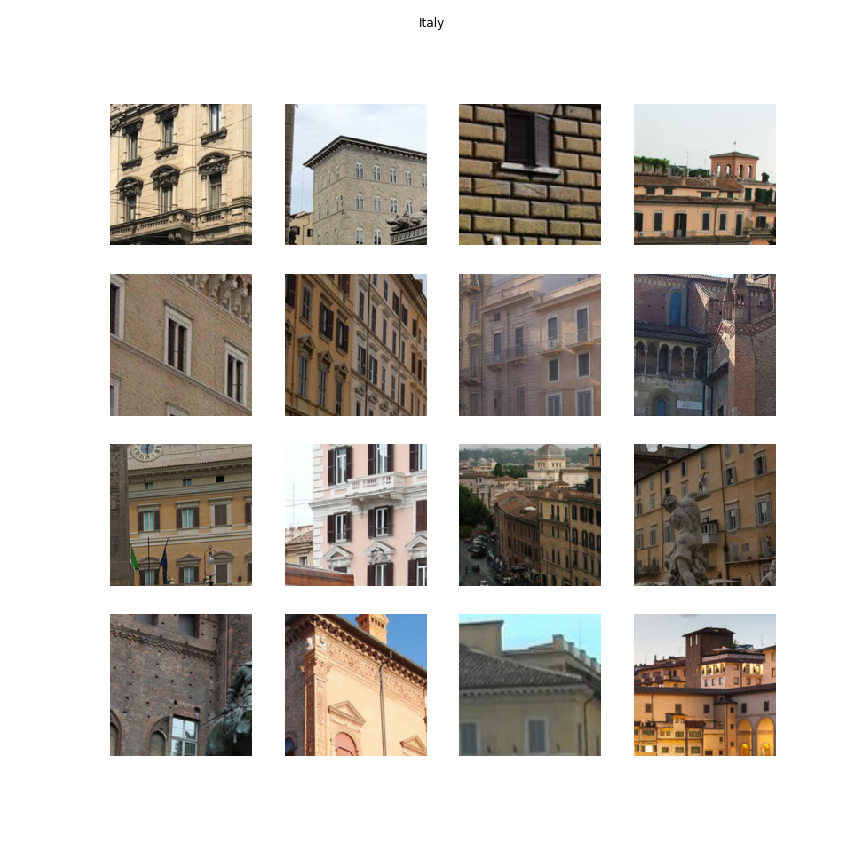
Germany 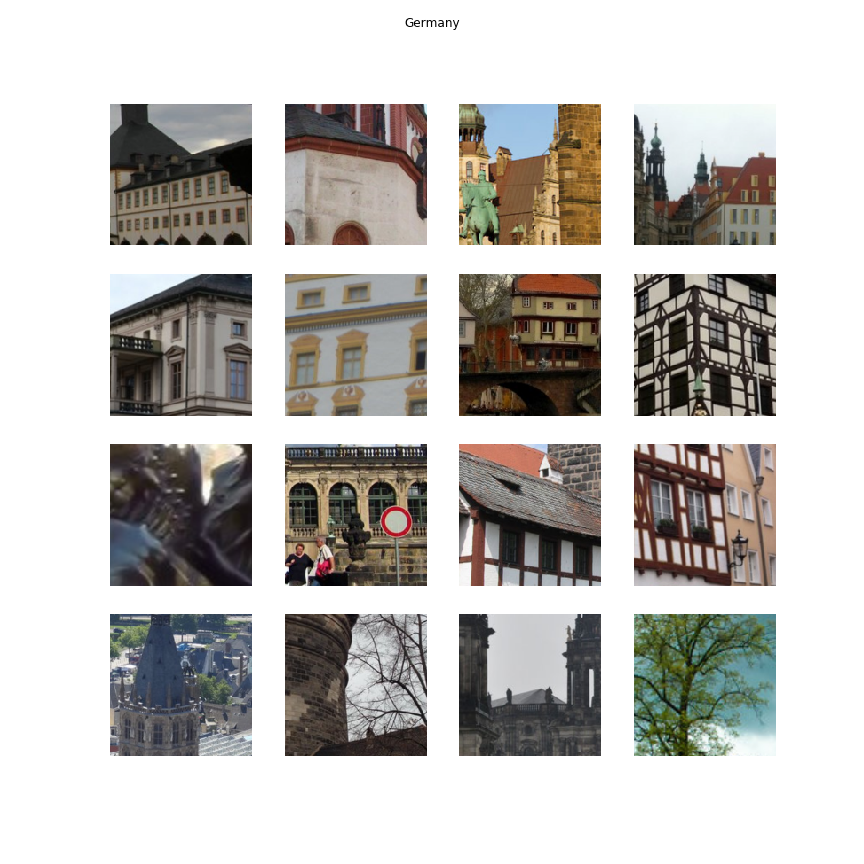
Mexico 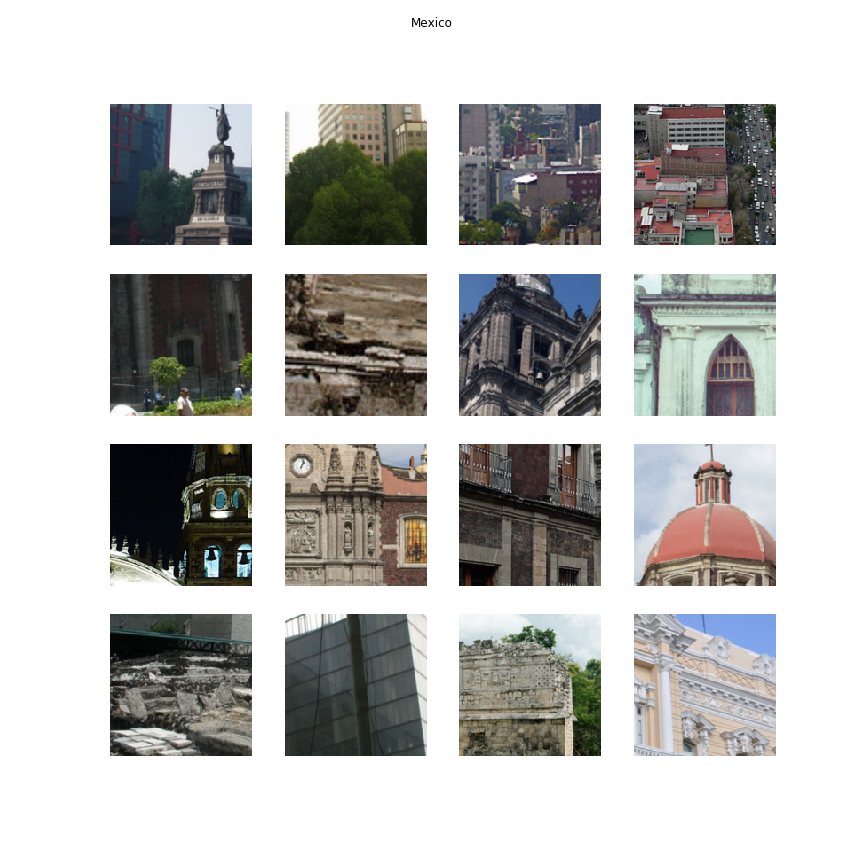
USA 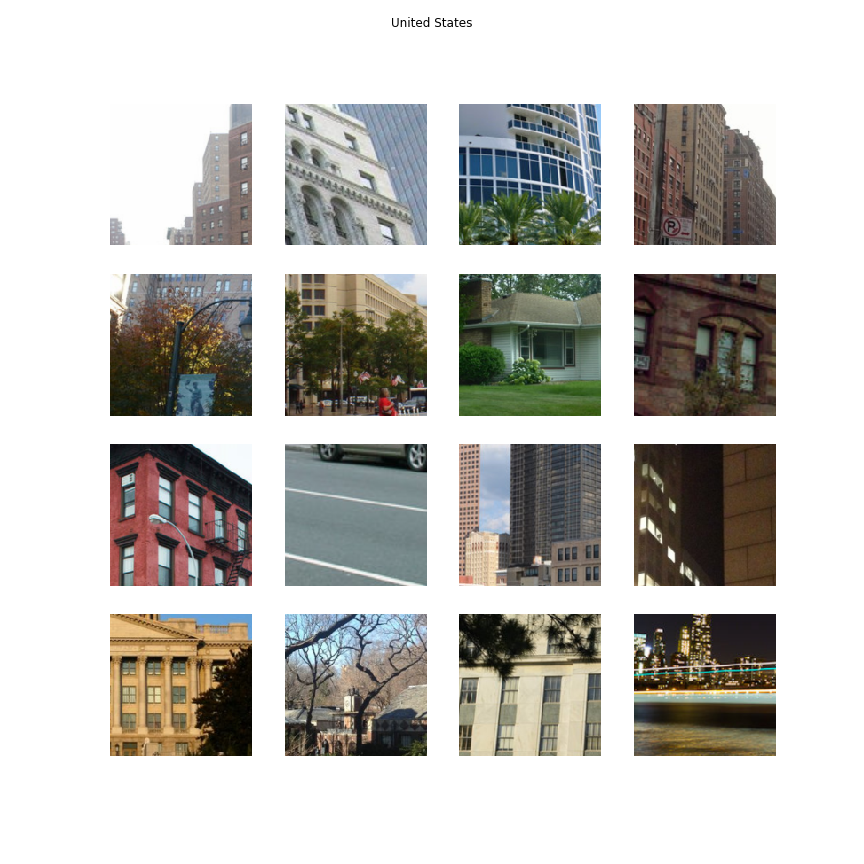
Turkey 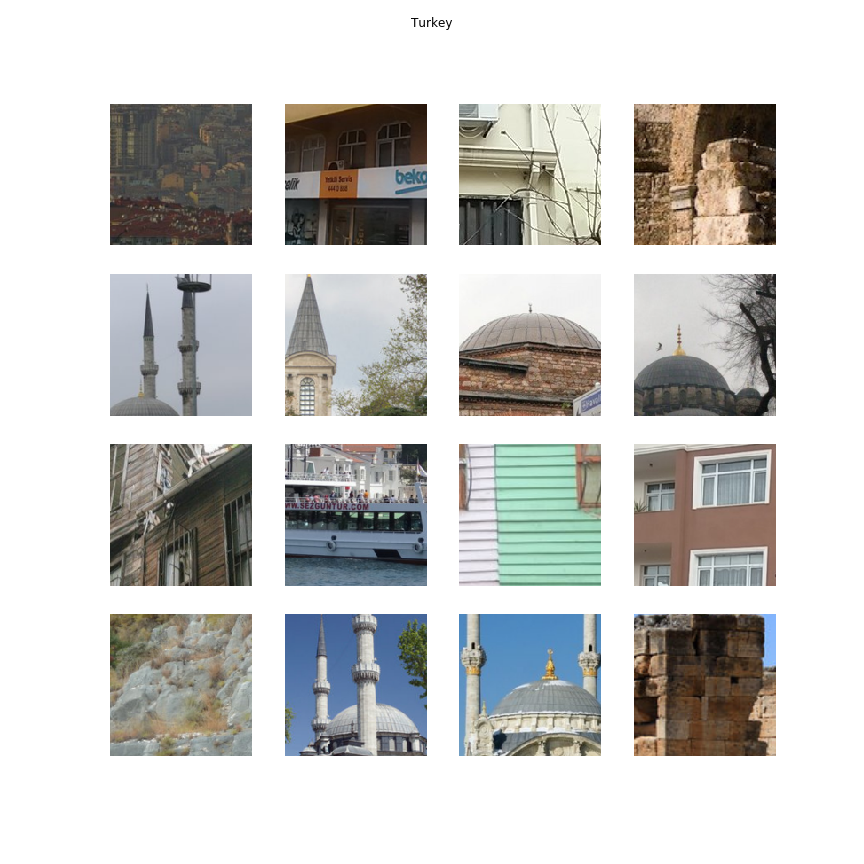
Australia 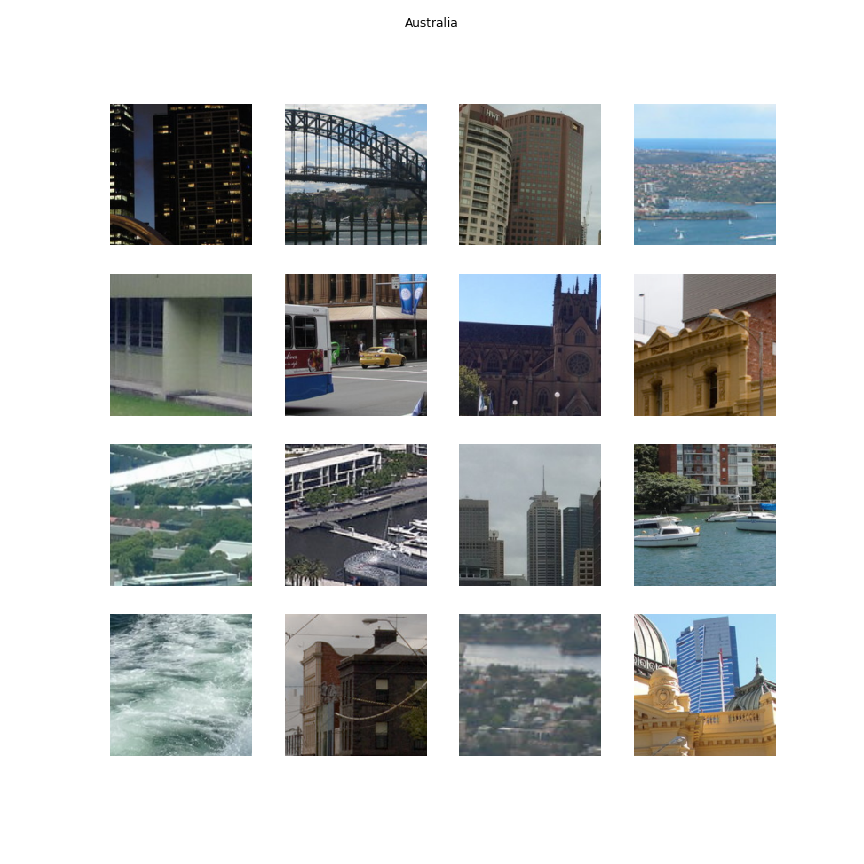
Having received a fairly similar pipeline for the two methods, you can iterate over the parameters of the algorithms to find the optimal combination. For example, we selected the size of the crop and settled on two options: 160 and 256 pixels. Crops less than 160 gave too small signs, according to which a person often does not understand what is depicted. And crop more than 256 sometimes contained several objects at once. Various parameters need to be selected at the stage of clustering: the choice of the main algorithm, as well as the features by which clustering is carried out. For many combinations of parameters, it was immediately clear that they give insufficiently “interesting” crop. But to select the final algorithm, we conducted side-by-side experiments on Tolok to understand which option, according to people, describes the specific country more “appropriately”.
It turned out to be unintuitive that a simpler method of finding crop in the picture (normal sorting) finds more “interesting” objects. This may be due to the fact that in the second method (enumeration) the neural network does not see the neighboring part of the image, and in the CAM method the environment of the point affects the result. As a result, we received a visualization of the characteristic features of each country in automatic mode.
So now we know which parts of the frame are of decisive importance for the neural network, and we can see what fell on them. For example, the Netherlands recognizes a neural network by the combination of dark brick walls and white window contours, the UAE - by specific skyscrapers against the background of palm trees, and Iran - by the characteristic arches and ornaments on the facades.