4.2.2. RBER and disk age (excluding PE cycles).
Figure 1 shows a significant correlation between RBER and age, which is equal to the number of months of disk operation in the field. However, this may be a false correlation, since it is likely that older disks have more PE and therefore RBER is more interconnected with PE cycles.
In order to eliminate the effect of age on wear caused by PE cycles, we grouped all months of operation into containers, using the deciles of the distribution of the PE cycle as a cutoff between containers, for example, the first container contains all months of operation of the disk until the first decile of the distribution of the PE cycle, and so on Further. We checked that within each container the correlation between the PE and RBER cycles is rather insignificant (since each container covers only a small range of PE cycles), and then we calculated the correlation coefficient between RBER and the age of the disk separately for each container.
We conducted this analysis separately for each model, because any observed correlations are caused not by differences between the younger and older models, but solely by the age of the disks of the same model. We observed that even after limiting the effect of the influence of PE cycles as described above, for all disk models, there was still a significant correlation between the number of months of disk operation in the field and its RBER (correlation coefficients ranged from 0.2 to 0.4).
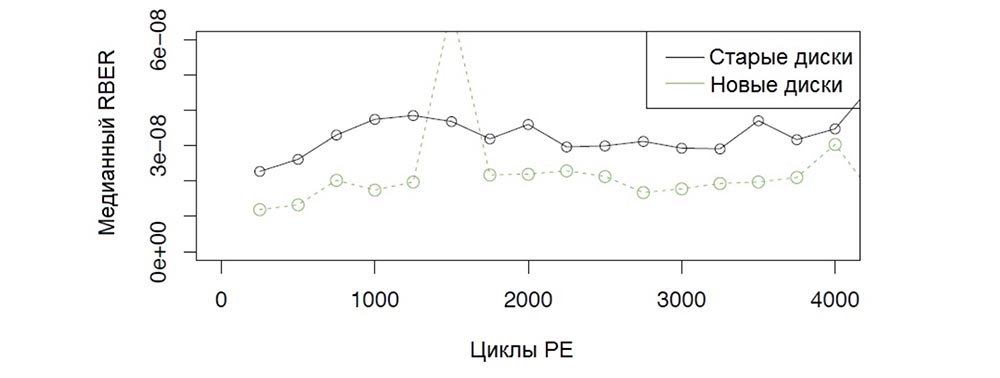
Fig. 3. The relationship between RBER and the number of PE cycles for new and old drives indicates that the age of the drive affects the RBER value regardless of the PE cycles caused by wear.
We also graphically visualized the influence of the drive age by separating the days of operation of the disk at the “young” age of 1 year and the days of operation of the disk over the age of 4 years, after which we plotted the dependence of the RBER of each group on the number of PE cycles. Figure 3 shows these results for the MLC-D drive model. We see a noticeable difference in the values of the RBER coefficient between the groups of old and new disks throughout all values of the PE cycles.
From this, we concluded that the age, measured by the days of disk use in the field, has a significant effect on RBER, regardless of the wear of memory cells due to the influence of PE cycles. This means that other factors, for example, silicon aging, play a large role in the physical deterioration of the disk.
4.2.3. RBER and workload.
Bit errors are thought to be caused by one of four mechanisms:
- Retention errors when a memory cell loses data over time
Read disturb errors, in which a read operation damages the contents of a neighboring cell; - Write disturb errors, in which a read operation damages the contents of a neighboring cell;
- incomplete erase errors when the erase operation does not completely delete the contents of the cell.
Errors related to the last three types (read disturb, write disturb, incomplete erase) correlate with workload, so understanding the correlation between RBER and workload helps us understand the prevalence of various error mechanisms. In a recent study, “A large-scale study of flash memory failures in the field” (MEZA, J., WU, Q., KUMAR, S., MUTLU, O. “A large-scale study of flash memory failures in the field.” In Proceedings of the 2015 ACM SIGMETRICS International Conference on Measurement and Modeling of Computer Systems, New York, 2015, SIGMETRICS '15, ACM, pp. 177–190) concluded that storage errors prevail in the field, while reading violation errors are pretty minor.
Figure 1 shows a significant relationship between the RBER value in a given month of disk operation and the number of read, write and erase operations in the same month for some models (for example, a correlation coefficient above 0.2 for the MLC-B model and above 0.6 for the model SLC-B). However, this may be a false correlation, as the monthly workload may be related to the total number of PE cycles.
We used the same methodology described in Section 4.2.2 to isolate the effects of the workload from the effects of PE cycles by isolating the months of operation of the drive based on previous PE cycles, and then we determined the correlation coefficients separately for each container.
We saw that the correlation between the number of read operations in a given month of disk operation and the RBER value in the same month is preserved for the MLC-B and SLC-B models, even if the PE cycles are limited. We also repeated a similar analysis, where we excluded the effect of the read operations on the number of parallel write and erase operations, and concluded that the correlation between RBER and the number of read operations is preserved for the SLC-B model.
Figure 1 also shows the correlation between RBER and the write and erase operations, so we repeated the same analysis for the read, write and erase operations. We concluded that while limiting the effects of PE loops and read operations, there is no relationship between the RBER value and the number of write and erase operations.
Thus, there are disk models where read violation errors have a significant impact on RBER. On the other hand, there is no evidence that RBER is affected by write errors or incomplete erase errors.
4.2.4 RBER and lithography.
The differences in the size of objects can partially explain the differences in the RBER values for disk models using the same technology, i.e., MLC or SLC. (see Table 1 for an overview of the lithography of the various models involved in this study).
For example, 2 SLC models with 34 nm lithography (SLC-A and SLC-D models) have RBER, which is an order of magnitude higher than 2 models with 50 nm microelectronic lithography (SLC-B and SLC-C models). In the case of MLC models, only the 43nm model (MLC-B) has a median RBER, which is 50% higher than 3 other models with 50 nm lithography. Moreover, this RBER difference increases 4-fold as the disc wears, as shown in Figure 2. Finally, thinner lithography may explain the higher RBER for eMLC drives compared to MLC drives. Overall, we have clear evidence that lithography affects RBER.
4.2.5. The presence of other errors.
We examined the relationship between RBER and other types of errors, for example, fatal errors, timeout errors, etc., in particular, whether the RBER value will become higher after a month from the influence of other types of errors.
Figure 1 shows that while the RBER value for the previous month allows us to predict future RBER values (correlation coefficient above 0.8), there is no significant correlation between fatal errors and RBER (the group of elements in the rightmost one in Fig. 1). For other types of errors, the correlation coefficient is even lower (not shown in the figure). We continued to investigate the relationship between RBER and fatal errors in section 5.2 of this article.
4.2.6. The influence of other factors.
We found evidence that there are factors that have a significant impact on RBER and which could not account for the data we received. In particular, we noticed that the RBER for a particular disk model varies depending on the cluster in which the disk is deployed. A good example is Figure 4, which shows the dependence of RBER on PE cycles for MLC-D drives in three different clusters (dashed lines) and its comparison with RBER for this model relative to the total number of disks (solid line). We believe that these differences persist even when we limit the influence of factors such as the age of the disk or the number of read operations.
One possible explanation for this factor is differences in the type of workload in different clusters, since we observe that clusters whose workload has the highest read / write coefficients have the highest RBER.
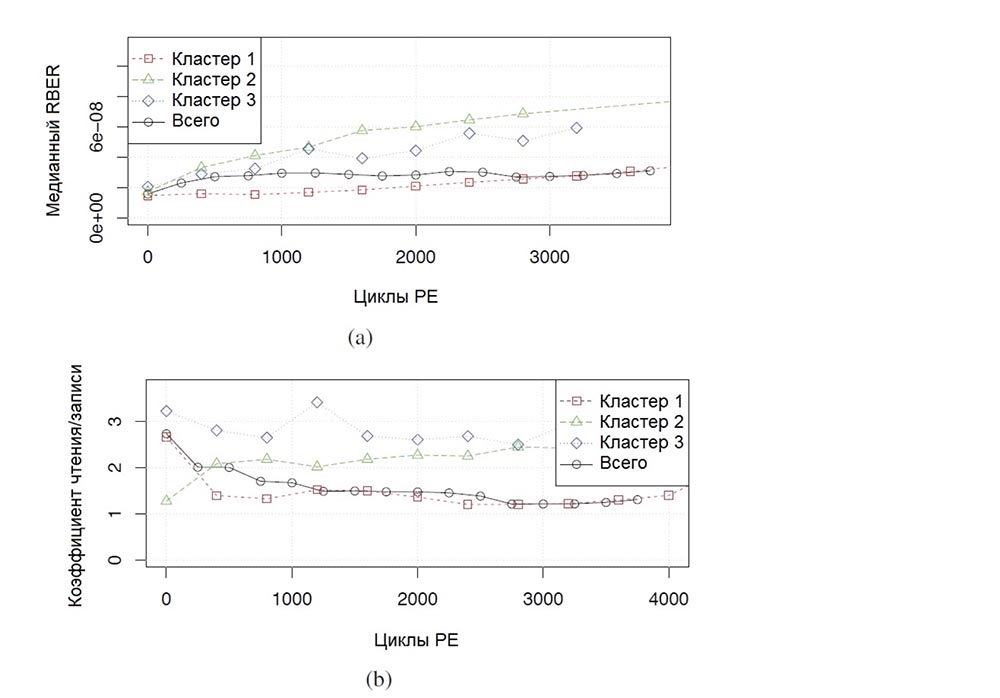
Fig. 4 a), b). The median RBER values depending on the PE cycles in three different clusters and the dependence of the read / write coefficient on the number of PE cycles in three different clusters.
For example, Figure 4 (b) shows the read / write coefficients of different clusters for the MLC-D drive model. However, the read / write ratio does not explain the differences between the clusters for all models, therefore, there may be other factors that our data do not take into account, for example, environmental factors or other external parameters of the workload.
4.3. RBER during accelerated durability tests.
Most of the scientific work, as well as tests conducted when purchasing media on an industrial scale, predict the reliability of devices in the field based on the results of accelerated durability tests. We decided to understand how the results of such tests correspond to the practical experience of operating solid-state storage media.
Analysis of the test results carried out according to the general methodology of accelerated testing for equipment supplied to Google data centers showed that the RBER field values are significantly higher than predicted. For example, for the eMLC-a model, the median RBER for field-operated discs (at the end of the test, the number of PE cycles reached 600) was 1e-05, while according to the results of preliminary accelerated testing, such a RBER value should have corresponded to more than 4000 cycles of PE. This indicates that it is very difficult to accurately predict the RBER value in the field based on RBER estimates obtained from laboratory tests.
We also noted that some types of errors are difficult to reproduce during accelerated testing. For example, in the case of the MLC-B model, almost 60% of drives in the field have uncorrectable errors and almost 80% of drives have damaged blocks. However, during accelerated durability tests, none of the six devices experienced any uncorrectable errors until the discs reached more than three times the PE cycle limit. For eMLC models, uncorrectable errors in the field occurred in more than 80% of the disks, while in accelerated testing, such errors occurred after reaching 15,000 PE cycles.
We also reviewed the RBER described in a previous research paper, which was based on experiments in a controlled environment, and came to the conclusion that the range of variation in values is extremely high. For example, L.M. Groups and others in their 2009–2012 work indicate RBER values for disks that are close to reaching the limit values for PE cycles. For example, for SLC and MLC devices with a lithography size similar to that used in our work (25-50nm), the RBER value ranges from 1e-08 to 1e-03, and for most drive models tested, the RBER value was close to 1e-06.
In our study, three disk models that reached the PE cycle limit had RBERs ranging from 3e-08 to 8e-08. Even taking into account that our numbers are lower bounds and in the absolutely worst case they can take values 16 times larger, or taking into account the 95th percentile RBER, the values we obtained are still much lower.
In general, while real RBER values in the field are higher than predicted values based on accelerated durability tests, they are still lower than most RBERs for similar devices reported in other research papers, and which are calculated on the basis of laboratory tests. This means that you should not rely on the predicted values of RBER in the field, which were obtained on the basis of the results of accelerated durability tests.
5. Unrecoverable errors.
Given the widespread occurrence of uncorrectable errors (UE), which were discussed in section 3 of this article, in this section we study their characteristics in more detail. We begin by discussing which metric to use to measure UEs, consider how they relate to RBER, and how various factors influence UEs.
5.1. Why the UBER coefficient does not make sense.
The standard metric characterizing uncorrectable errors is the UBER, the ratio of uncorrectable bit errors, that is, the ratio of the number of uncorrectable bit errors to the total number of bits read.
This metric implicitly assumes that the number of uncorrectable errors is somehow tied to the number of bits read, which means it should be normalized by this number.
This assumption is true for correctable errors, where it is found that the number of errors observed in a given month correlates strongly with the number of read operations over the same period of time (Spearman's correlation coefficient is greater than 0.9). The reason for such a strong correlation is that even one damaged bit, while it is being fixed with ECC, will continue to increase the number of errors with each read operation addressed to it, since the estimate of the cell containing the damaged bit is not corrected immediately when an error is detected (discs only periodically rewrite pages with damaged bits).
The same assumption does not work for uncorrectable errors. An unrecoverable error precludes further use of the damaged block, therefore, once detected, such a block will not affect the number of errors in the future.
To officially confirm this assumption, we used various metrics to measure the relationship between the number of read operations in a given month of disk operation and the number of fatal errors for the same period of time, including various correlation coefficients (Pearson, Spearman, Kendall), as well as a visual study of the graphs . In addition to the number of uncorrectable errors, we also examined the frequency of incidents with uncorrectable errors (for example, the likelihood that a disk will have at least one such incident for a certain period of time) and their relationship with read operations.
We found no evidence of a correlation between the number of reads and the number of fatal errors. For all drive models, correlation coefficients were below 0.02, and the graphs showed no increase in UE with an increase in the number of read operations.
In section 5.4 of this article, we consider that write and erase operations also have no relation to uncorrectable errors, therefore, an alternative definition of UBER, which is normalized by write or erase operations instead of read operations, does not matter.
Therefore, we conclude that UBER is not a significant metric, with the possible exception of testing in controlled environments where the number of read operations is set by the experimenter. If UBER is used as a metric during field trials, it will artificially reduce the error rate for drives with a high number of reads and artificially increase this frequency for drives with a low number of reads, since uncorrectable errors occur regardless of the number of read operations.
5.2. Fatal errors and RBER.
The relevance of RBER is explained by the fact that it serves as a measure of determining the overall reliability of the drive, in particular, based on the probability of occurrence of uncorrectable errors. In their work, N. Mielke and others in 2008 were the first to determine the expected frequency of fatal errors as a function of RBER. Since then, many system developers have used similar methods, for example, estimating the expected frequency of uncorrectable errors depending on the RBER and type of ECC.
The purpose of this section is to characterize how well RBER predicts uncorrectable errors. Let's start with Figure 5a, which shows the graphs of the median RBER value for a number of first-generation drive models, relative to the fraction of the days of their operation during which UE uncorrectable errors occurred. It should be noted that some of the 16 models shown in the graph are not shown in Table 1 due to a lack of analytical information.
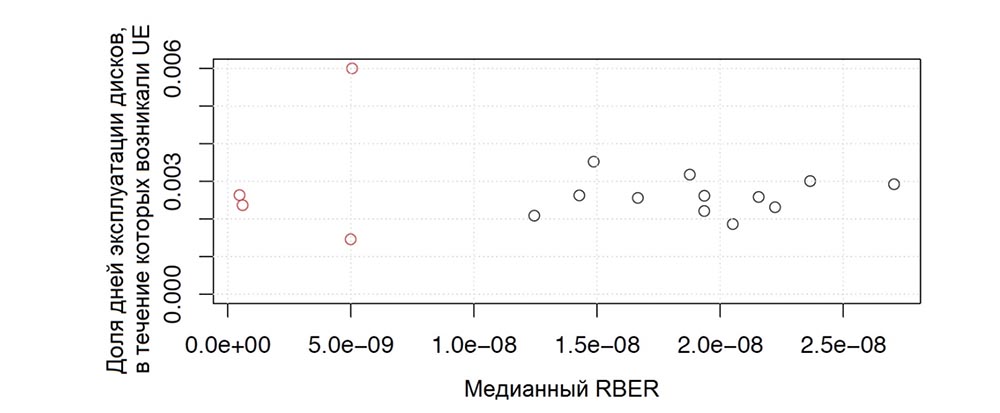
Fig. 5a. Correlation of median RBER with uncorrectable errors for various drive models.
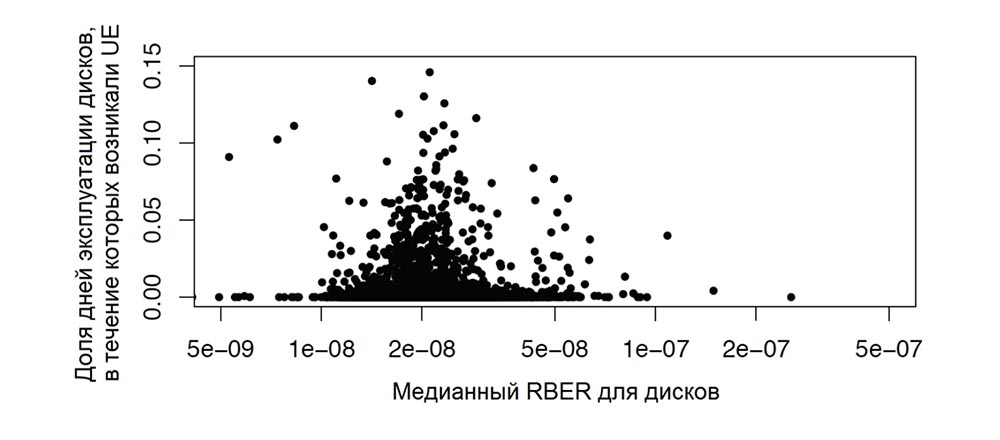
Fig. 5b. Correlation of median RBER with uncorrectable errors for different drives of the same model.
Recall that all models within the same generation use the same ECC mechanism, so the differences between the models do not depend on ECC differences. We did not see a correlation between RBER and UE incidents. We created the same graph for the 95th percentile RBER compared to the probability of UE and again did not see any correlation.
Next, we repeated the analysis when detailing individual disks, i.e., we tried to find out whether there exist disks where a higher RBER value corresponds to a higher UE frequency. As an example, Figure 5b shows the graphs of the median RBER value for each MLC-c model drive versus the number of UEs (the results are similar to those obtained for the 95th RBER percentile). Again, we did not see any correlation between RBER and UE.
Finally, we performed a more accurate time analysis to determine whether the months of operation of drives with a higher RBER would correspond to the months during which the UEs occurred. Figure 1 already indicated that the correlation coefficient between uncorrectable errors and RBER is very low. We also experimented with different ways of plotting the probability of UE as a function of RBER and did not find any signs of correlation.
Thus, we concluded that RBER is an unreliable indicator for predicting UEs. This may mean that the failure mechanisms leading to the RBER are different from the mechanisms leading to the occurrence of uncorrectable errors (for example, errors contained in separate cells versus larger problems arising with the whole device).
5.3. Fatal errors and wear.
Since wear is one of the main problems with flash memory, Figure 6 shows the daily likelihood of uncorrectable drive errors depending on PE cycles.
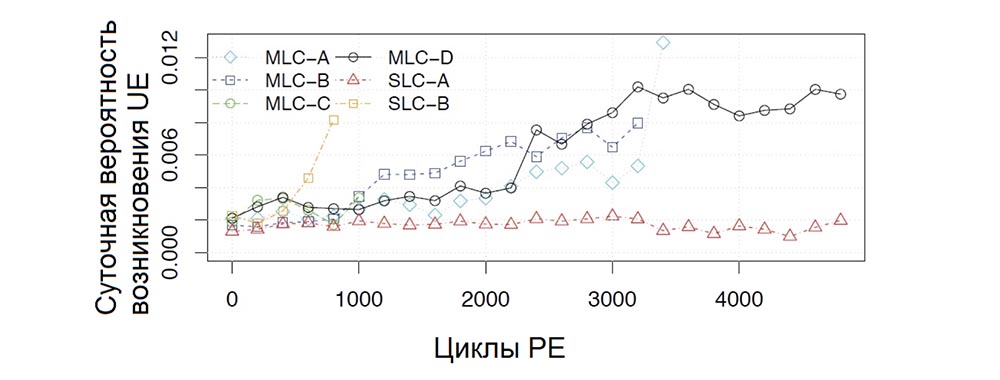
Figure 6. The daily probability of uncorrectable drive errors depending on PE cycles.
We note that the probability of UE continuously increases with age of the drive. However, as in the case of RBER, the increase is slower than usual: graphs show that UEs grow with PE cycles linearly, not exponentially.
The two conclusions we made for RBER are also applicable to the UE: firstly, there is no clear increase in the possibility of errors after reaching the limit of PE cycles, for example, in Figure 6 for the MLC-D model, whose PE cycle limit is 3000. In- secondly, the frequency of occurrence of errors varies among different models even within the same class. However, these differences are not as large as for RBER.
Finally, in support of our findings in Section 5.2, we found that, within the same class of models (MLC vs. SLC), the models with the lowest RBER values for a given number of PE cycles are not necessarily those that have the lowest probability of UE occurrence. For example, for 3000 PE cycles, MLC-D model drives had RBER values 4 times lower than MLC-B models, however, the probability of UE with the same number of PE cycles in MLC-D models was slightly higher than that of MLC-B models.
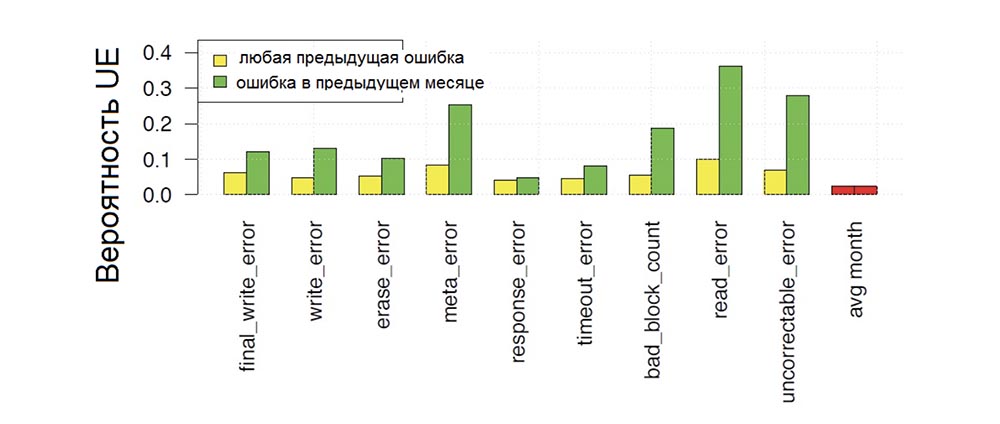
Figure 7. Monthly probability of occurrence of uncorrectable drive errors as a function of the dependence on the presence of previous errors of various types.
5.4. Fatal errors and workload.
For the same reasons that the workload can affect the RBER (see section 4.2.3), it can be expected that it will also affect the UE. For example, since we have observed that read violation errors affect RBER, read operations can also increase the likelihood of uncorrectable errors.
We conducted a detailed study of the impact of workload on UEs. However, as noted in section 5.1, we did not find the relationship between the UE and the number of read operations. We repeated the same analysis for the write and erase operations and again did not see any correlation.
Note that at first glance, here you can see a contradiction to our previous observation, according to which uncorrectable errors correlate with PE cycles. Consequently, a correlation with the number of write and erase operations could be expected.
However, in our analysis of the effects of PE cycles, we compared the number of uncorrectable errors for a given month with the total number of PE cycles that the drive has experienced throughout its entire life at the moment in order to measure the effect of wear. Studying the influence of the workload, we examined the months of operation of the drive during which the largest number of read / write / erase operations occurred in a certain month, which also had a higher chance of uncorrectable errors, i.e., did not take into account the total number of read / write operations / erasing.
As a result, we came to the conclusion that read violation errors, write violation errors, and incomplete erase errors are not the main factors in the development of uncorrectable errors.
Thank you for staying with us. Do you like our articles? Want to see more interesting materials? Support us by placing an order or recommending it to your friends, a 30% discount for Habr users on a unique analog entry-level server that we invented for you: The whole truth about VPS (KVM) E5-2650 v4 (6 Cores) 10GB DDR4 240GB SSD 1Gbps from $ 20 or how to divide the server? (options are available with RAID1 and RAID10, up to 24 cores and up to 40GB DDR4).
Dell R730xd 2 times cheaper? Only we have 2 x Intel TetraDeca-Core Xeon 2x E5-2697v3 2.6GHz 14C 64GB DDR4 4x960GB SSD 1Gbps 100 TV from $ 199 in the Netherlands! Dell R420 - 2x E5-2430 2.2Ghz 6C 128GB DDR3 2x960GB SSD 1Gbps 100TB - from $ 99! Read about How to Build Infrastructure Bldg. class c using Dell R730xd E5-2650 v4 servers costing 9,000 euros for a penny?