CAGR as a curse of specialists, or errors of prediction of exponential processes

Among the readers of this text, of course, there are many specialists. And, of course, everyone is well versed in their fields and well value the prospects of different technologies and their development. At the same time, history (which “teaches that it teaches nothing”) knows many examples when experts confidently made different forecasts and missed oooh very much:
- “The phone has too many shortcomings to be seriously considered as a means of communication. The device is of no value to us, ”wrote experts at Western Union , then the largest telegraph company in 1876.
- “Radio has no future. Aircraft heavier than air are impossible. Radiography will be a hoax, ” Lord Thompson lit William Kelvin in 1899, and you can, of course, joke that British scientists lit it back in the 19th century, but we will measure the temperature in Kelvin for a long time, and doubt that the esteemed lord was good physicist, no reason.
- “Who the hell wants to hear the actors talk?” Said Harry Warner , who founded Warner Brothers in 1927, one of the best movie experts of the time, about the sound movie.
- “There is no reason anyone needs a home computer,” Ken Olson , founder of Digital Equipment Corporation in 1977, shortly before home computers took off ...
- Nowadays, nothing has changed: “There is no chance that the iPhone will get a significant market share,” Microsoft CEO Steve Ballmer wrote in USA Today in April 2007 before the triumphal take-off of smartphones.
One could joyfully make fun of these predictions if your humble servant himself, for example, was not mistaken quite seriously in his field. And if I hadn’t seen how many, many experts are mistaken. In general, there is a classic "it never happened, and here it is again." And again. And again. Moreover, experts and specialists are doomed to errors in many cases. Especially when it comes to
Oh me this exhibitor
The first ambush of exponential processes is that even knowing how fast they grow in the mathematical sense (for the same time interval, their parameters change the same number of times), it is extremely difficult to imagine such a growth at the household level. A classic example: if we move one step forward, then we will walk 30 meters in 30 steps, but if each step will grow exponentially, then after 30 steps we will 26 times (“Twenty-six times, Karl !!!”) go around the globe at the equator:
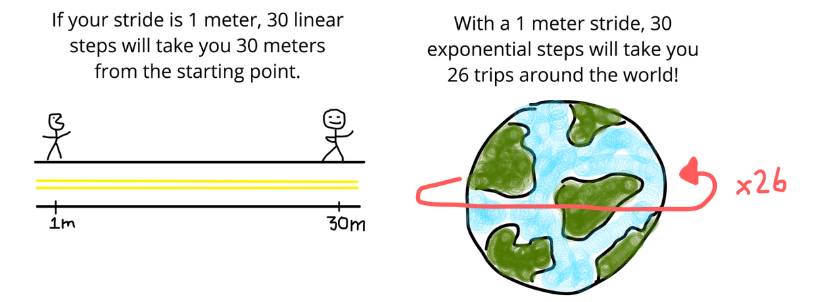
Source: How to Think Exponentially and Better Predict the Future
Question for programmers: what constant do we raise to a power in this case?
Answer
The constant is 2, i.e. doubling at every step.
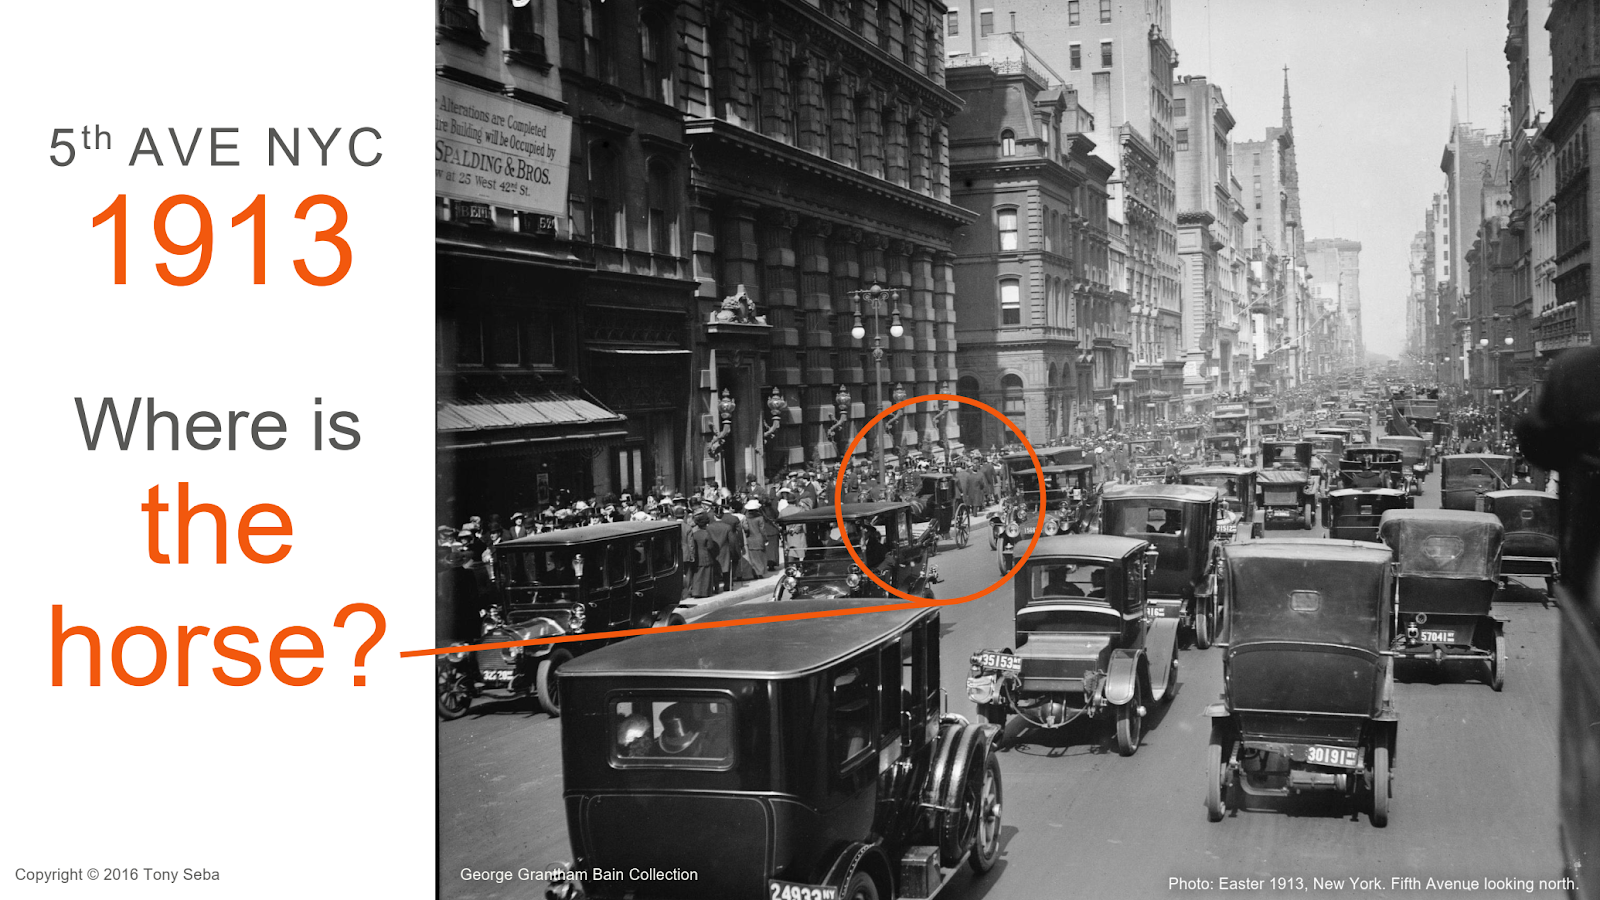
When the process grows exponentially, it leads to rapid mass changes that are clearly visible to the naked eye. A great example is Tony Ceba . In 1900, on Fifth Avenue in New York, one could hardly see a lone car among horse-drawn carts:

And only 13 years later, on the same street, you can hardly see a lone horse-drawn cart among cars:
We see a similar picture, for example, with smartphones. The story of Nokia, which saddled one wave and was a long leader by a wide margin, but could not fit into the next wave and almost instantly lost the market (see great animation with market leaders over the years), is very instructive.
All computer experts know Moore's law , which was formulated actually for transistors and has been true for 40 years. Some comrades generalize it for electronic lamps and mechanical devices and claim that it has been operating for 120 years. It is convenient to represent exponential processes with a logarithmic scale, at which they become (almost) linear and it is clear that such a generalization has the right to exist:
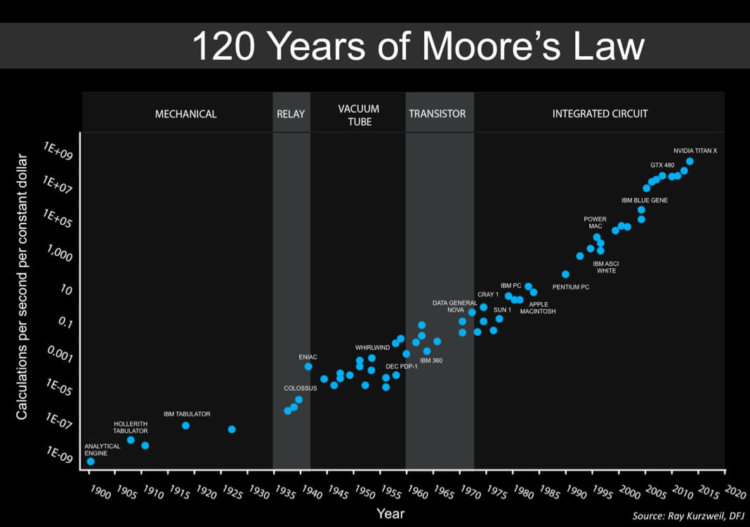
Source: This and the next two graphics from Moore's Law over 120 Years
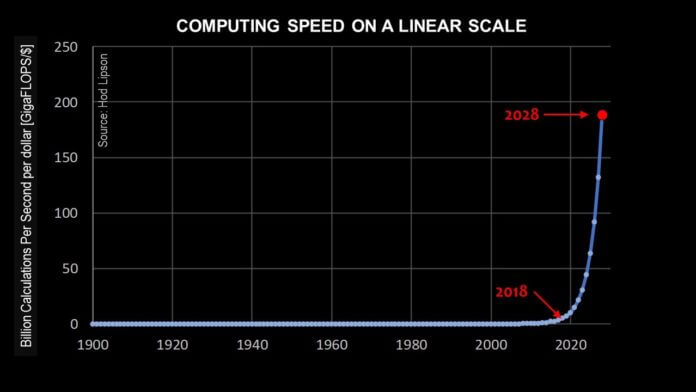
On a linear scale, growth looks something like this:

And here we are gradually approaching the second ambush of exponential processes. If the growth was 120 years old, does this mean that for at least 10 years our exhibitor will be preserved?
In practice, it turns out that no. In its pure form, the growth rate of computing has been slowing for several years, which allows us to talk about the "death of Moore's law":

Source: As Moore's Law ends, hardware acceleration takes center stage
Moreover, it is interesting that this curve can not only straighten, but also go up with a new force. Your humble servant described in detail how this could happen . Yes, there will be other calculations (inaccurate neural networks), but in the end, if inaccurate scores and mechanical calculators have expanded the scale to 120 years, then neuroaccelerators are quite appropriate there. However, we were distracted.
It is important to understand that exponential growth may cease for technical, physical, economic, and social reasons (the list is not complete). And this is the second major ambush of exponential processes - it is correct to predict the moment when the curve begins to leave the exponent. Errors in both directions here are very frequent.
Total:
- The first ambush of exponential growth - the indicator is growing unexpectedly quickly, even for specialists. And underestimating the exhibitor is a traditional mistake repeated over and over again. As the real harsh professionals said 100 years ago: “Tanks, gentlemen, this is fashion, and cavalry is eternal!”
- The second ambush of exponential growth is that at some point (sometimes after 40 or 120 years) it ends, and it is also difficult to accurately predict the time of completion. And even Moore’s law, on whose deathbed many technical journalists left traces of their hooves, can return to duty with renewed vigor . And it will not seem a little!
Exponential processes and market capture
If we talk about visible changes around us and the market, it is interesting to see how different technologies have conquered the market. This is most conveniently done using the example of the USA, where for more than 100 years different types of market statistics have been conducted relatively accurately:
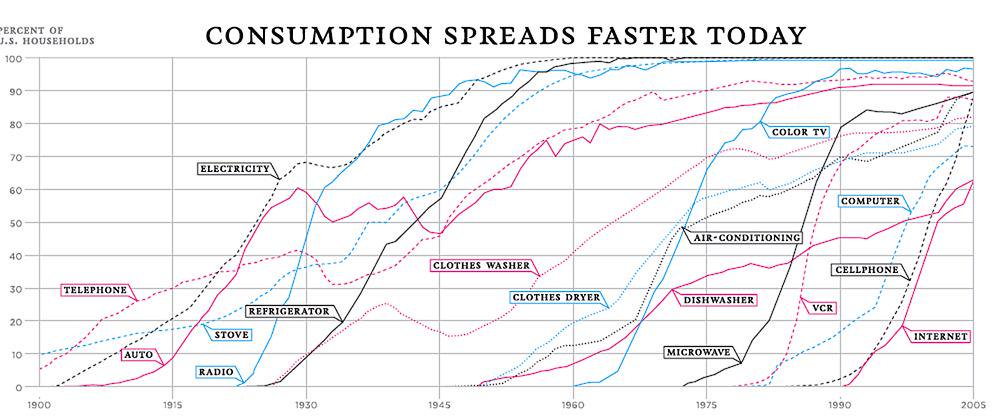
Source: You Are What You Spend
It is very interesting and instructive to watch how the proportion of houses with wired telephones grew smoothly, and then plummeted by a quarter during the years of the Great Depression . The share of houses with electricity also grew, but dipped significantly weaker: people were not ready to refuse electricity, even when there was not enough money. And the spread of home radio almost did not feel the big economic crisis, the latest news was interesting to everyone. And the use of the radio, unlike the telephone, electricity or car, the radio does not. By the way, the take-off of private cars, which was interrupted by the Great Depression, recovered only after 20 years, wired phones recovered after 10 years, and the electrification of houses after 5.
It can be clearly seen that the spread of air conditioners, microwaves, computers and smartphones was much faster than new technologies reached before. From a share of 10% to 70%, growth often took place in just 10 years. The technologies of the beginning of the century often required more than 40 years for the same growth. Feel the difference!
From funny personally for the author. Evaluate how washing machines and clothes dryers have been growing quite synchronously since the 60s. It's funny that in our country the latter are almost unknown. And if in the USA from some point they were usually bought as a pair, then our guests very often ask the question: “Why do you need two washers?”. We have to seriously answer that the second is in reserve, in case the first breaks.
Also pay attention to the drop in the share of washing machines. At that moment, public laundry facilities were very widespread, where you could come, load laundry into the car, wash and leave. Cheaply. Similar items are now very common in the United States. This is an example of a situation where the business model of a specific market changes the share of technology penetration and sales structure (expensive professional machines with anti-vandal performance are better sold).
The acceleration of processes is especially noticeable in recent years, when the massive penetration of technology has become “instantaneous” by the standards of the early 20th century (over 5-7 years):
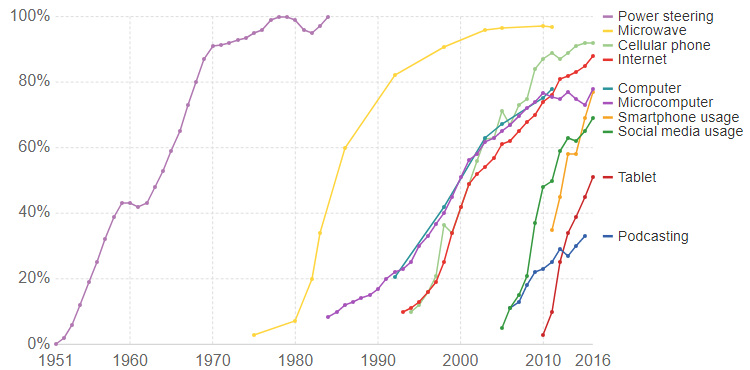
Source: The Rising Speed of Technological Adoption (interactive link chart!)
At the same time, the rapid rise of one technology is often the fall of another. Radio take-off meant pressure on the newspaper market, microwave take-off reduced demand for gas ovens, etc. Sometimes the competition was more direct, for example, the take-off of cassette recorders drastically reduced the demand for vinyl records, and the take-off of the CD - the demand for cassettes. And the
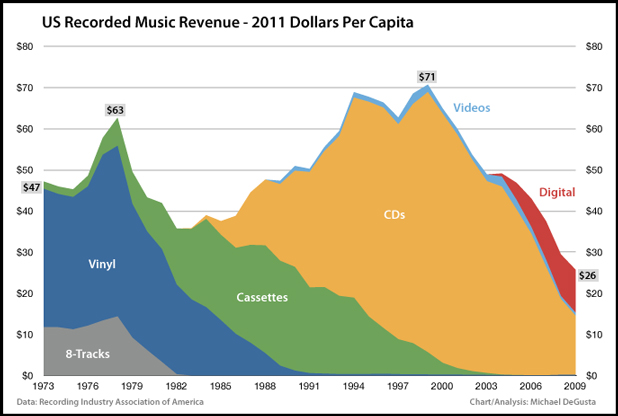
Source: The REAL Death Of The Music Industry
Similarly, the number of photographs taken is growing exponentially, moreover, recently, with the transition to digital, the growth rate has grown significantly. Therefore, the "death" of analog photos was, by historical standards, "instant":

Source: https://habr.com/ru/news/t/455864/#comment_20274554
The dramatic story of Kodak , which, ironically, invented a digital camera and missed the exponential take-off of digital photography, is extremely instructive. But the main thing that history teaches is that it does not teach anything. Therefore, the situation will be repeated again and again. If you believe the statistics - with acceleration.
Total:
- You can greatly benefit from forecasting by studying the acceleration and deceleration of market growth over the past 100 years.
- The speed of innovation is increasing on average, which means that the number of false forecasts will increase. Be careful…
Let's move on to practice
Of course, you think that all this is quite simple, understandable, and, in general, it is not too difficult to take all this into account in forecasts. It's you for nothing ... Now the fun begins ... Fastened?
Recently, Igor Sechin, executive director of Rosneft, spoke at the St. Petersburg International Economic Forum, where, in particular, he said: “ As a result, the contribution of alternative energy to the global energy balance will remain relatively small: by 2040 it will increase from the current 12 to 16% .” Does anyone doubt that Sechin is a specialist in his field? I think no.
At the same time, in recent years the share of alternative energy has grown by about 1% per year, and the share growth accelerated:
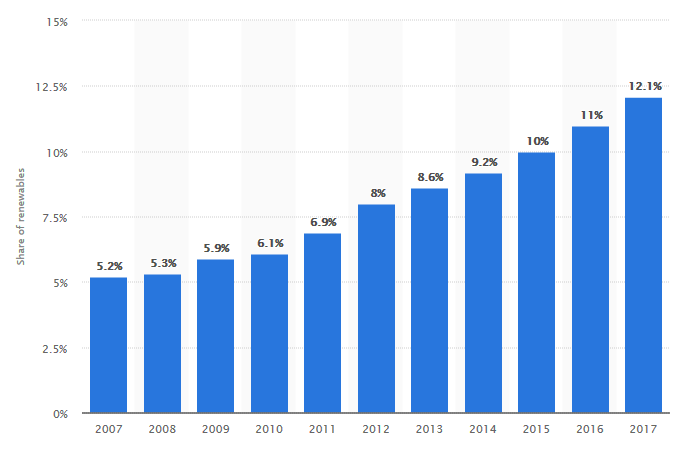
Source: Statista: Share of renewable power in energy generation globally (this method of calculation was chosen - without large hydropower, since it gives the current 12%).
And then - the task for the 3rd grade. There is a value that in 2017 was 12% and is growing by 1% per year. In which year will it reach 16%? In 2040? You thought well, my young friend? Note that, responding “in 2021”, we make a classic mistake by making a linear prediction. It is more reasonable to take into account the exponential nature of the process and make the classic three predictions:
- “Optimistic” given the accelerated development,
- “Average” - based on the fact that the growth rate will be like that of the best year in the last 5 years
- and “pessimistic” - based on the fact that the growth rate will be, on average, like the worst year in the last 5 years.
Moreover, even according to the average forecast, 16.1% will be achieved as early as 2020, i.e. next year:
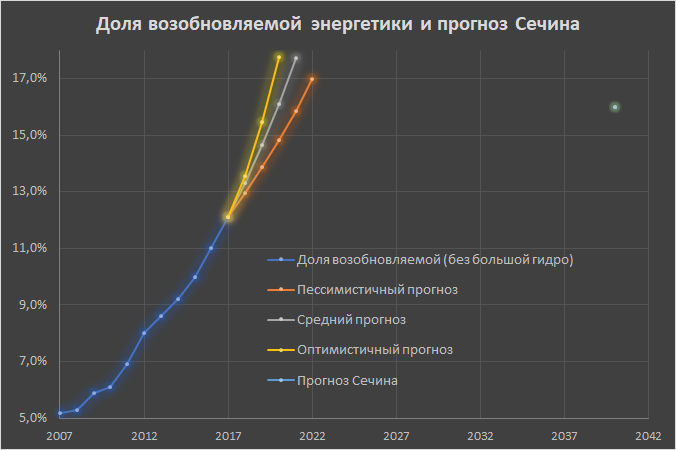
Source: author’s calculations
For a better understanding (exponential processes) we give the same graphs in a logarithmic scale:
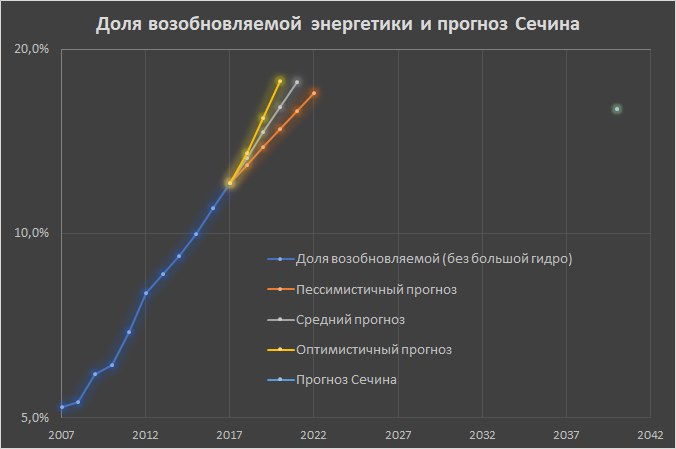
It can be seen from them that the average scenario is quite a trend, even if you look from 2007. In total, the value predicted for 2040 will most likely be achieved next year, a maximum in a year.
In fairness, not one Sechin is so "mistaken." For example, BP (British Petroleum) oil industry workers make an annual forecast, and they are already trolling that they have made forecasts over the years and again do not take into account the exponentiality of the process (“Derivative? No, not heard!”). Therefore, every year for many years they have to raise their forecast:
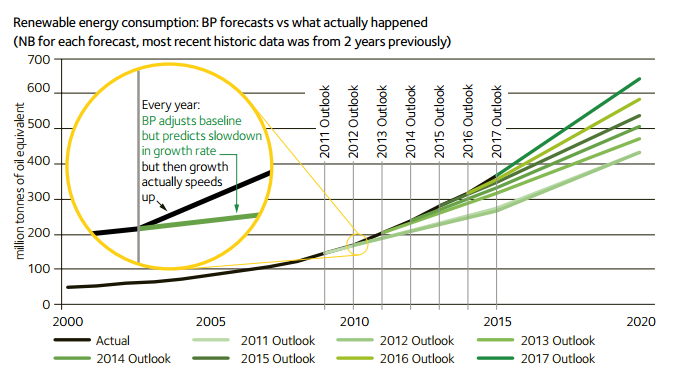
Source: Forecasting Failure / Why investors should treat oil company energy forecasts with caution
Closer to Sechin, the forecasts of the International Energy Agency (parties with a large weight of oil workers, rate the pipes at the root of the Russian section of the site). In principle, they do not take into account the exponentiality of the process, which leads to an order of magnitude error for 7 years, and they repeat this error systematically:
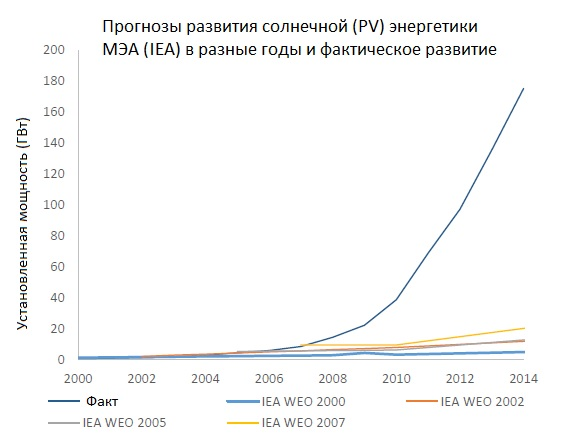
Source: Our forecasts did not come true and unreliable promises (the renen.ru site itself , by the way, is very good)
Their forecasts with more recent data look especially funny (you also read “when will they stop, finally !!!” in their curves?):
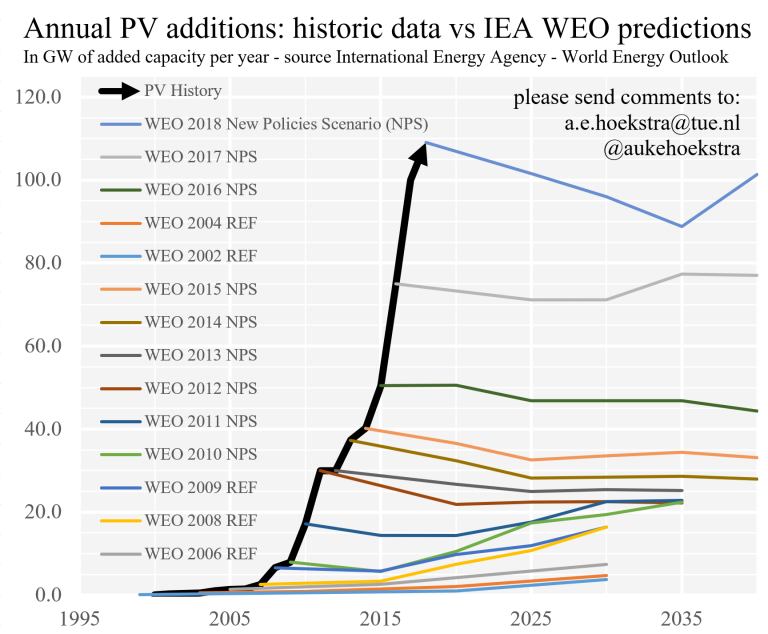
Source: Photovoltaic growth: reality versus projections of the International Energy Agency
This is, indeed, counterintuitive, but when predicting many processes, it is more efficient to take into account not a linear forecast for the previous period and not a linear forecast based on the current derivative, but a change in the speed of the process. This gives the most accurate result for such processes:
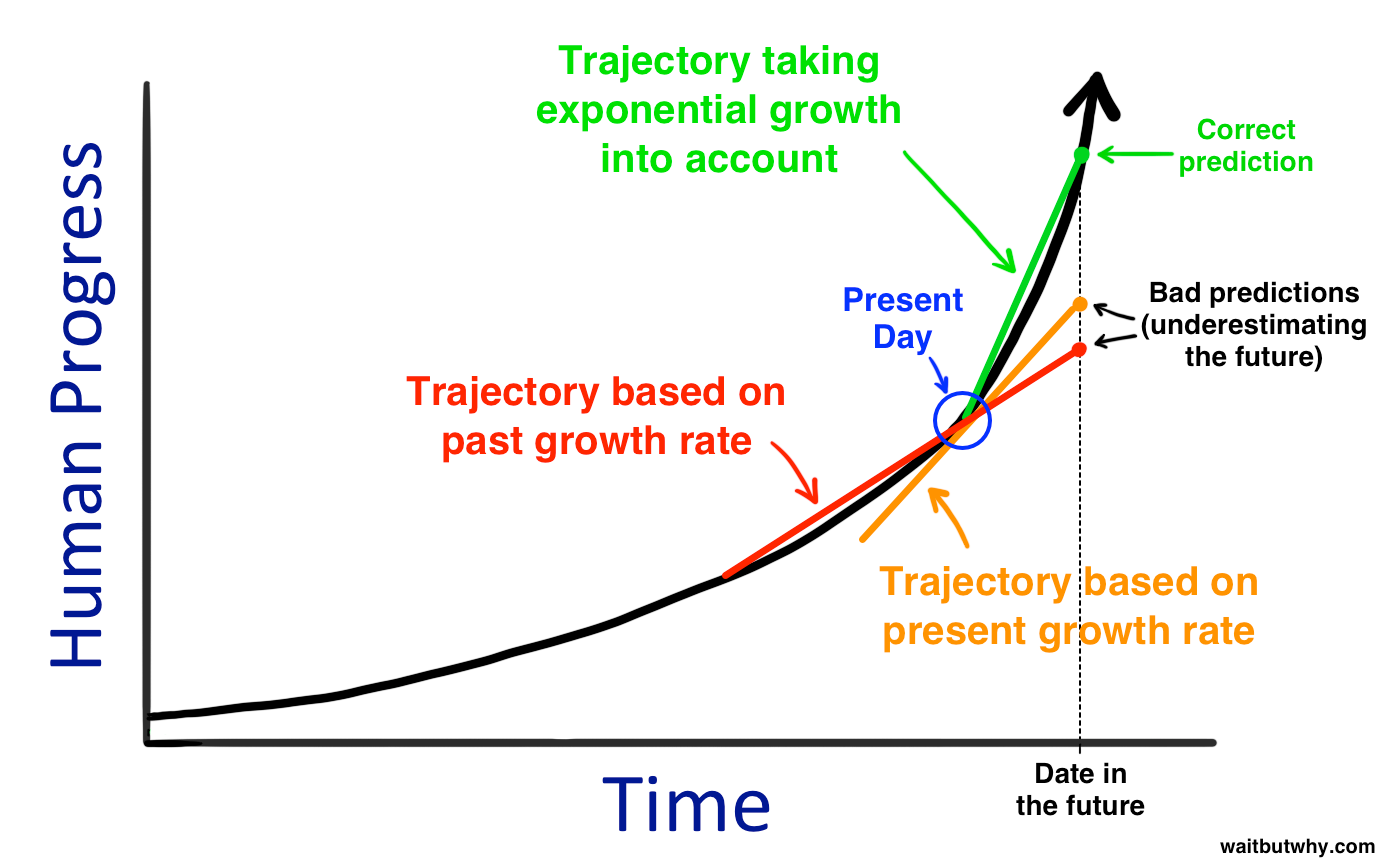
Source: The AI Revolution: The Road to Superintelligence
In English-language literature, especially in business analytics, the acronym CAGR is constantly used ( Compound Annual Growth Rate - a link is given to the English-language wiki, and it is typical that there is no corresponding article in the Russian-language Wikipedia). CAGR can be translated as "the aggregate average annual growth rate." It is considered by the formula
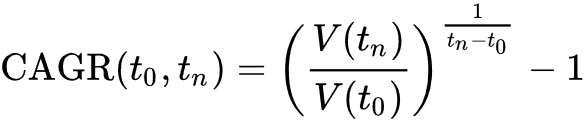
where t 0 is the initial year, t n is the final year, and V (t) is the value of the parameter, presumably changing exponentially. The value is expressed as a percentage and means how many percent per year a certain value grows (usually a market).
There are a lot of examples on the net how to count CAGR, for example, in Google and Excel:
- How To Add the CAGR Formula to Google Sheets Spreadsheets
- CAGR Formula in Excel (suitable Russian text CAGR: what is this indicator and how to calculate it )
We will conduct a short master class under the motto "we will help Sechin", taking the data of the oil BP (as an estimate from below). Who cares , the data itself is in this guglodok , you can copy it to yourself and count it differently. Globally renewable generation is growing rapidly:
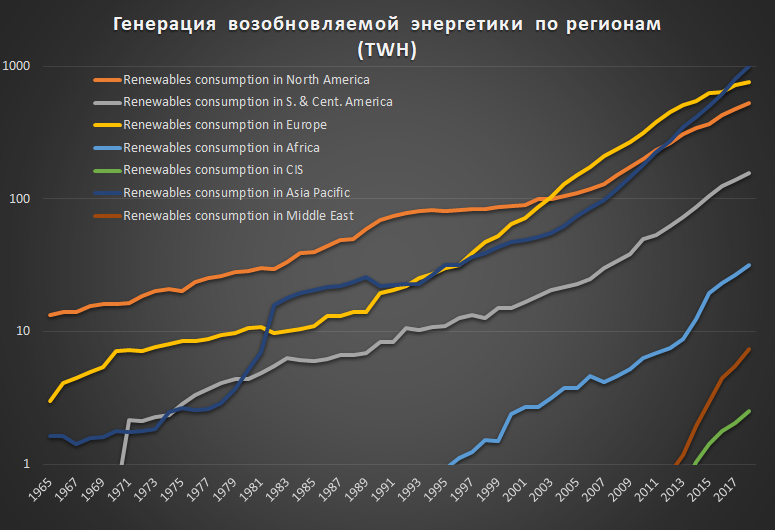
Source: Hereinafter on black charts, the author’s calculations according to BP
The scale is logarithmic, and it is clear that for all regions the growth is exponential (this is important!), For many with the acceleration of the exponent. The leaders are expected - China with its neighbors, overtaking North America and Europe. Interestingly, the penultimate - the Middle East - is one of the most oil regions of the planet, and it has the highest CAGR among all (44% over the past 5 years (!)). It is not surprising to see growth by an order of magnitude over 6 years, and judging by the statements of their officials, they are going to continue in the same vein. The former Saudi Arabian oil minister wisely warned his OPEC colleagues back in 2000: “The Stone Age did not end because the stones ran out,” and it seems that they took this wise thought 10 years ago. CIS (CIS), as we see, in last place. The growth rate, however, is not bad.
CAGR can be considered in many ways. For example, we’ll build a CAGR for every year since 1965, over the last 5 years and over the past 10 years. The result is such a curious picture (total in the world):

It is clearly seen that, on average, exponential growth accelerated, and then slowed down. “Moskovsky Komsomolets” and other yellow media in this case usually write something like “The Chinese economy is falling”, meaning “the fantastic growth rates of the Chinese economy are slowing down” and tactfully keeping silent that they are slowing down to such a pace, which only remains for others dream. Everything is very similar here.
Let's try to predict production in 2018 according to the data until 2010, taking CAGR'1965, CAGR'10Y, CAGR'5Y and a linear forecast from 2010 relative to 2009 and relative to 2006. The following picture will be obtained:
| Linear'1Y
| Linear'4Y
| CAGR'1965
| CAGR'10Y
| CAGR'5Y
| |
| Renewable production in 2018, forecast up to 2010
| 1697
| 1442
| 1465
| 2035
| 2429
|
| Attitude to the real in 2018
| 0.68
| 0.58
| 0.59
| 0.82
| 0.98
|
| Forecast error
| 32%
| 42%
| 41%
| eighteen%
| 2%
|
Characteristic moments - none of the forecasts turned out to be too optimistic, i.e. everywhere undershot. In the most optimistic scenario with CAGR 15.7%, the underperformance was 2%. Linear forecasts gave an error of 30-40% (the period was specially taken when, due to a slowdown in growth rates, their error is less). Unfortunately, it was not possible to add Sechin's model, since it is not possible to restore his formula.
As a homework, try retrospective forecasts by playing with different CAGRs. The conclusion will be obvious: it is better to predict exponential processes with exponential models.
And as a cherry on the cake, we present the forecast from the same BP, for which (“Caution, experts work!”) The exhibitor is replaced by a linear growth in the forecast:

Source: Renewables share of power generation by source (from BP)
Please note that they generally do not consider hydropower, which is a classic renewable energy source. Therefore, their assessment is even more conservative than that of Sechin, and they give 12% only for 2020. But even if the base is underestimated and the exponential growth stops in 2020, they get a 29% share in 2040. Doesn’t look like 16% Sechin ... Some kind of trouble ...
It’s clear that Sechin is an intelligent person. I am a specialist in applied mathematics, not a power engineer, so I can’t expertly answer the question about the reason for such a serious forecast error for Sechin. Most likely the fact is that this situation really smells like a drop in oil prices. And our large oil ship (who did not listen to this song by Semyon Slepakov, look) for a not very clear reason, has a stable rate for selling crude oil abroad, and not oil products. And if you strongly distort the forecast, then this eliminates (for a while, one must think) from unpleasant questions. But as a mathematician, I would prefer to see a systematic error at least at the level of those who did not hear about the derivatives of the masters from BP. I care, because I'm on the same ship.
Total:
- As all officers know, in wartime, the value of the constant π (the ratio of the circumference of a circle to its diameter) reaches 4, and in special cases even up to 5. Therefore, when it is very necessary, the forecast of specialists demonstrates ANY values necessary for the authorities. It is advisable to remember this.
- Exponential processes are best predicted using an aggregate annual average growth rate, or CAGR.
- Sechin’s forecast at the St. Petersburg International Economic Forum can be assessed as an extreme degree of disrespect for the audience or as rude manipulation. To choose from. Let's hope that there are
courageouspeople who ask the same unpleasant questions. For example, why is petrochemicals all over the world very profitable, and Russian state-owned companies invest tens of billions in the “pipe” and export of raw materials, and not in it?
- And finally, I want to hope that one of the readers will make a page about CAGR on the Russian Wikipedia. It’s time, it seems to me.
Solar power
We fix the topic of exponential processes. The latest BP chart shows how the share of the “sun” jumped sharply in 2020, and even a conservative BP believes in its future. Interestingly, an exponential process is also observed there, which, like Moore’s law, has been going on for more than 40 years and is called the Svenson Law:
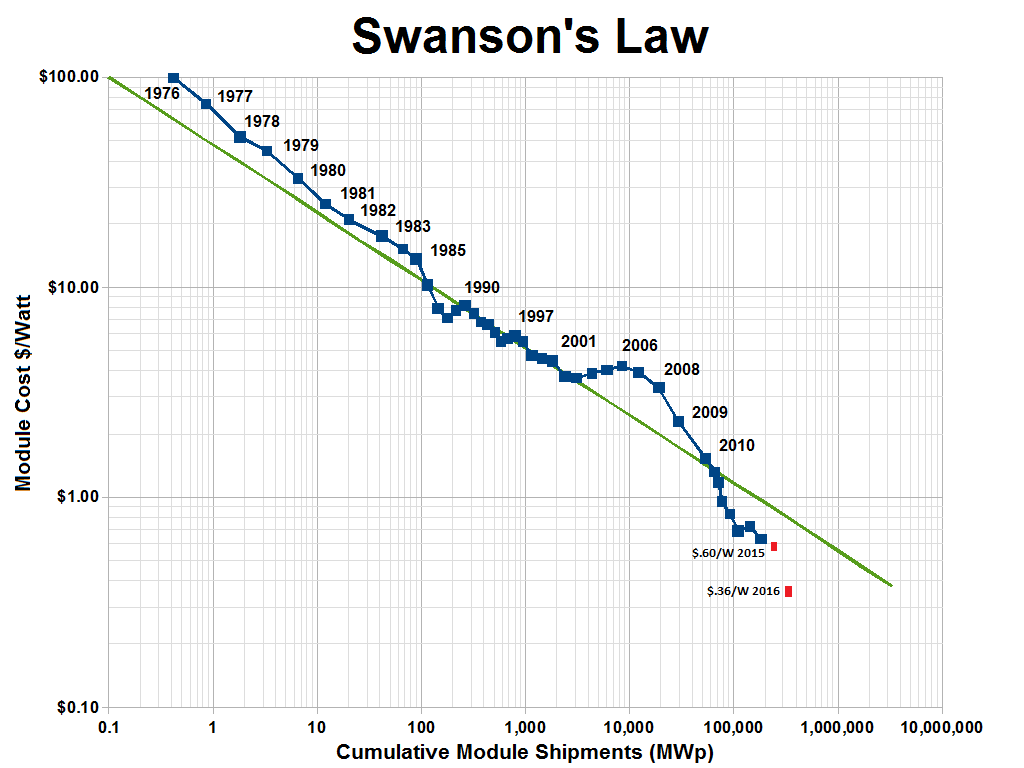
Source: https://en.wikipedia.org/wiki/Swanson's_law
The general meaning is simple - the module price drops exponentially and production exponentially grows. As a result, if 40 years ago it was a technology with a cosmic (in all senses) cost of electricity, and it was suitable mainly for powering satellites, then today the cost per watt has fallen by about 400 times and continues to fall (soon by 3 orders). The average CAGR at a cost of about 16% with an increase of up to 25% in the last 10 years, which is rare.
As a result, this also causes an exponential increase in installed capacity and generation:

Source: https://en.wikipedia.org/wiki/Growth_of_photovoltaics
10 times growth in 7–8 years is very serious (calculate yourself CAGR, get 33–38% (!)). Laughter, laughter, but if you do not stop it, then only solar energy will generate 100% of the world's electricity needs in 12 years. This must be resolutely fought. In order to somehow slow down this disgrace in the USA, Trump introduced a huge (for other markets) 30% duty on the import of solar panels last year. But the damned Chinese by the end of the year reduced prices by 34% (per year!), Not only zeroing the effect of duties, but also making a profitable purchase again. And they continue to build fully robotic factories with dozens of gigawatts of batteries per year, again and again lowering prices and increasing production volumes. Some kind of nightmare, agree.
The drop in the cost of batteries is such that in recent years they have not only become competitive without subsidies, but the border of their cost-effective use is rapidly moving north in the northern hemisphere, covering up to hundreds of kilometers a year. Moreover - yesterday it was important to direct the batteries at an optimal angle and all that. 3-4 years pass, and for the same price a large area of batteries can be installed simply on the vertical southern facades. Yes, they are less effective, but they need to be washed less often and easier to install. And at the same installation price, lowering the cost of ownership is more important.
Again - the Achilles heel of solar energy - uneven production of electricity, especially in conditions where the storage efficiency is far from 100%. And then it turns out that at such a rate of decline in the cost of production of one megawatt, not only low and medium storage efficiency (i.e., can be stored in a less efficient, but cheaper way), but also the cost of installing batteries (i.e. for those same money, we can install not only so much megawatts of generation, but still so much megawatts of storage "for free", which fundamentally changes the alignment).
Total:
- Svenson’s law is about the same as Moore’s law of validity, although CAGR is smaller. But exactly in the next decade, its effect will be most noticeable.
- , «» «» 3 - . , Tesla PowerPack , . . , Li-Ion . , , CAGR ( , ).
Serious specialists wrote back in 1909 in the highly respected journal Scientific American: “The fact that the car has almost reached the limit of its development is confirmed by the fact that over the past year there have been no radical improvements.” Last year, no radical improvements in electric vehicles were also observed. This gives reason to confidently assert that the electric car has clearly reached its peak of development.
Seriously speaking, in most technologies there is the problem of “chicken and eggs”. Until mass reach a certain value, it is extremely expensive to introduce a number of innovations, and, on the contrary, until they are introduced, sales are hindered. Those.To overcome "childhood diseases" a certain mass production is needed. And here it is convenient to evaluate innovative technologies by the level of aggregate production per capita:

Source: Electric cars and “peak oil”. The truth in the model
I am not a specialist and I do not know how electric cars will change in the next 15 years. But this is definitely a very high-tech product, and they are changing rapidly. And the level of current electric vehicles is the level of cars with internal combustion engines in 1910 and the level of mobile phones in 1983. Changes for the better (for the consumer) in the next 15 years will be dramatic. And then the most interesting thing will begin.
In general, electric vehicles are pushing forward three factors:
- — , , , . ( Lamborghini , Tesla 3 Ferrari , , )
?
- , . ( @sith ) , , , , 600 , $4 ( ). , , ,
- , — . . , , , …
And, of course, the fact that a car can, in principle, be charged anywhere where there is a power outlet is a revolution. That is, if electricity reached the grandmother in the village, you can come to her and recharge, even if longer. Of course, driving a country trophy will not work, but 99. (9)% of people come to the village, and then the car still costs. And tomorrow it will not just stand, but consume electricity at a cheap village tariff.
Of course, while there are few charges, especially fast ones, but ... let's look at the graph:

Source: E-Car Charging Infrastructure Becoming Mainstream
What?Again exponential process? And which! The question is: how will the situation change if in the next 10 years the number of gas stations increases by 1000 times ("A thousand, Karl!")? (This is CAGR = 100%, i.e. doubling annually) Sorry, I was wrong. In the next 8 years1000 times! (This is CAGR = 137%, i.e. faster than annual doubling). And two years of these 8 have almost passed ... And people from the industry say that over the next 8 years, growth will not be 3 orders of magnitude, but faster, especially with new generation forks. To understand how it will look, you need to come to China. Actually, electrical outlets are on most sites and grow like mushrooms after rain in warm weather. And for a week even residents of high-rise buildings will refuel on a Sunday trip to the cinema or shopping center (where the car still stands and waits for you for a couple of hours). And shopping centers with restaurants will fight for the visitor on an electric car (they are already fighting in China).
Yes, the price of electric cars is too big now. But the battery gives a large share there, and its cost falls like this:
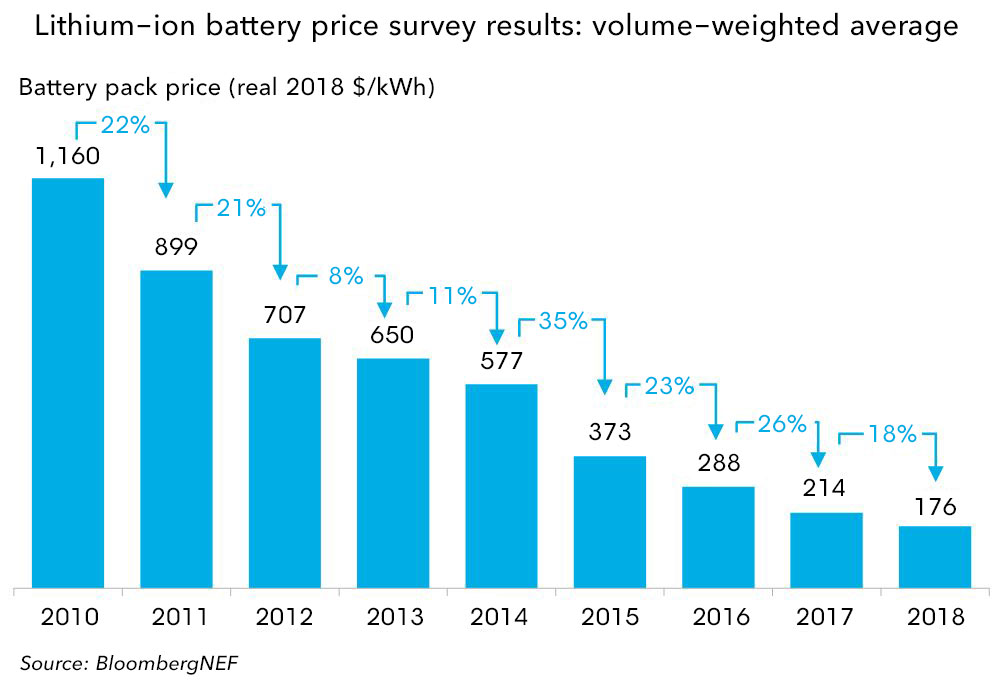
Source: A Behind the Scenes Take on Lithium-ion Battery Prices
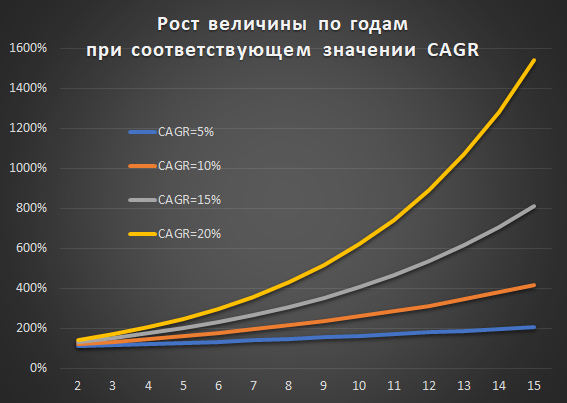
Yes they conspired! This is again an exponential process! And the average CAGR is -20.8%, which, as we know, is VERY much. If 5% is 2 times in 15 years, but 20% is 10 times in 12 years ("Ten times, Karl!"):
It's funny that at this rate in 3-4 years you can replace your battery with one battery in your car will be at the same price to buy two. Hang the second one in the garage, and it will provide you with a personal supercharger. Come home and refuel. And at a night rate. And the whole house will be fed at a nightly rate. And power outages in the cottage village will cease to worry. And (remembering the CAGR "sun") - it will be possible to put solar panels on the roof. There are good savings there, so the mass of people will say: “Class! I take it!Wrap it up! ”(Mainly in Europe and the USA , of course).
The amazing thing is, these are exponential processes. In the next 10 years we will definitely see serious progress in the field of electric vehicles and modern electric cars will be perceived as terribly uncomfortable and miserable. There is no power reserve, no autopilot, you need to carry a bunch of adapters ... Early models, in short.
Total:
- In China, 66% more electric vehicles were sold in the first half of 2019 than in the first half of 2018 . During the same time, sales of cars with internal combustion engines fell by 12%. This is not a bell, this is a gong.
- The most popular among electric cars, of course, is Tesla. But I would draw your attention to Chinese BYD . She seems to be the most promising .
- . , «» , . . , .
IT?
Moore's Law became well known because it lasted with a huge CAGR of about 41% for almost 40 years. What other examples of good CAGR are there in IT? There are many of them, for example, Google’s CAGR revenue growth of 43% over 16 years:
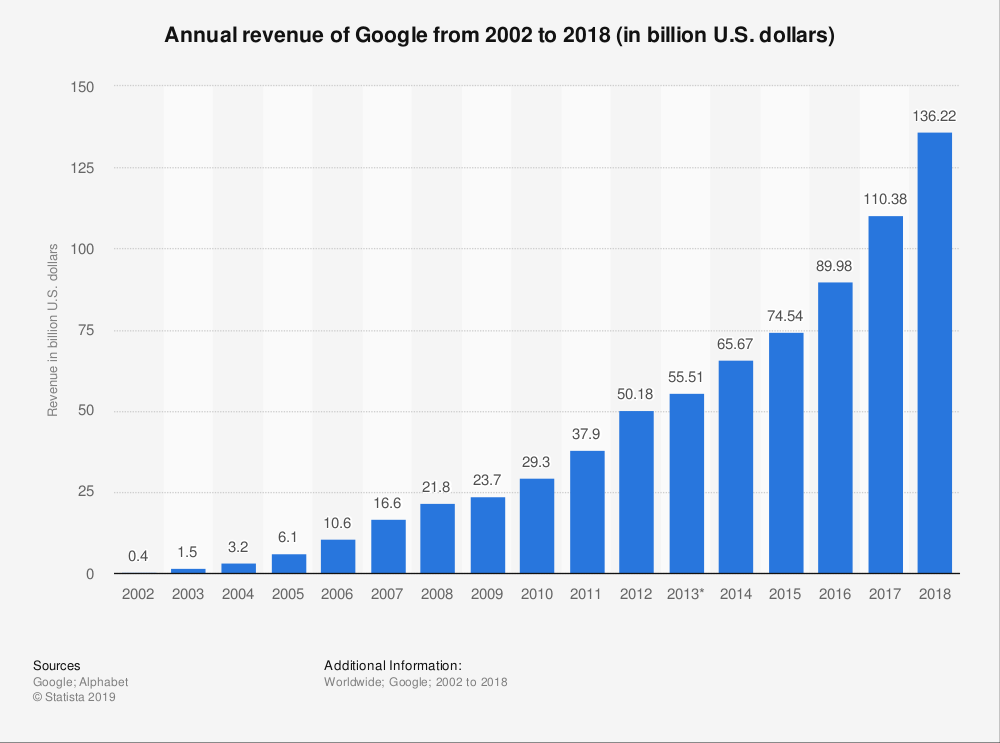
Source: Google's ad revenue from 2001 to 2018 (in billion US dollars)
Looking at this graph, part of the people (especially whose applications were banned from the Google Play Store) felt uncomfortable. There is something to think about. Last week, when driving a car, the smartphone began to aggressively offer to switch to Google navigation, despite the fact that I was already traveling with Yandex.Navigator. Probably, they no longer have enough market size, but they need to raise incomes, I thought. And also thought.
However, there are more optimistic purely technical graphs, for example, the logarithmic reduction in the price of disk space and the increase in the speed of Internet connections by 2019:
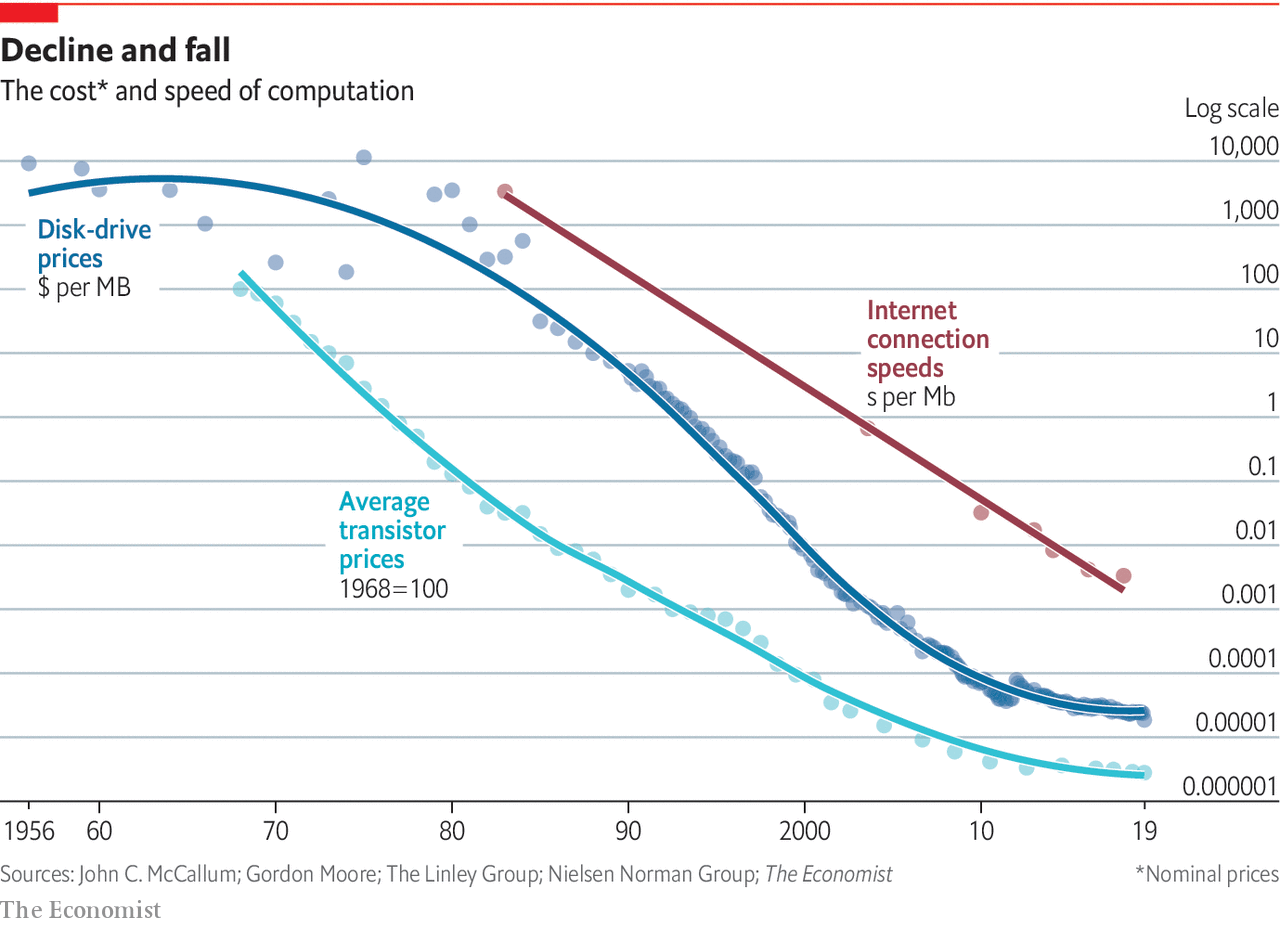
Source: Drastic Falls in Cost Are Powering Another Computer Revolution
It is easy to see that there is a tendency to reach a plateau, i.e. growth rate is reduced. Nevertheless, they grew well for decades. If you look at the hard drives in more detail, you can see that the next technology usually provides the next return to the exhibitor:

Source: Storage Technologies for Today and Tomorrow
So we are waiting for the SSD to catch up with the HDD and leave them far behind.
Also, with a magnificent CAGR, the pixel value of digital cameras fell in time at 59% (Handy's Law):
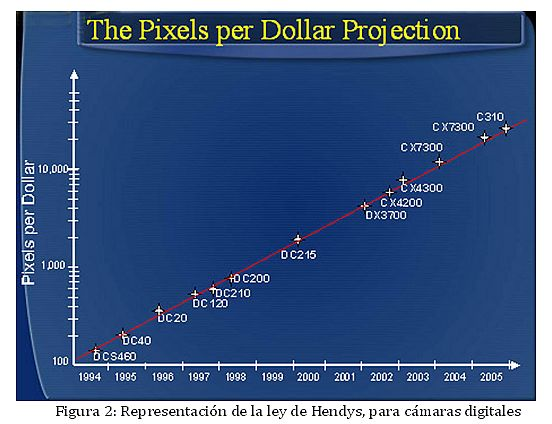
Source: Hendy's Law
In the last 10 years, the pixel size of the camera has also decreased exponentially.
Also, with a good CAGR of about 25% (10 times in 10 years), the pixel value of a conventional display has been falling for about 40 years, while the brightness and contrast of the pixels are also increasing (i.e., higher quality is offered at a lower price). By and large, manufacturers no longer know where to put the pixels. 8K TVs are already quite affordable, but what to show on them is a good question. Autostereoscopy could absorb any number of pixels, but there are unresolved issues. However, this is a different story. In any case, the enchanting decrease in the cost of a pixel brings autostereoscopy closer.
In addition, the exponential distribution of many software services:
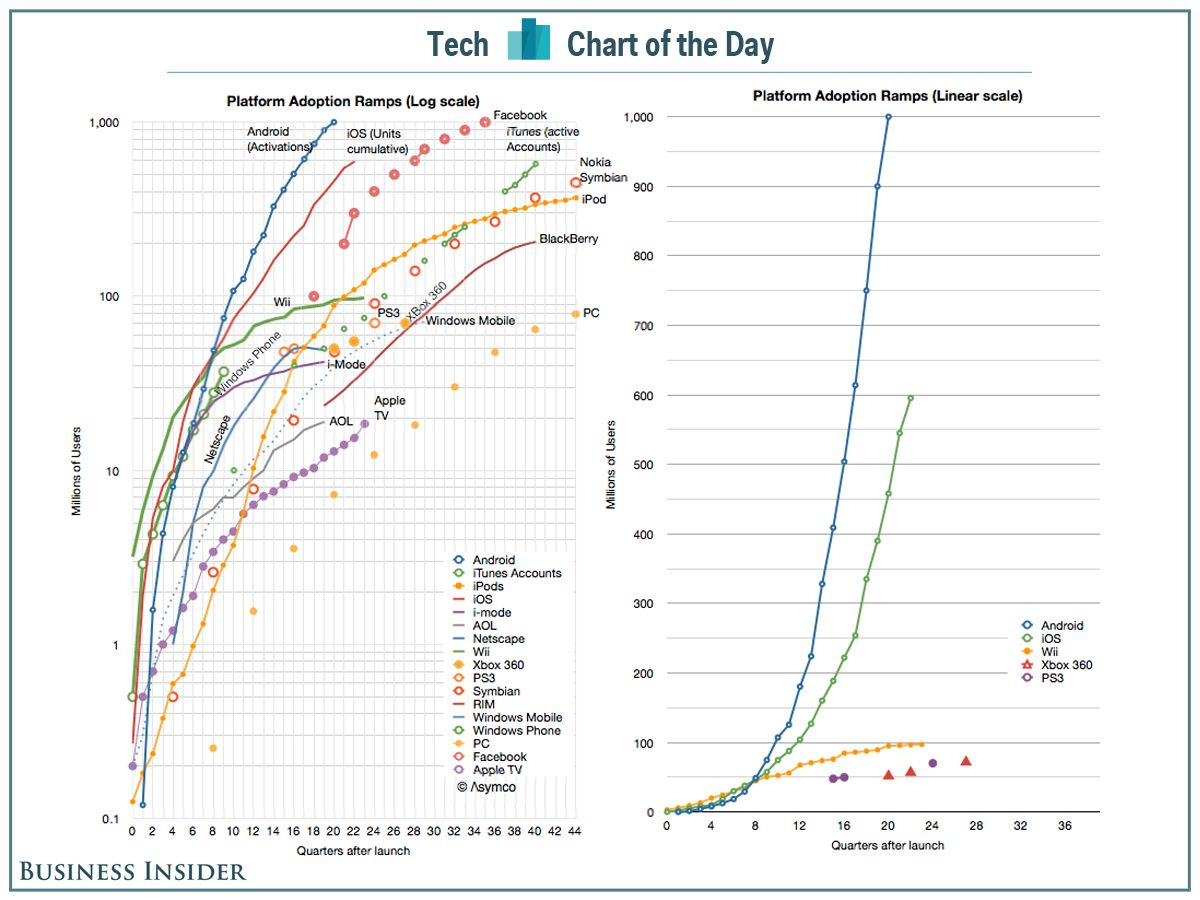
Source: Technology Platforms With A Billion Users
For example, AppleTV or Facebook. And, as mentioned above, thanks to social networks, in particular, the speed of dissemination of innovations is increasing.
Total:
- Largely due to exponential processes over the past 20 years, IT companies have greatly outpaced others on the list of the largest companies in the world. And they are not going to stop (whatever that means).
- Improvements in most technologies in IT are exponential. And the classic is S-shaped curves, when in one and the same area one technology replaces another, each time causing another return to the exponent.
Neural networks
Recently, neural networks have been extremely popular. Let's look at the number of patents on them in recent years:
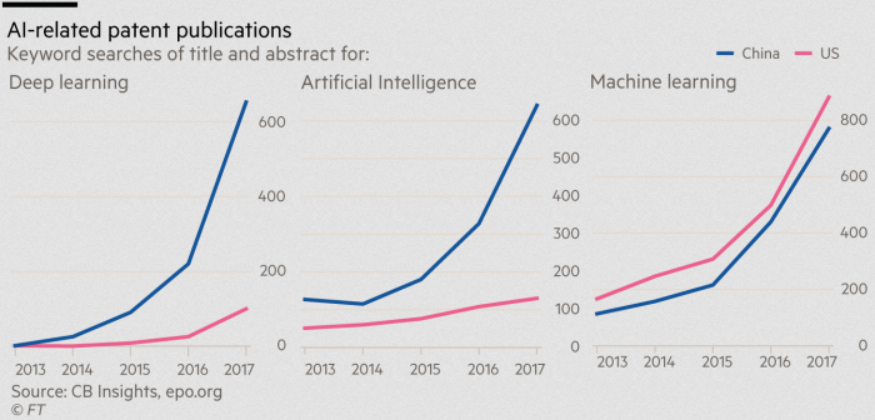
Damn ... Again, it looks like an exponent (although the term is not enough). However, if we look at startups for a longer period, this is approximately the same picture (14 times in 15 years - this is a CAGR of 19% - very good):

Source: AI index, November 2017 (yes, yes, I know what's there in the next 3 years)
At the same time, neural networks in many areas together demonstrate a better result than the average person:
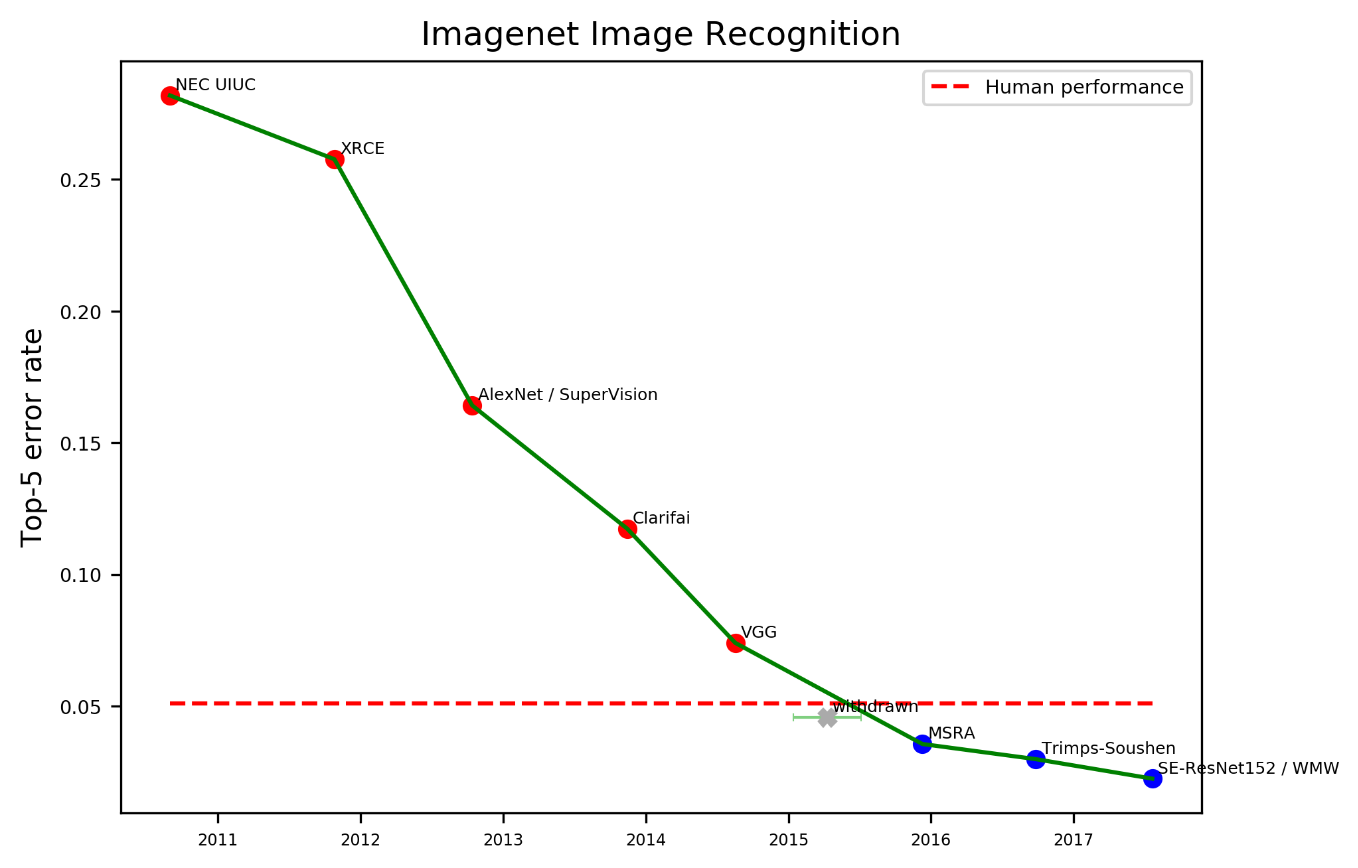
Source: Measuring the Progress of AI Research
And okay, when the result is on ImageNet (although the direct consequence is a new generation of industrial robots), but in speech recognition the same picture:

Source: Measuring the Progress of AI Research
In fact, neural networks have just overtaken the average person in speech recognition and are confidently moving towards overtaking him in recognition in all common languages. Moreover, as we wrote, an increase in the speed of neural network accelerators is likely to be exponential .
As people joke on this subject, we thought recently: yes, soon robots will be able to show tricks at the level of monkeys, and it was assumed that they were very far from the level of a stupid person, and even more so Einstein:

Source: The AI Revolution: The Road to Superintelligence
But suddenly it turned out that the level of an ordinary person has already been achieved (and continues to be achieved in many areas ), and to the level of a rare genius (as shown by competitions with people in chess and Go), the distance suddenly turned out to be less than expected:

Source: Measuring the Progress of AI Research
In chess, prominent people were overtaken about 15 years ago, in Go - three years ago, and the trend is obvious:

Source: The AI Revolution: The Road to Superintelligence
As the legendary General Electric CEO Jack Welch once said: “If the rate of change outside is greater than the rate of change inside, the end is near.” Those. if the company does not change faster than the situation around it changes, it is very much at risk. Alas, he left the post 18 years ago, and since then GE’s affairs have noticeably worsened. GE does not have time to change.
Remembering the predictions about the phone of Western Union specialists, Lord Kelvin’s forecasts, market estimates of Digital Equipment and Microsoft smartphones home computers, against the background of Sechin’s forecasts, I have reasonable concerns. For history repeats itself. And again. And again. And again.
A lot of specialists after studying their field at the institute / university stop developing further. And they make forecasts using the technologies of the last century (in every sense). In recent years, I have been tormented by the question - how quickly will neural networks replace experts who do not know how to apply CAGR? And just like that I want to make a forecast, and I'm afraid to make a mistake. In the direction of shortage, as you understand.
But seriously - the fast rate of change is like the wind. If you know how to set sails correctly (and the sailboat matches), then even the oncoming one will not prevent you from moving forward, and even if you have a fair sail, and with a large CAGR !!!
Along the way CAGR-and all read in the back!
UPD
Habraeffect still works! On the day this material was released, an article about CAGR appeared on the Russian Wikipedia ! The example has not yet been translated, but the beginning has already been made. In addition, you can see here about money or here about technologies with elements of investor tacking
Acknowledgments
I would like to heartily thank:
- Laboratory of Computer Graphics, VMK Moscow State University MV Lomonosov for his contribution to the development of computer graphics in Russia and not only
- personally Konstantin Kozhemyakov, who did a lot to make this article better and more visual,
- and finally, many thanks to Kirill Malyshev, Yegor Sklyarov, Ivan Molodetsky, Nikolai Oplachko, Evgeny Lyapustin, Alexander Ploshkin, Andrei Moskalenko, Aidar Khatiullin, Dmitry Klepikov, Dmitry Konovalchuk, Maxim Velikanov, Alexander Yakovenko and a large number of remarks Kuptsov for a large number of remarks edits that made this text much better!
All Articles