Interactive laboratory of thermodynamics as an effective means of simulation training
Introduction
Simulation training using multimedia educational resources is one of the promising areas of informatization of modern education. By simulation training, we mean a training model in which physical processes and conditions similar to real ones, but having a number of idealized qualities, are virtually reproduced using software. The possibility of interactive interaction with a virtual model of a particular physical process can significantly reduce the level of abstraction of knowledge about this process, resulting in increased efficiency in the acquisition and assimilation of this knowledge by a person [1] .
Object of study and problem statement
As an object of study, we consider one of the most important branches of general physics - classical thermodynamics. In the context of educational activities, knowledge in this discipline is taught in several forms, the main ones are: consolidated theoretical material in the form of lectures and textbooks; practical tasks in the form of collections of tasks and tests; laboratory workshop in the form of guidelines for the implementation of laboratory experiments on the topics of the basic theory. The listed forms of teaching differ in the level of abstraction of the transmitted information, and together they form the most complete picture of knowledge in the discipline being studied.
The most demanding form of knowledge in terms of methodology and technical implementation is a laboratory workshop. To this end, specially equipped educational laboratories that fully meet the requirements of the educational process are created at universities and colleges. Timely access to these laboratories, as a rule, is carried out in the process of students passing full-time training. The ability to work in educational laboratories is inextricably linked with the need for the physical presence of the student in the laboratory premises, as well as the high cost of maintaining and maintaining the laboratory in conditions of its intensive operation.
When a student undergoes distance learning, or offline learning without the help of an educational organization, the ability to perform laboratory experiments is often completely absent. As practice shows, in this case, the student gets acquainted with laboratory experiments through videos or animations found (if possible) in the public domain of the Internet, which is an ineffective way to study the required educational material due to the lack of interactivity and structure of the material, and often language restrictions and low quality of the material presented.
In view of the foregoing, an urgent task for developers of multimedia educational resources is the creation of such a learning tool that would provide the educational process with all the necessary functions in terms of performing experimental work, contain structured methodological material, and contribute to the effective assimilation of knowledge in a particular field of study. On the technical side, this learning tool should have the flexibility to integrate into various distance learning systems (in the form of web applications and software components), the ability to run on mobile devices and personal computers, high performance and ease of management.
An example implementation of a simulation model of a laboratory experiment
Consider the laboratory experiment "Real Gases and the Phase Transition Point" from the course of thermodynamics for students and senior students of secondary schools. The purpose of this experiment is to quantify the real gas (sulfur hexafluoride SF6) and determine its phase transition point. Laboratory experience is performed on a laboratory setup (Figure 1) manufactured by 3B Scientific [2] .
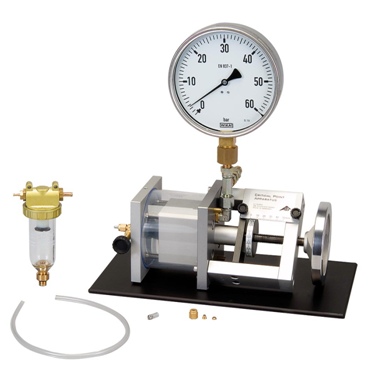
Figure 1 - Appearance of a natural analogue of a laboratory setup for determining the phase transition point of a real gas
The presented laboratory unit is equipped with a gas tank, a gauge for measuring gas pressure in the tank, a movable piston with a screw mechanism and a scale, a valve system and an electronic thermometer for measuring gas temperature. Rotating the flywheel, the piston moves, which in turn changes the free volume of the gas reservoir. The working part of the gas tank is made of translucent material, which allows you to visually observe the state of the test substance during the experiment.
The phase transition point of a real gas is characterized by critical temperature, critical pressure, and critical density. Below the critical temperature, the substance is in a gaseous state at large volumes and in a liquid state at small volumes. At intermediate volumes, it can exist as a mixture of liquid and gas, in which a change in volume under isothermal conditions causes a change in the state of aggregation: the gaseous fraction increases with increasing volume, and the pressure of the mixture remains constant. Since liquids and vapors have different densities, they are separated in the gravitational field. As the temperature rises, the liquid density decreases, and the gas density increases until these two densities become equal to the same critical density value. Above the critical temperature, the gas cannot be converted to a liquid state. However, under isothermal conditions, the gas does not obey the laws of an ideal gas until its temperature has risen significantly above the critical temperature.
The state of the gas, depending on the parameters of pressure (P), volume (V) and temperature (T), is represented using the Clapeyron phase diagram. As the mathematical basis of the experiment, the van der Waals gas model is used:
where Pr is the reduced gas pressure equal to the ratio of its actual pressure to the pressure at the critical point (Pr = P / Pc); Vr is the reduced gas volume equal to the ratio of its actual volume to the volume at the critical point (Vr = V / Vc); Tr is the reduced gas temperature equal to the ratio of its actual temperature to the temperature at the critical point (Tr = T / Tc).
The van der Waals equation allows one to calculate isotherms (lines of equal temperature) for the test gas in the given form (Figure 2).
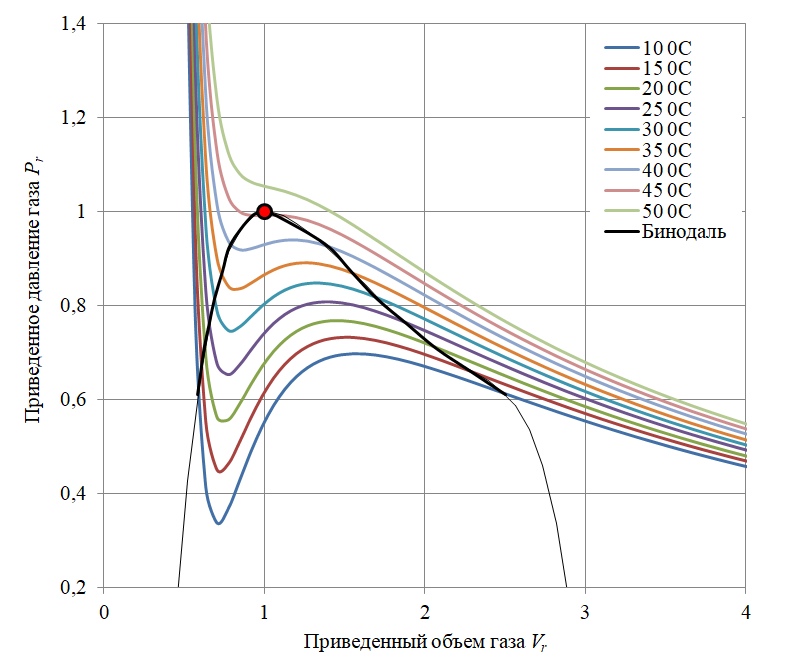
Figure 2 - Clapeyron phase diagram for sulfur hexafluoride SF6 excluding vapor-liquid equilibrium
As can be seen from the diagram in Figure 2, at a gas temperature below the critical temperature (Tc), the van der Waals equation in that part of the isotherm where dPr / dVr> 0 has an oscillatory character. In these areas, the substance is in the form of a mixture of gas and liquid, and in reality, gas condensation occurs along the isobaric path (the volume changes at constant pressure). Thus, the Van der Waals diagram within the so-called binodal curve (black curve in the diagram) [3] inadequately describes the behavior of a real gas.
To solve this problem, the Maxwell method of equal areas was used [4] , the essence of which is to replace the oscillating isothermal section with a horizontal line (isobar) dividing the area described by the isotherm into two areas of equal size (Figure 3).
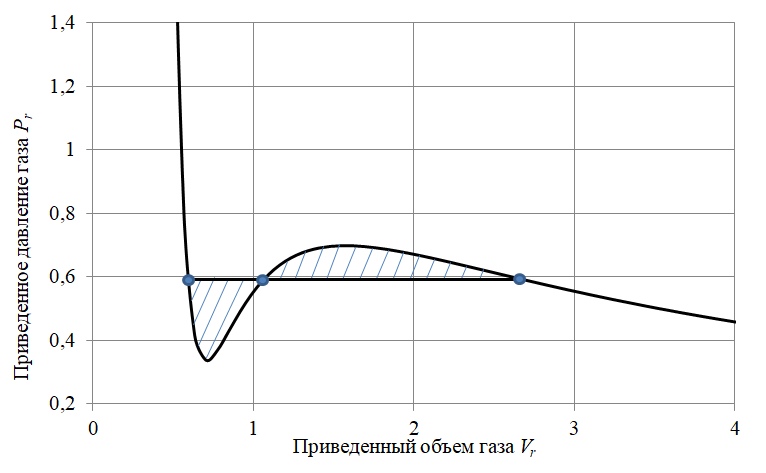
Figure 3 - To the method of equal areas of Maxwell
Below is a code fragment (Matlab) for solving the described problem [4].
function maxwell_equal_area_2 clc; clear all; close all % Tr Tc: Tr = T/Tc Tr = 0.9; % Pr ( --) Prfh = @(Vr) 8/3*Tr./(Vr - 1/3) - 3./(Vr.^2); % Vr = linspace(0.5,4,100); % Pr = Prfh(Vr);
To calculate the areas of two regions formed by the isotherm and isobar, it is necessary to find the three roots of the polynomial equation:
% vdWp = [1 -1/3*(1+8*Tr/y) 3/y -1/y]; % v = sort(roots(vdWp)) % A1 ( ) A1 = (v(2)-v(1))*y - quad(Prfh,v(1),v(2)) % A2 ( ) A2 = quad(Prfh,v(2),v(3)) - (v(3)-v(2))*y % , , , A1=A2 Pr_equal_area = fzero(@equalArea, 0.65)
The results of the calculations can be displayed on the diagram (Figure 4).
xx = [v(1) Vr(Vr >= v(1) & Vr <= v(2)) v(2)]; yy = [Prfh(v(1)) Pr(Vr >= v(1) & Vr <= v(2)) Prfh(v(2))]; lightgray = [0.9 0.9 0.9]; fill(xx,yy,lightgray) xx = [v(2) Vr(Vr >= v(2) & Vr <= v(3)) v(3)]; yy = [Prfh(v(2)) Pr(Vr >= v(2) & Vr <= v(3)) Prfh(v(3))]; fill(xx,yy,lightgray) % text(v(1),1,sprintf('A1 = %f',A1)) text(v(3),1,sprintf('A2 = %f',A2))
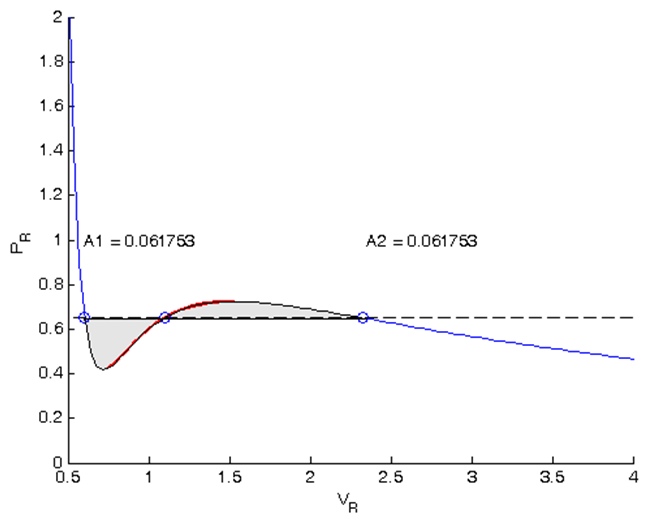
Figure 4 - Results of isobar calculation by the method of equal Maxwell areas in Matlab
The final form of the function for the equal area method:
function Z = equalArea(y) Tr = 0.9; vdWp = [1 -1/3*(1+8*Tr/y) 3/y -1/y]; v = sort(roots(vdWp)); Prfh = @(Vr) 8/3*Tr./(Vr - 1/3) - 3./(Vr.^2); A1 = (v(2)-v(1))*y - quad(Prfh,v(1),v(2)); A2 = quad(Prfh,v(2),v(3)) - (v(3)-v(2))*y; Z = A1 - A2; % : ; :
Thus, the final mathematical model of the experiment is represented by the Clapeyron diagram for sulfur hexafluoride, taking into account the conditions of vapor-liquid equilibrium (Figure 5).
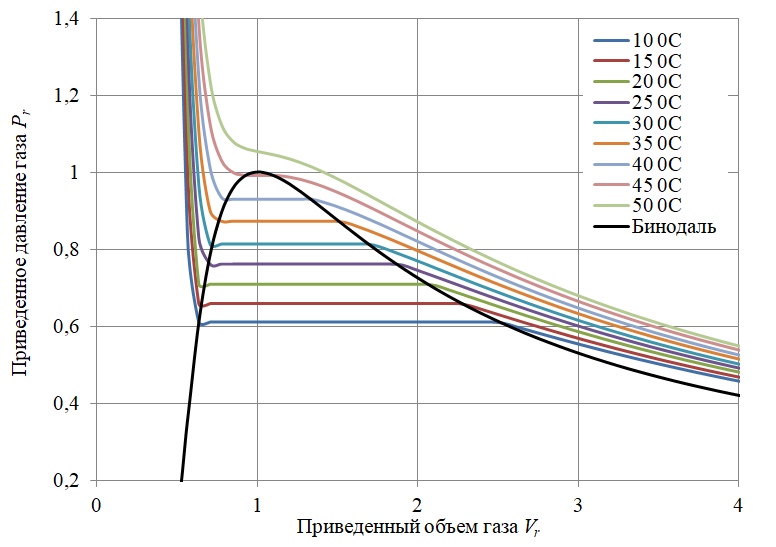
Figure 5 - Clapeyron phase diagram for sulfur hexafluoride SF6 taking into account vapor-liquid equilibrium
Along with the mathematical component, the simulation model of the experiment includes a set of graphic objects that visually reflect laboratory equipment (Figure 6).

Figure 6 - Graphic model of a laboratory setup: 1 - pressure gauge; 2 - circulation thermostat; 3 - electronic thermometer; 4 - gas tank; 5 - volume control mechanism; 6 - gas filling valve
Dynamically generated errors simulating transient (unsteady) processes, measurement inaccuracies, control sensitivity, etc. are added to the measured values in the experiment execution mode. The simulation model fully ensures the observation of the physical process with the possibility of changing the input parameters and experimental conditions.
An example implementation of a virtual laboratory workshop
Based on the example of the methodology for calculating simulation models of physical processes described above, using the high-level programming language AppGameKit , an interactive laboratory workshop of classical thermodynamics was developed, covering the main topics of the course: internal energy, gas laws, heat transfer, thermal expansion, thermodynamic cycles. This development is intended for laboratory experiments in the absence of real laboratory equipment. Laboratory installations are made in accordance with their real counterparts. Each laboratory work includes brief guidelines and reference information necessary for the processing of experimental data.
A distinctive feature of the virtual laboratory is its complementary flexibility due to multi-platform support. Simulation laboratory work is possible on personal computers, mobile devices and in a web browser environment (without the need to install software on a user's device). The presented solution uses a unique algorithm for loading a graphic 3D scene into memory using its own binary data format, which allows reducing the reconstruction time of 3D models in the game engine to several seconds, which is an important factor when running the program on mobile devices.
Figure 7 is a screen shot showing the virtual lab running in the Microsoft Edge web browser, providing full hardware support for 3D graphics based on the HTML5 standard and WebGL technology.
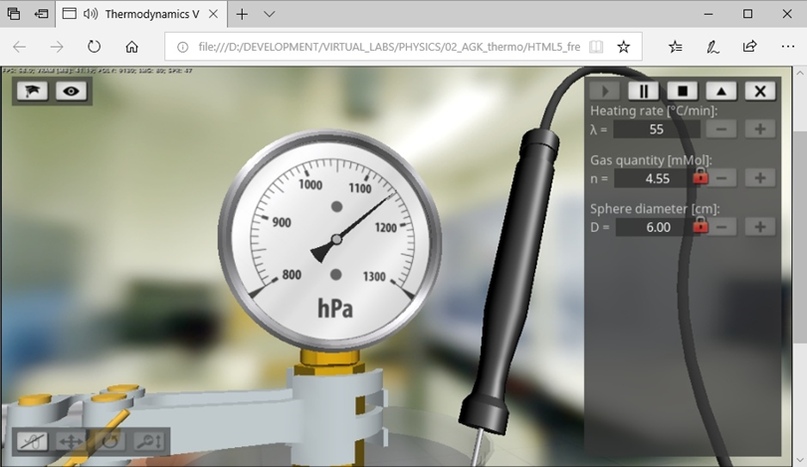
Figure 7 - Running a virtual lab in a Microsoft Edge web browser
Below are the online versions of the laboratory work, for which it is recommended to use the Microsoft Edge web browser, which is part of the Microsoft Windows 10 operating system:
- Internal energy and mechanical work
- Internal energy and electric current
- Boyle-Marriott Law
- Gay Lussac Law
- Air adiabat
- Real gases and phase transition point
- Leslie Cube
- Thermal conductivity
- Thermal expansion of solids
- Water anomaly
- Stirling Engine Model D
- Stirling Engine Model G
- Heat pumps
To perform laboratory work on a mobile device (smartphone or tablet) based on the Android operating system, you can download the mobile application of the virtual laboratory.
Conclusion
The example of the implementation of simulation training tools described in this article on the basis of a virtual laboratory of thermodynamics demonstrates the possibility of supplementing the educational process with an auxiliary methodological tool that meets the requirements and standards of modern general and higher education. The generalized concept of developing multimedia educational resources includes a number of main stages: determining the actual methodological component of the laboratory workshop (including the choice of effective laboratory equipment and its reference and methodological support); development of a simulation-numerical model of the experiment; implementation of the graphic component of a simulation laboratory workshop; implementation of the software component of a simulation laboratory workshop; the integration of a simulation laboratory workshop in the educational process (the introduction of development into an existing training course or the creation of a new training course focused on working with a simulation laboratory workshop).
One of the promising areas of development of simulation education technology at the moment is the implementation of multi-agent training systems, the work of which is based on the algorithms for generating individual educational paths with the dynamic formation of educational content. Such systems provide an adaptive setting of the learning environment, taking into account the individual characteristics of the user profile. These algorithms will allow you to get: for students - a personalized plan, content, methodology and e-learning tools; for teachers - innovative technologies of teaching and analysis of formed competencies, for schools and universities - a modern model of educational process management.
Bibliographic references
All Articles