Flash reliability: expected and unexpected. Part 1. XIV conference of the USENIX association. File storage technologies
Since flash-based solid-state drives are becoming the primary means of permanently storing information in data centers, it is important to realize how reliable they are. To date, a large number of laboratory studies of flash memory chips using synthetic tests have been carried out, but there is not enough information about their behavior in the field. This article is devoted to the results of a large-scale field study covering millions of days of using hard drives, 10 different models of solid state drives, various flash memory technologies (MLC, eMLC, SLC) and more than 6 years of operational use in Google data centers.
We studied a wide range of reliability characteristics of these devices and came to a number of unexpected conclusions. For example, when the drive wears out, the Bit Error Rate (RBER) increases at a much slower rate than the exponential indicator suggests, and, more importantly, it does not allow predicting the occurrence of uncorrectable errors or other types of errors.
The widely used UBER (Unrecoverable Bit Error Rate) metric is not a significant indicator of reliability, since we did not see the relationship between the number of reads and the number of uncorrectable errors. We also found no evidence that during the normal life of the SSD, drives based on the single-level SLC architecture are more reliable than MLC drives. Compared to traditional hard drives, the frequency of replacing flash-based SSDs is much lower, but they have a higher level of error correction.
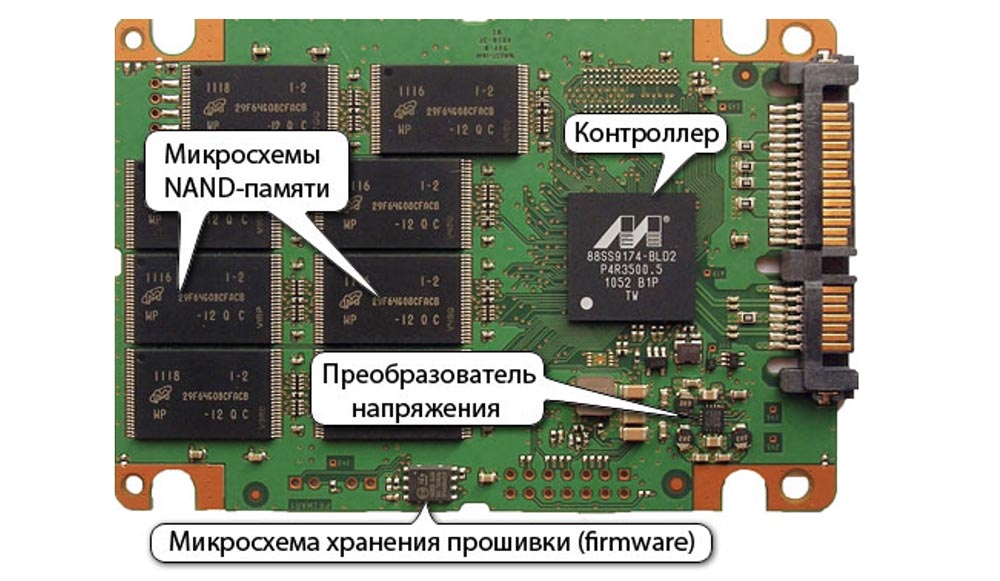
The use of solid-state flash drives based on NAND technology in data centers is constantly growing. The more data that can be placed on such a disk, the greater the safety and availability of information depends on the reliability of the flash drive itself. Although the performance advantages of SSDs over HDDs are well known, the failure characteristics of flash drives are not well understood.
The data provided by flash memory manufacturers contains only vague guarantees, such as the number of erase cycles until the device is completely worn out. A typical understanding of the issue is based on studies that study the reliability of flash drives by conducting controlled laboratory experiments (for example, accelerated durability tests). At the same time, a small number of devices selected at random are used for tests on the effects of synthetic workloads. There is a lack of research establishing a link between laboratory test results and reliability characteristics of flash drives that operate in real conditions.
This article provides detailed results of a field study of the reliability of flash drives, based on data collected over 6 years of their operation in Google data centers. This data covers millions of days of disk operation (the exact number of disks and devices using them is confidential by Google, so we can’t provide exact numbers. However, we were able to verify the statistical significance of the data provided to us), ten different flash drives, various flash -technologies (MLC, eMLC and SLC) with chip technology from 24 to 50 nm.
We used this data to provide a better understanding of the operational reliability of flash memory. In particular, we analyzed such aspects of device reliability:
We made sure that our analysis reveals a number of aspects of the reliability of flash memory in the field, which differ from the conclusions made in previous works. We hope that our work will serve as an incentive for further research in this area.

Tab. 1. Characteristics of the modules that participated in the field tests.
Our research involved serial high-performance SSD drives based on industrial flash chips, but we used a custom PCIe interface, custom firmware, and a driver. We focused on 2 generations of drives, where all drives of the same generation use the same device driver and the same firmware. This means that they also use the same error correction codes (ECCs) to detect and fix damaged bits and the same algorithms for determining the degree of wear. The main difference between drive models of the same generation is the type of memory chip used.
Our study focused on 10 drive models, the main characteristics of which are shown in Table 1. We selected models from four manufacturers, each of which worked for several million days, using the three most common types of flash memory (MLC, SLC, eMLC).
We used data from daily monitoring of the operation of flash drives in the field over a 6-year period of operation. In addition, various types of errors were counted daily, statistics on the workload were compiled, including the number of write and erase operations, and the number of bad blocks that occurred during the day was calculated. The number of read, write, and erase operations included both the number of user operations and the number of internal “garbage collection” operations. Also used were records recording cases of chip failure, as well as cases of repair or replacement of SSDs.
Let's start with some basic statistics about the frequency of occurrence of various types of errors in the field. We highlight transparent errors that are invisible to the user and opaque errors that lead to the failure of user operations. The flash drive driver reports the following types of transparent errors:
Correctable error: during a read operation, the detected error is corrected by the built-in ECC error correction function.
Devices also report the following types of opaque errors:
Fatal errors include errors that were detected during user-initiated operations or internal garbage collection operations, while final read errors include errors that occurred during user operations.
Please note that errors vary in severity of the impact. Besides the difference between transparent and opaque errors, the severity of the opaque errors themselves changes. In particular, some of these errors (final read error, fatal error, meta error) lead to data loss if the system does not have redundancy at higher levels, because the disk cannot provide the user with data that has been accepted for storage.
We considered only disks that were put into production at least 4 years ago (eMLC disks were released 3 years ago, since this is a newer type of flash drives), and errors that occurred during the first 4 years of operation. Table 2 shows the percentage of disks of each model that are subject to different types of errors if these errors occurred at least 1 time (upper half of the table) and the percentage of days of operation during which the drives were subject to errors of a certain type (lower half of the table).
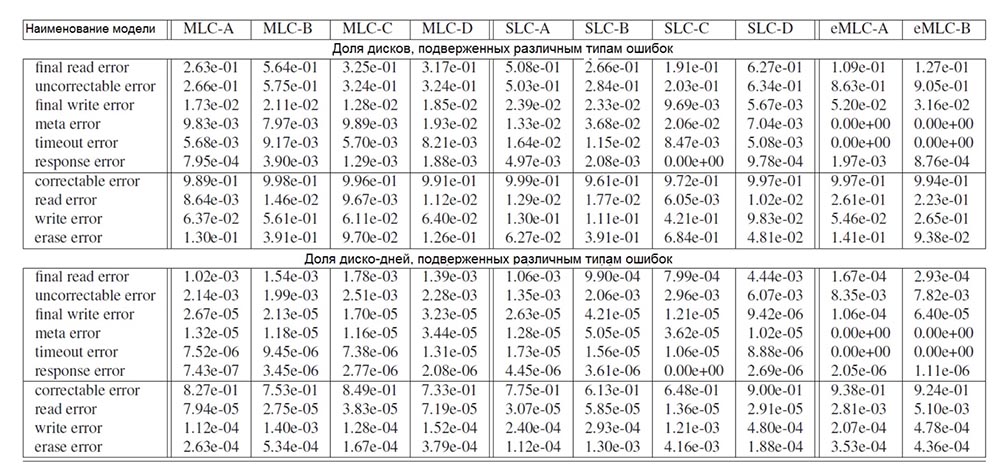
Tab. 2. The prevalence of various types of errors. The upper half of the table shows the percentage of disks affected by errors, and the lower half shows the percentage of disk usage days during which various types of errors occurred.
We believe that the most common opaque errors are final read errors, that is, errors that cannot be corrected by a repeated read operation. Depending on the model of the drive, at least 20-63% of devices have such an error occurred within 2-6 days out of 1000 days of disk operation.
We conclude that the number of final read errors is highly correlated with the number of uncorrectable errors and that these final read errors occur solely because bit damage cannot be fixed using ECC. For all disk models, the final read errors occur 2 orders of magnitude more often (if you focus on the number of days the drives were used when these errors occurred) than any other type of opaque errors.
Unlike read errors, write errors rarely turn into opaque errors. Depending on the model, only 1.5-2.5% of the discs experienced a final write error within 1-4 days out of 10,000 days of operation, i.e. unsuccessful write operation that was not corrected after repeated attempts. This difference in the frequency of the final read and write errors is probably due to the fact that the failed write operation was simply corrected by writing to a different location on the disk in the area with the bits intact. Thus, if the failure of the read operation can only be caused by the presence of several corrupted bits, the final write error indicates a larger hardware problem.
Meta errors occur with a frequency comparable to the frequency of occurrence of write errors, but again much less often than the final read errors. This is not surprising, given that the disk contains much less metadata than the amount of real data, which reduces the frequency of access to the metadata. Other opaque errors (timeout errors and response errors) are quite rare and, as a rule, affect less than 1% of disks during 1 day out of 100,000 days of disk operation.
Not surprisingly, bug fixes are the most common type of transparent error. Almost all drives have at least a few correctable errors that occur during most days of disk operation (61-90%). Errors that can be corrected in more detail, including bit error rate analysis (RBER), are discussed in Section 4 of this article.
The following most common transparent error types are write and erase errors. Usually they occur in 6-10% of drives, but for some models SSDs reach as much as 40-68%. In most cases, such errors occur in less than 5 days out of 10,000 days of operation. According to our study, write and erase errors indicate damage to the unit; this issue is discussed in detail in section 6.
Errors that occur during read operations are less common than transparent errors, probably because, apart from correcting errors on the fly using ECC, this problem is not fixed by repeated operations. Incomplete read errors, i.e., read errors that can be corrected by retrying, occur in less than 2% of drives and last less than 2-8 days out of 100,000 days of disk usage.
As a result, in addition to the correctable errors that occur in a large number of days of disk operation, transparent errors occur less frequently compared to all types of opaque errors. The most common type of opaque errors are uncorrectable errors that occur over 2-6 days out of 1000 days of disk operation.
The standard metric for evaluating the reliability of flash drives is the bit error rate (RBER) of the disk, which is defined as the ratio of the number of damaged bits to the number of bits read (including cases of both correctable and uncorrectable errors).
The second generation of drives (eMLC-A and eMLC-B models) provides the exact number of damaged bits and read bits, allowing us to determine the RBER with high accuracy.
The first generation of drives reports the exact number of bits read, but for each page consisting of 16 data blocks, a report is provided on the number of damaged bits of only the data block that had the largest number of damaged bits. As a result of this, in the worst statistical case, when all blocks contain errors and the number of these errors is the same, the RBER coefficient can be 16 times higher than the coefficient obtained on the basis of the disk status report.
This problem does not matter much while comparison is made between drives of the same generation, but it should be taken into account when comparing drives of different generations.

Tab. 3. Aggregated bit error rate RBER for various SSD models.
Table 3 shows the median RBER value for each drive model for all drives of this model, as well as the 95th and 99th percentiles. We decided to work with medians and percentiles, because we find the averaged indicators highly biased due to several sharply distinguished values, which makes it difficult to identify any trends.
We observe large differences in RBER for different drive models, ranging from 5.8e-10 to more than 3e-08 for first-generation drives. These differences are even greater when considering not the median RBER value, but the 95th or 99th percentile. For example, the 99th RBER percentile ranges from 2.2e-08 for the SLC-B model to 2.7e-05 for the MLC-D model. There are big differences even within the drive line of the same model: the RBER drive in the 99th percentile tends to be at least an order of magnitude larger than the median RBER drive of the same model.
The RBER difference between the models can be partially explained by differences in the underlying flash technology. The RBER value for MLC models is higher than for SLC models, so the higher price of SLC models takes into account the lower RBER value. In section 5 of this article, we will see how these differences translate into differences in opaque errors that are visible to the user.
EMLC models report RBER, which is several orders of magnitude higher than that of other drive models. Even taking into account that the first generation RBER drives can be 16 times higher in the worst case, the existing difference in the coefficient values is an order of magnitude larger. We assume that there is a size factor, since the two eMLC models have chips with the lowest microelectronic lithography compared to all other drive models.
Finally, there are no manufacturers whose products have advantages over products from other manufacturers. Within the SLC and eMLC disk group, the same vendor produces both one of the worst and one of the best models in the group.
In general, RBER varies greatly between different drive models, as well as between SDDs of the same model. This motivates us to further study the factors that influence RBER.
In this section, we will examine the effect on RBER of a number of factors:
We studied the effect of each factor on RBER in two different ways. We used visual visual data by plotting the influence of factors on RBER and examined quantitative indicators of influence using the correlation coefficient. We used Spearman's rank correlation coefficient, since it can cover monotonic nonlinear relationships in nonparametric methods, in contrast to, for example, Pearson's correlation coefficient.
Before analyzing the individual factors in detail, we compiled a summary graph depicted in Figure 1.

Fig. 1. The dependence of the Spearman rank correlation coefficient between the RBER value during the month of disk operation and other factors.
This shows the relationship between the Spearman rank correlation coefficient between the RBER value during the month of disk operation and factors such as the number of previous PE cycles, the number of reads, writes or erases this month, the RBER value in the previous month, and the number of uncorrectable errors (UE) in previous month. Spearman's rank correlation coefficient can vary from -1 (strong negative correlation) to +1 (strong positive correlation).
Each group of labels shows the correlation coefficients between RBER and one specific factor (see interpretation on the X axis), and the different labels in each group correspond to different drive models. All correlation coefficients deserve more than 95% confidence.
We made sure that all factors, except the occurrence of fatal errors in the previous month, show a clear dependence with RBER, at least for some models. We also drew attention to the fact that some of these dependencies may be false, since some factors may correlate with each other, therefore, we examined each factor in more detail in the next subsection.
Since the endurance of the flash memory cell is limited, the RBER coefficient increases with increasing Program / Erase (PE) cycles. The high correlation coefficients between RBER and PE cycles in Figure 2 prove their relationship.

Fig. 2. The dependence of the median and 95 percent percent RBER on the number of PE cycles.
Figure 2 allows us to study in more detail the dependence of the median and 95th percentile RBER on the number of PE cycles. We obtained these graphs by dividing all the drive days according to our data in different containers, based on the calculation of their PE cycles, and then we determined the median and the 95th percentile RBER after all operating days in the container.
As expected, we made sure that RBER grows with the number of PE cycles both in terms of the median and the 95th percentile of RBER. However, the growth rate is slower than the usual expected exponential growth, and more like a linear increase. We tested this observation by plotting the curve: we adjusted the linear model and the exponential model to the data and found that the linear model fits better than the exponential one.
A second interesting observation is that the RBER wear coefficients vary significantly between disc models, even those models that have very similar RBER values for small PE cycles. For example, four MLC models started up with almost identical RBERs on very small PE cycles, but by the time they reached the PE cycle limit (3,000 for all MLC models), there was a 4-fold difference between the model with the highest and lowest RBER
Finally, we found that the RBER increase occurs surprisingly smoothly, even when the disk crosses the line of the expected end of life (see, for example, the MLC-D model with the limit cycle PE = 3000). Note that accelerated durability tests showed a rapid increase in RBER only after reaching the 3-fold PE cycle limit set by the device manufacturer, which implies that vendors are very conservative in choosing the PE cycle limit.
To be continued here ...
Thank you for staying with us. Do you like our articles? Want to see more interesting materials? Support us by placing an order or recommending it to your friends, a 30% discount for Habr users on a unique analogue of entry-level servers that was invented by us for you: The whole truth about VPS (KVM) E5-2650 v4 (6 Cores) 10GB DDR4 240GB SSD 1Gbps from $ 20 or how to divide the server? (options are available with RAID1 and RAID10, up to 24 cores and up to 40GB DDR4).
Dell R730xd 2 times cheaper? Only we have 2 x Intel TetraDeca-Core Xeon 2x E5-2697v3 2.6GHz 14C 64GB DDR4 4x960GB SSD 1Gbps 100 TV from $ 199 in the Netherlands! Dell R420 - 2x E5-2430 2.2Ghz 6C 128GB DDR3 2x960GB SSD 1Gbps 100TB - from $ 99! Read about How to Build Infrastructure Bldg. class c using Dell R730xd E5-2650 v4 servers costing 9,000 euros for a penny?
We studied a wide range of reliability characteristics of these devices and came to a number of unexpected conclusions. For example, when the drive wears out, the Bit Error Rate (RBER) increases at a much slower rate than the exponential indicator suggests, and, more importantly, it does not allow predicting the occurrence of uncorrectable errors or other types of errors.
The widely used UBER (Unrecoverable Bit Error Rate) metric is not a significant indicator of reliability, since we did not see the relationship between the number of reads and the number of uncorrectable errors. We also found no evidence that during the normal life of the SSD, drives based on the single-level SLC architecture are more reliable than MLC drives. Compared to traditional hard drives, the frequency of replacing flash-based SSDs is much lower, but they have a higher level of error correction.
1. Introduction
The use of solid-state flash drives based on NAND technology in data centers is constantly growing. The more data that can be placed on such a disk, the greater the safety and availability of information depends on the reliability of the flash drive itself. Although the performance advantages of SSDs over HDDs are well known, the failure characteristics of flash drives are not well understood.
The data provided by flash memory manufacturers contains only vague guarantees, such as the number of erase cycles until the device is completely worn out. A typical understanding of the issue is based on studies that study the reliability of flash drives by conducting controlled laboratory experiments (for example, accelerated durability tests). At the same time, a small number of devices selected at random are used for tests on the effects of synthetic workloads. There is a lack of research establishing a link between laboratory test results and reliability characteristics of flash drives that operate in real conditions.
This article provides detailed results of a field study of the reliability of flash drives, based on data collected over 6 years of their operation in Google data centers. This data covers millions of days of disk operation (the exact number of disks and devices using them is confidential by Google, so we can’t provide exact numbers. However, we were able to verify the statistical significance of the data provided to us), ten different flash drives, various flash -technologies (MLC, eMLC and SLC) with chip technology from 24 to 50 nm.
We used this data to provide a better understanding of the operational reliability of flash memory. In particular, we analyzed such aspects of device reliability:
- Various types of errors that occur in flash-memory and the frequency of their occurrence in the field (section 3).
- Bit error rate (RBER), the influence of such factors as wear, drive age and workload, as well as the relationship of RBER with other types of errors (section 4).
- Unrecoverable errors, their frequency and the influence of various factors on them (section 5).
- Field characteristics of various types of equipment failures, including complex failures, chip failures, and the frequency of repair and replacement drives (section 6).
- 5. Reliability comparison of various flash technologies (MLC, eMLC, SLC disks) (section 7) and comparison of SSD and HDD reliability (section 8).
We made sure that our analysis reveals a number of aspects of the reliability of flash memory in the field, which differ from the conclusions made in previous works. We hope that our work will serve as an incentive for further research in this area.
Tab. 1. Characteristics of the modules that participated in the field tests.
2. Background information on data and systems
2.1. Flash drives
Our research involved serial high-performance SSD drives based on industrial flash chips, but we used a custom PCIe interface, custom firmware, and a driver. We focused on 2 generations of drives, where all drives of the same generation use the same device driver and the same firmware. This means that they also use the same error correction codes (ECCs) to detect and fix damaged bits and the same algorithms for determining the degree of wear. The main difference between drive models of the same generation is the type of memory chip used.
Our study focused on 10 drive models, the main characteristics of which are shown in Table 1. We selected models from four manufacturers, each of which worked for several million days, using the three most common types of flash memory (MLC, SLC, eMLC).
2.2. Data used
We used data from daily monitoring of the operation of flash drives in the field over a 6-year period of operation. In addition, various types of errors were counted daily, statistics on the workload were compiled, including the number of write and erase operations, and the number of bad blocks that occurred during the day was calculated. The number of read, write, and erase operations included both the number of user operations and the number of internal “garbage collection” operations. Also used were records recording cases of chip failure, as well as cases of repair or replacement of SSDs.
3. The prevalence of various types of errors
Let's start with some basic statistics about the frequency of occurrence of various types of errors in the field. We highlight transparent errors that are invisible to the user and opaque errors that lead to the failure of user operations. The flash drive driver reports the following types of transparent errors:
Correctable error: during a read operation, the detected error is corrected by the built-in ECC error correction function.
- Read error Read error: an error that occurs during the reading process (for memory without non-ECC error correction), corrected upon repeated reading;
- Write error Write error: An error is a write operation that succeeds after a second attempt.
- Erase error Erase error: The erase operation in the block fails.
Devices also report the following types of opaque errors:
- Uncorrectable error: during the operation, more corrupted bits occur than ECC can fix.
- Final read error Final read error: an error that occurred while reading is not fixed upon repeated attempts;
- Final write error Final write error: an error that occurred while writing is not fixed upon repeated attempts;
- Meta-error Meta-error: error accessing the internal metadata of the disk.
- Timeout error Timeout error: operation aborts after 3 seconds.
Fatal errors include errors that were detected during user-initiated operations or internal garbage collection operations, while final read errors include errors that occurred during user operations.
Please note that errors vary in severity of the impact. Besides the difference between transparent and opaque errors, the severity of the opaque errors themselves changes. In particular, some of these errors (final read error, fatal error, meta error) lead to data loss if the system does not have redundancy at higher levels, because the disk cannot provide the user with data that has been accepted for storage.
We considered only disks that were put into production at least 4 years ago (eMLC disks were released 3 years ago, since this is a newer type of flash drives), and errors that occurred during the first 4 years of operation. Table 2 shows the percentage of disks of each model that are subject to different types of errors if these errors occurred at least 1 time (upper half of the table) and the percentage of days of operation during which the drives were subject to errors of a certain type (lower half of the table).
Tab. 2. The prevalence of various types of errors. The upper half of the table shows the percentage of disks affected by errors, and the lower half shows the percentage of disk usage days during which various types of errors occurred.
3.1. Opaque errors
We believe that the most common opaque errors are final read errors, that is, errors that cannot be corrected by a repeated read operation. Depending on the model of the drive, at least 20-63% of devices have such an error occurred within 2-6 days out of 1000 days of disk operation.
We conclude that the number of final read errors is highly correlated with the number of uncorrectable errors and that these final read errors occur solely because bit damage cannot be fixed using ECC. For all disk models, the final read errors occur 2 orders of magnitude more often (if you focus on the number of days the drives were used when these errors occurred) than any other type of opaque errors.
Unlike read errors, write errors rarely turn into opaque errors. Depending on the model, only 1.5-2.5% of the discs experienced a final write error within 1-4 days out of 10,000 days of operation, i.e. unsuccessful write operation that was not corrected after repeated attempts. This difference in the frequency of the final read and write errors is probably due to the fact that the failed write operation was simply corrected by writing to a different location on the disk in the area with the bits intact. Thus, if the failure of the read operation can only be caused by the presence of several corrupted bits, the final write error indicates a larger hardware problem.
Meta errors occur with a frequency comparable to the frequency of occurrence of write errors, but again much less often than the final read errors. This is not surprising, given that the disk contains much less metadata than the amount of real data, which reduces the frequency of access to the metadata. Other opaque errors (timeout errors and response errors) are quite rare and, as a rule, affect less than 1% of disks during 1 day out of 100,000 days of disk operation.
3.2. Transparent errors
Not surprisingly, bug fixes are the most common type of transparent error. Almost all drives have at least a few correctable errors that occur during most days of disk operation (61-90%). Errors that can be corrected in more detail, including bit error rate analysis (RBER), are discussed in Section 4 of this article.
The following most common transparent error types are write and erase errors. Usually they occur in 6-10% of drives, but for some models SSDs reach as much as 40-68%. In most cases, such errors occur in less than 5 days out of 10,000 days of operation. According to our study, write and erase errors indicate damage to the unit; this issue is discussed in detail in section 6.
Errors that occur during read operations are less common than transparent errors, probably because, apart from correcting errors on the fly using ECC, this problem is not fixed by repeated operations. Incomplete read errors, i.e., read errors that can be corrected by retrying, occur in less than 2% of drives and last less than 2-8 days out of 100,000 days of disk usage.
As a result, in addition to the correctable errors that occur in a large number of days of disk operation, transparent errors occur less frequently compared to all types of opaque errors. The most common type of opaque errors are uncorrectable errors that occur over 2-6 days out of 1000 days of disk operation.
4. Bit error rate (RBER)
The standard metric for evaluating the reliability of flash drives is the bit error rate (RBER) of the disk, which is defined as the ratio of the number of damaged bits to the number of bits read (including cases of both correctable and uncorrectable errors).
The second generation of drives (eMLC-A and eMLC-B models) provides the exact number of damaged bits and read bits, allowing us to determine the RBER with high accuracy.
The first generation of drives reports the exact number of bits read, but for each page consisting of 16 data blocks, a report is provided on the number of damaged bits of only the data block that had the largest number of damaged bits. As a result of this, in the worst statistical case, when all blocks contain errors and the number of these errors is the same, the RBER coefficient can be 16 times higher than the coefficient obtained on the basis of the disk status report.
This problem does not matter much while comparison is made between drives of the same generation, but it should be taken into account when comparing drives of different generations.
Tab. 3. Aggregated bit error rate RBER for various SSD models.
4.1. High Level RBER Review
Table 3 shows the median RBER value for each drive model for all drives of this model, as well as the 95th and 99th percentiles. We decided to work with medians and percentiles, because we find the averaged indicators highly biased due to several sharply distinguished values, which makes it difficult to identify any trends.
We observe large differences in RBER for different drive models, ranging from 5.8e-10 to more than 3e-08 for first-generation drives. These differences are even greater when considering not the median RBER value, but the 95th or 99th percentile. For example, the 99th RBER percentile ranges from 2.2e-08 for the SLC-B model to 2.7e-05 for the MLC-D model. There are big differences even within the drive line of the same model: the RBER drive in the 99th percentile tends to be at least an order of magnitude larger than the median RBER drive of the same model.
The RBER difference between the models can be partially explained by differences in the underlying flash technology. The RBER value for MLC models is higher than for SLC models, so the higher price of SLC models takes into account the lower RBER value. In section 5 of this article, we will see how these differences translate into differences in opaque errors that are visible to the user.
EMLC models report RBER, which is several orders of magnitude higher than that of other drive models. Even taking into account that the first generation RBER drives can be 16 times higher in the worst case, the existing difference in the coefficient values is an order of magnitude larger. We assume that there is a size factor, since the two eMLC models have chips with the lowest microelectronic lithography compared to all other drive models.
Finally, there are no manufacturers whose products have advantages over products from other manufacturers. Within the SLC and eMLC disk group, the same vendor produces both one of the worst and one of the best models in the group.
In general, RBER varies greatly between different drive models, as well as between SDDs of the same model. This motivates us to further study the factors that influence RBER.
4.2. What factors influence the RBER value
In this section, we will examine the effect on RBER of a number of factors:
- wear caused by Program / Erase (PE) cycles;
- physical age, i.e. the number of months during which the device was operated in the field, regardless of PE cycles;
- workload, measured by the number of read, write and erase operations, as well as the number of operations on the page that could potentially damage surrounding memory cells;
- the presence of other types of errors.
We studied the effect of each factor on RBER in two different ways. We used visual visual data by plotting the influence of factors on RBER and examined quantitative indicators of influence using the correlation coefficient. We used Spearman's rank correlation coefficient, since it can cover monotonic nonlinear relationships in nonparametric methods, in contrast to, for example, Pearson's correlation coefficient.
Before analyzing the individual factors in detail, we compiled a summary graph depicted in Figure 1.
Fig. 1. The dependence of the Spearman rank correlation coefficient between the RBER value during the month of disk operation and other factors.
This shows the relationship between the Spearman rank correlation coefficient between the RBER value during the month of disk operation and factors such as the number of previous PE cycles, the number of reads, writes or erases this month, the RBER value in the previous month, and the number of uncorrectable errors (UE) in previous month. Spearman's rank correlation coefficient can vary from -1 (strong negative correlation) to +1 (strong positive correlation).
Each group of labels shows the correlation coefficients between RBER and one specific factor (see interpretation on the X axis), and the different labels in each group correspond to different drive models. All correlation coefficients deserve more than 95% confidence.
We made sure that all factors, except the occurrence of fatal errors in the previous month, show a clear dependence with RBER, at least for some models. We also drew attention to the fact that some of these dependencies may be false, since some factors may correlate with each other, therefore, we examined each factor in more detail in the next subsection.
4.2.1. RBER and wear
Since the endurance of the flash memory cell is limited, the RBER coefficient increases with increasing Program / Erase (PE) cycles. The high correlation coefficients between RBER and PE cycles in Figure 2 prove their relationship.
Fig. 2. The dependence of the median and 95 percent percent RBER on the number of PE cycles.
Figure 2 allows us to study in more detail the dependence of the median and 95th percentile RBER on the number of PE cycles. We obtained these graphs by dividing all the drive days according to our data in different containers, based on the calculation of their PE cycles, and then we determined the median and the 95th percentile RBER after all operating days in the container.
As expected, we made sure that RBER grows with the number of PE cycles both in terms of the median and the 95th percentile of RBER. However, the growth rate is slower than the usual expected exponential growth, and more like a linear increase. We tested this observation by plotting the curve: we adjusted the linear model and the exponential model to the data and found that the linear model fits better than the exponential one.
A second interesting observation is that the RBER wear coefficients vary significantly between disc models, even those models that have very similar RBER values for small PE cycles. For example, four MLC models started up with almost identical RBERs on very small PE cycles, but by the time they reached the PE cycle limit (3,000 for all MLC models), there was a 4-fold difference between the model with the highest and lowest RBER
Finally, we found that the RBER increase occurs surprisingly smoothly, even when the disk crosses the line of the expected end of life (see, for example, the MLC-D model with the limit cycle PE = 3000). Note that accelerated durability tests showed a rapid increase in RBER only after reaching the 3-fold PE cycle limit set by the device manufacturer, which implies that vendors are very conservative in choosing the PE cycle limit.
To be continued here ...
Thank you for staying with us. Do you like our articles? Want to see more interesting materials? Support us by placing an order or recommending it to your friends, a 30% discount for Habr users on a unique analogue of entry-level servers that was invented by us for you: The whole truth about VPS (KVM) E5-2650 v4 (6 Cores) 10GB DDR4 240GB SSD 1Gbps from $ 20 or how to divide the server? (options are available with RAID1 and RAID10, up to 24 cores and up to 40GB DDR4).
Dell R730xd 2 times cheaper? Only we have 2 x Intel TetraDeca-Core Xeon 2x E5-2697v3 2.6GHz 14C 64GB DDR4 4x960GB SSD 1Gbps 100 TV from $ 199 in the Netherlands! Dell R420 - 2x E5-2430 2.2Ghz 6C 128GB DDR3 2x960GB SSD 1Gbps 100TB - from $ 99! Read about How to Build Infrastructure Bldg. class c using Dell R730xd E5-2650 v4 servers costing 9,000 euros for a penny?
All Articles