Draw a sound
Five years ago, an article "Printing and reproducing sound on paper" was published on Habré - about the system for creating and playing spectrograms . Then, a year and a half ago, Meklon published a quest in which such a black and white logarithmic spectrogram became one of the stages. According to the author’s intention, it was necessary to print it on a printer, scan it with a smartphone with a player application, and use the “dictated” password in this way.

At that moment, I had no reach for either a printer or a smartphone, so I was interested in two aspects of the task:
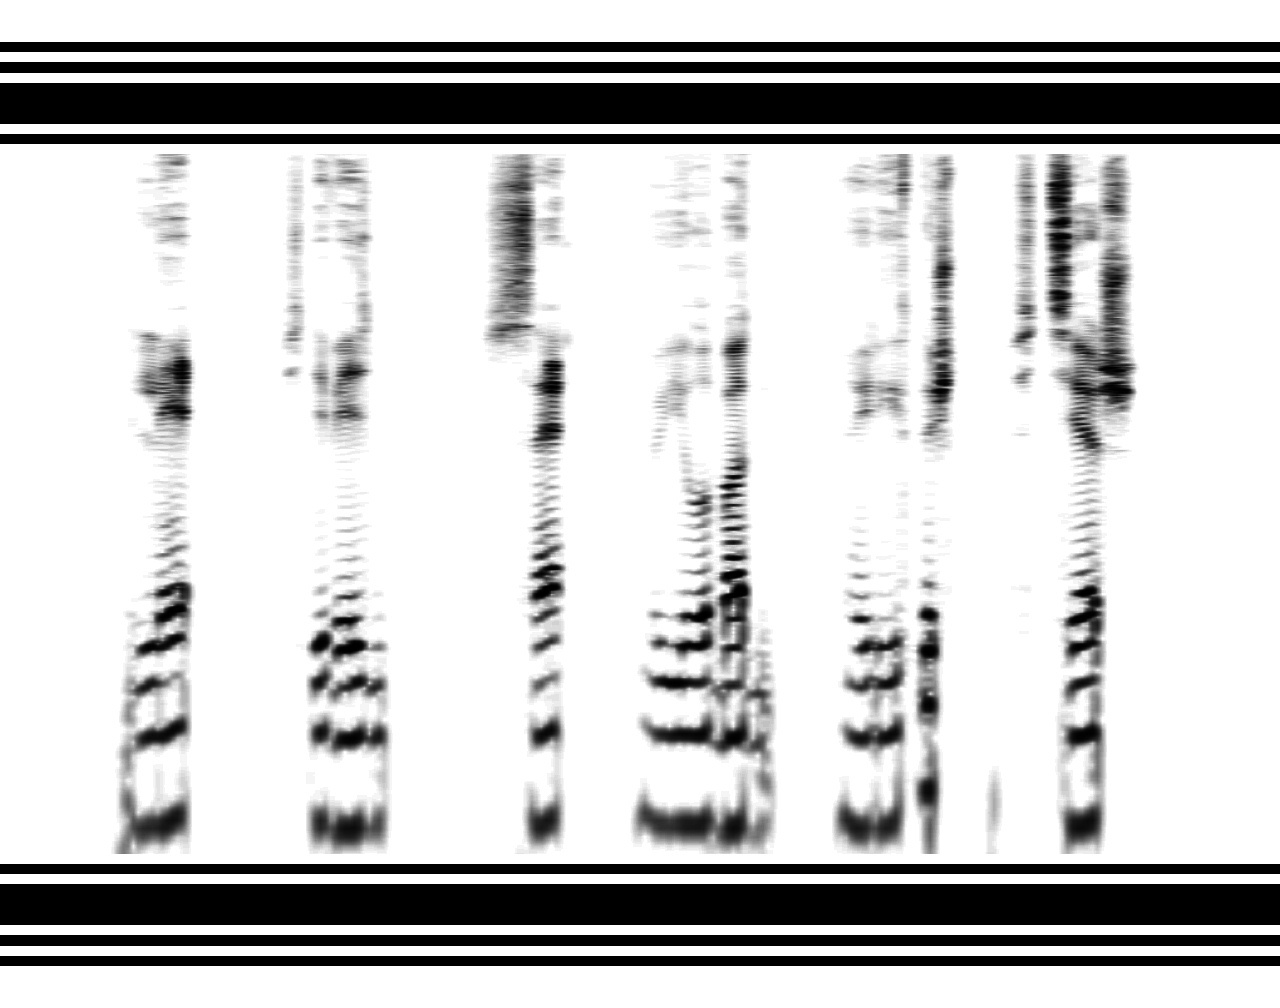
(For those who see spectrograms for the first time, it’s worthwhile to clarify that this is a graph where the reproduction time goes along the horizontal axis, the sound frequency along the vertical axis (it is logarithmic), and the degree of blackness of the dot indicates the power of this frequency at a given time.)
I did not find any ready-made scripts for reproducing spectrograms, although examples are easy to find for the inverse conversion - sound to spectrogram * , due to the fact that the functionality of
is built into the Web Audio API. But to convert a frequency array to a PCM array for playback, you cannot do without implementing the inverse Fourier transform (DFT) in a script.
The result you can admire at tyomitch.github.io/#meklon.png
Below you can see repeating horizontal stripes - formants , by the position of which vowels are recognized. At the top - vertical “bursts” corresponding to noisy consonants : wider - slotted (fricative), narrower - vocal. As for the sonorous consonants ([r] and [l]), “clouds” in the middle frequencies correspond.

In order to play with the spectrogram, I attached a primitive drawing, almost entirely copied from the canvas drawing tutorial . The “Copy” button allows you to transfer the image to the red channel (it is ignored by the synthesizer) and try to “circle” the sounds.
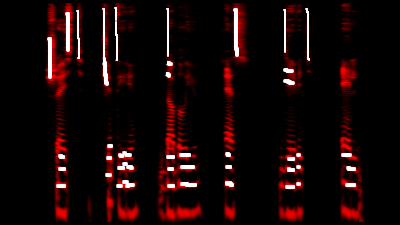
Wikipedia writes: “It is believed that the allocation of four formants is sufficient to characterize the sounds of speech . ” We circle the formants F 2 -F 4 (for some reason F 1 is ignored by the synthesizer), and make sure that the vowels are fully recognized:

Then we circle the noisy consonants: the affricate [h] is [t], smoothly passing into [w]; and voiced [d] from deaf [t] is distinguished by the presence of mid-frequency formants. Now you can distinguish between the numbers "six" and "de'it":

We add dark gray sonor consonants: at the same time, note that [p] slightly “raises” the vowel formants, and [l] - on the contrary, omits.

Only the labial consonants [b] and [c] remained undeveloped, but even without them the password is more or less clear .
Is it possible to draw sound from scratch without tracing the spectrogram of the audio recording? Frankly, I did not succeed. Maybe you want to try it yourself?

At that moment, I had no reach for either a printer or a smartphone, so I was interested in two aspects of the task:
- What is the easiest way to decode the spectrogram without additional devices and without additional software - preferably, right in the browser?
- Is it possible to decrypt it without any software at all - “by eye”?
(For those who see spectrograms for the first time, it’s worthwhile to clarify that this is a graph where the reproduction time goes along the horizontal axis, the sound frequency along the vertical axis (it is logarithmic), and the degree of blackness of the dot indicates the power of this frequency at a given time.)
I did not find any ready-made scripts for reproducing spectrograms, although examples are easy to find for the inverse conversion - sound to spectrogram * , due to the fact that the functionality of
AnalyserNode.getByteFrequencyData()
is built into the Web Audio API. But to convert a frequency array to a PCM array for playback, you cannot do without implementing the inverse Fourier transform (DFT) in a script.
* In the first example, as an audio recording for spectral analysis, a fragment of the track " "from Aphex Twin: as a secret message, the musician embedded a selfie on this track, which appears on a logarithmic spectrogram. Unfortunately, in this example the spectrogram is displayed linearly, so that the face is stretched at the top and compressed at the bottom.Regarding the implementation of DFT, it is immediately clear that such a “crasher” in pure JavaScript will work slowly and sadly; fortunately, I discovered the ready-made port of the FFTW library (“Fastest Fourier Transform in the West”) on asm.js is a form of representation of low-level code, usually written in C, which modern browsers promise to run at a speed almost like compiled to machine code. The binding for FFTW, which turns a black and white image into a WAV file, I took from ARSS and personally rewrote it in JavaScript. ARSS accepts images inverted compared to PhonoPaper, and I did not change it.
The result you can admire at tyomitch.github.io/#meklon.png
Below you can see repeating horizontal stripes - formants , by the position of which vowels are recognized. At the top - vertical “bursts” corresponding to noisy consonants : wider - slotted (fricative), narrower - vocal. As for the sonorous consonants ([r] and [l]), “clouds” in the middle frequencies correspond.

In order to play with the spectrogram, I attached a primitive drawing, almost entirely copied from the canvas drawing tutorial . The “Copy” button allows you to transfer the image to the red channel (it is ignored by the synthesizer) and try to “circle” the sounds.
Wikipedia writes: “It is believed that the allocation of four formants is sufficient to characterize the sounds of speech . ” We circle the formants F 2 -F 4 (for some reason F 1 is ignored by the synthesizer), and make sure that the vowels are fully recognized:

Then we circle the noisy consonants: the affricate [h] is [t], smoothly passing into [w]; and voiced [d] from deaf [t] is distinguished by the presence of mid-frequency formants. Now you can distinguish between the numbers "six" and "de'it":

We add dark gray sonor consonants: at the same time, note that [p] slightly “raises” the vowel formants, and [l] - on the contrary, omits.

Only the labial consonants [b] and [c] remained undeveloped, but even without them the password is more or less clear .
Is it possible to draw sound from scratch without tracing the spectrogram of the audio recording? Frankly, I did not succeed. Maybe you want to try it yourself?
All Articles