Retentioneering: how we open-source product analytics tools in Python and Pandas wrote
Hello, Habr. This article is devoted to the results of a four-year development of a set of methods and tools for processing user paths in an application or on a site. The author of the development is Maxim Godzi , who is at the head of the team of creators of the product, he is also the author of the article. The product itself is called Retentioneering, now it is transformed into an open-source library and posted on Github, so that anyone can use it. All this may be of interest to those associated with product and marketing analysis, product promotion and development. By the way, an article was published on Habré about one of the cases of working with Retentioneering . The new material talks about what the product is capable of and how it can be used.
After reading the article, you yourself can write your Retentioneering, it can be any standardized method for processing user trajectories in the application and beyond, allowing you to see in detail the behavior and extract insights from it for the growth of business metrics.
Initially, our goal was to transfer Growth Hacking from the world of "digital medicine" to the world of numbers, analytics and forecasts. As a result, reducing product analytics to pure mathematics and programming is for those who prefer numbers instead of science fiction stories and formulas to clever words like “rebranding”, “repositioning”, etc. that sound beautiful, but in practice help a little.
To solve these problems, we needed a framework for analytics through graphs and trajectories, and at the same time a library that simplifies typical analytic routines, as a way to describe regular product analytics tasks that would be understandable to both people and robots. The library provides an opportunity to describe user behavior and associate it with product business metrics in such a formal and clear language to simplify and automate the routine tasks of developers and analysts, and facilitate their communication with the business.
Retentioneering is a method and analytical software tools that can be adapted and integrated into any digital (and not only) product.
We started work on the product in 2015. Now this is a ready-made, although not yet ideal, set of tools in Python and Pandas for working with data, machine learning models with sklearn-like api, tools for interpreting the results of eli5 and shap machine learning models.
All this is wrapped in a convenient open-source library in the Github open repository - retentioneering-tools . Using the library is easy, almost any person who loves product analytics, but has not written code before, can apply our analytics methods to their data on their own and without a significant investment of time.
Well, a programmer, application creator or a member of a development or testing team who has never before been involved in analytics can start playing with this code and see patterns of using his application without any outside help.
User trajectory - a sequence of user states at specific time points. Moreover, events can be from different data sources, both online and offline. Events that happen to the user are part of his trajectory. Examples:
• pressed the button
• saw a picture
• hit the screen
• received an email
• recommended the product to a friend
• filled out the form
• taped screen
• scrolled
• went to the checkout
• ordered a burrito
• ate a burrito
• poisoned by eaten burritos
• entered the cafe from the back door
• came in from the front door
• minimized the application
• received a push notification
• stupid on the screen for longer time X
• paid for the order
• bought an order
• was denied a loan
If you take the data of the trajectories of a user group and study how transitions are arranged, you can trace how their behavior is built in the application. This is conveniently done through a graph in which states are nodes, and transitions between states are edges:

"Trajectory" is a very convenient concept - it contains detailed information about all user actions, with the possibility of adding any additional data to the description of these actions. This makes it a universal object. If you have beautiful and convenient tools that allow you to work with paths, then you can find similarities, segment them.
Segmentation of trajectories at first may seem like something very complicated. In a normal situation, this is the case - you need to use a comparison of connection matrices or sequence alignment. We managed to find an easier way - to study a large number of trajectories and segment them through clustering.
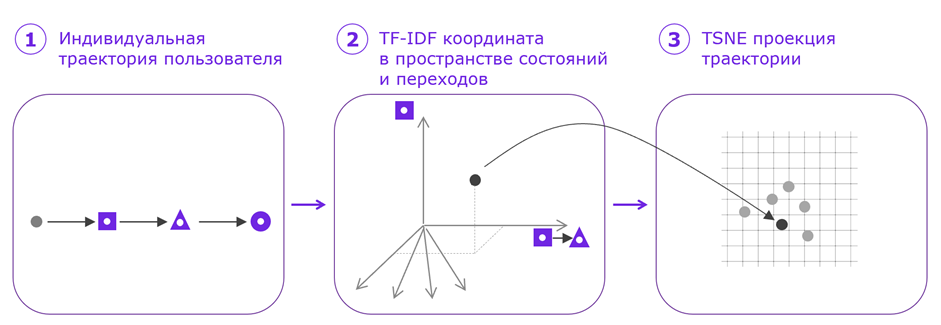
As it turned out, you can turn the trajectory into a point using continuous representations, for example, TF-IDF . After the transformation, the trajectory becomes a point in space, where the normalized occurrence in the trajectory of various events and transitions between them is plotted along the axes. This thing from a huge thousand- and more-dimensional space (dimS = sum (event types) + sum (ngrams_2 types)) can be projected onto a plane using TSNE . TSNE - transformation, reduces the dimension of space to 2 axes and, if possible, maintains the relative distances between points. Accordingly, it becomes possible on a flat map, a figurative projection map of trajectories, to study how the points of different trajectories were arranged among themselves. It is analyzed how close or different they were to each other, whether they formed clusters or scattered along the map, etc .:
Retentioneering analytic tools make it possible to turn an array of complex data and trajectories into a presentation that can be compared with each other, and then examine and interpret the result of the transformation.
Speaking about the standard methods of processing the trajectory, we mean the three main tools that we implemented in Retentioneering - graphs, step matrices, and projection map maps.
Working with Google Analytics, Firebase and similar analytics systems is quite complicated and not 100% effective. The problem is a number of restrictions for the user, as a result of which the analyst’s work rests in such systems with mouse clicks and selection of slices. Retentioneering makes it possible to work with user paths, and not just funnels, as in Google Analytics, where the level of detail often comes down to a funnel, albeit built for a certain segment.
An example of using the developed tool is the case of a large niche service in Russia. This company has a mobile application for Android, which is popular with customers. The annual turnover from a mobile application amounted to about 7 million rubles, seasonal fluctuations in the range of 60-130 thousand. The same company has an iOS application, and the average check of a user of the "apple" application was higher than the average check of a client using an Android application - 1,080 rub. against 1300 rub.
The company decided to increase the efficiency of the Android application, for which it conducted a thorough analysis. Several dozen hypotheses were formed about increasing the effectiveness of the application. After using Retentionneering, it turned out that the problem was in messages that were shown to new users. They received information about the brand, company benefits and pricing. But, as it turned out, the messages were supposed to help the user learn how to work in the application.
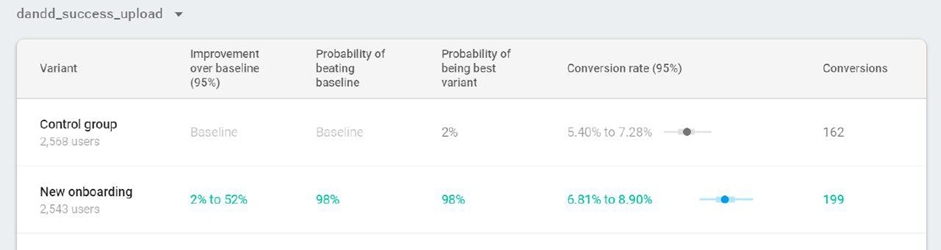
This was done, as a result of which the application began to be deleted less, and the increase in conversion in the order was 23%. Initially, 20 percent of the incoming traffic was given for the test, but after a few days, after analyzing the first results and evaluating the trend, they changed the proportions and, on the contrary, left 20 percent for the control group, and eighty were put into the test. A week later, it was decided to consistently add testing of two more hypotheses. In just seven weeks, the turnover from the Android application increased one and a half times compared to the previous level.
The first steps are quite simple - load the library with the pip install retentioneering command. The repository itself contains ready-made examples and data processing cases for some product analytics tasks. The set is constantly updated, while it is enough for the first acquaintance. Everyone can take ready-made modules and immediately apply to their tasks - this allows you to immediately configure the process of more detailed analysis and optimization of user paths as quickly and efficiently as possible. All this makes it possible to find patterns for using the application through clear code and share this experience with colleagues.
Retentioneering is a tool that should be used throughout the life of the application, and here's why:
Overall, Retentioneering is an effective tool. But there is no limit to perfection - it can and should be improved, developed, built on its basis new cool products. The more active the project community is, the more forks there will be, new interesting options for its use will appear.
Additional information about Retentioneering tools:
After reading the article, you yourself can write your Retentioneering, it can be any standardized method for processing user trajectories in the application and beyond, allowing you to see in detail the behavior and extract insights from it for the growth of business metrics.
What is Retentioneering and why is it needed?
Initially, our goal was to transfer Growth Hacking from the world of "digital medicine" to the world of numbers, analytics and forecasts. As a result, reducing product analytics to pure mathematics and programming is for those who prefer numbers instead of science fiction stories and formulas to clever words like “rebranding”, “repositioning”, etc. that sound beautiful, but in practice help a little.
To solve these problems, we needed a framework for analytics through graphs and trajectories, and at the same time a library that simplifies typical analytic routines, as a way to describe regular product analytics tasks that would be understandable to both people and robots. The library provides an opportunity to describe user behavior and associate it with product business metrics in such a formal and clear language to simplify and automate the routine tasks of developers and analysts, and facilitate their communication with the business.
Retentioneering is a method and analytical software tools that can be adapted and integrated into any digital (and not only) product.
We started work on the product in 2015. Now this is a ready-made, although not yet ideal, set of tools in Python and Pandas for working with data, machine learning models with sklearn-like api, tools for interpreting the results of eli5 and shap machine learning models.
All this is wrapped in a convenient open-source library in the Github open repository - retentioneering-tools . Using the library is easy, almost any person who loves product analytics, but has not written code before, can apply our analytics methods to their data on their own and without a significant investment of time.
Well, a programmer, application creator or a member of a development or testing team who has never before been involved in analytics can start playing with this code and see patterns of using his application without any outside help.
User trajectory as a basic element of analysis and methods for its processing
User trajectory - a sequence of user states at specific time points. Moreover, events can be from different data sources, both online and offline. Events that happen to the user are part of his trajectory. Examples:
• pressed the button
• saw a picture
• hit the screen
• received an email
• recommended the product to a friend
• filled out the form
• taped screen
• scrolled
• went to the checkout
• ordered a burrito
• ate a burrito
• poisoned by eaten burritos
• entered the cafe from the back door
• came in from the front door
• minimized the application
• received a push notification
• stupid on the screen for longer time X
• paid for the order
• bought an order
• was denied a loan
If you take the data of the trajectories of a user group and study how transitions are arranged, you can trace how their behavior is built in the application. This is conveniently done through a graph in which states are nodes, and transitions between states are edges:
"Trajectory" is a very convenient concept - it contains detailed information about all user actions, with the possibility of adding any additional data to the description of these actions. This makes it a universal object. If you have beautiful and convenient tools that allow you to work with paths, then you can find similarities, segment them.
Segmentation of trajectories at first may seem like something very complicated. In a normal situation, this is the case - you need to use a comparison of connection matrices or sequence alignment. We managed to find an easier way - to study a large number of trajectories and segment them through clustering.
As it turned out, you can turn the trajectory into a point using continuous representations, for example, TF-IDF . After the transformation, the trajectory becomes a point in space, where the normalized occurrence in the trajectory of various events and transitions between them is plotted along the axes. This thing from a huge thousand- and more-dimensional space (dimS = sum (event types) + sum (ngrams_2 types)) can be projected onto a plane using TSNE . TSNE - transformation, reduces the dimension of space to 2 axes and, if possible, maintains the relative distances between points. Accordingly, it becomes possible on a flat map, a figurative projection map of trajectories, to study how the points of different trajectories were arranged among themselves. It is analyzed how close or different they were to each other, whether they formed clusters or scattered along the map, etc .:
Retentioneering analytic tools make it possible to turn an array of complex data and trajectories into a presentation that can be compared with each other, and then examine and interpret the result of the transformation.
Speaking about the standard methods of processing the trajectory, we mean the three main tools that we implemented in Retentioneering - graphs, step matrices, and projection map maps.
Working with Google Analytics, Firebase and similar analytics systems is quite complicated and not 100% effective. The problem is a number of restrictions for the user, as a result of which the analyst’s work rests in such systems with mouse clicks and selection of slices. Retentioneering makes it possible to work with user paths, and not just funnels, as in Google Analytics, where the level of detail often comes down to a funnel, albeit built for a certain segment.
Retentioneering and cases
An example of using the developed tool is the case of a large niche service in Russia. This company has a mobile application for Android, which is popular with customers. The annual turnover from a mobile application amounted to about 7 million rubles, seasonal fluctuations in the range of 60-130 thousand. The same company has an iOS application, and the average check of a user of the "apple" application was higher than the average check of a client using an Android application - 1,080 rub. against 1300 rub.
The company decided to increase the efficiency of the Android application, for which it conducted a thorough analysis. Several dozen hypotheses were formed about increasing the effectiveness of the application. After using Retentionneering, it turned out that the problem was in messages that were shown to new users. They received information about the brand, company benefits and pricing. But, as it turned out, the messages were supposed to help the user learn how to work in the application.
This was done, as a result of which the application began to be deleted less, and the increase in conversion in the order was 23%. Initially, 20 percent of the incoming traffic was given for the test, but after a few days, after analyzing the first results and evaluating the trend, they changed the proportions and, on the contrary, left 20 percent for the control group, and eighty were put into the test. A week later, it was decided to consistently add testing of two more hypotheses. In just seven weeks, the turnover from the Android application increased one and a half times compared to the previous level.
How to work with retentioneering?
The first steps are quite simple - load the library with the pip install retentioneering command. The repository itself contains ready-made examples and data processing cases for some product analytics tasks. The set is constantly updated, while it is enough for the first acquaintance. Everyone can take ready-made modules and immediately apply to their tasks - this allows you to immediately configure the process of more detailed analysis and optimization of user paths as quickly and efficiently as possible. All this makes it possible to find patterns for using the application through clear code and share this experience with colleagues.
Retentioneering is a tool that should be used throughout the life of the application, and here's why:
- Retentioneering is effective for tracking and continuously optimizing user paths and improving business performance. So, in ecommerce applications often add new features whose effect on the product can not always be predicted correctly. In some cases, compatibility problems arise between new and old functions - for example, new ones “cannibalize” existing ones. And in this situation, a constant analysis of the trajectories is needed.
- The situation with advertising channels is similar: new traffic sources and advertising creatives are constantly being tested, it is necessary to monitor seasonality, trends and the influence of other events, which leads to the emergence of new classes of problems. It also requires constant monitoring and interpretation of custom mechanics.
- There are a number of factors that constantly affect the operation of an application. For example, new releases from developers: closing an actual problem, they unwittingly return the old one or create a completely new one. Over time, the number of new releases is growing, and the process of tracking bugs needs to be automated - including through analysis of user trajectories.
Overall, Retentioneering is an effective tool. But there is no limit to perfection - it can and should be improved, developed, built on its basis new cool products. The more active the project community is, the more forks there will be, new interesting options for its use will appear.
Additional information about Retentioneering tools:
- Our website: retentioneering.com
- Schedule of meetings and registration for participation
- Telegram Product and Analyst Chat
- Free Retentioneering Repository on GitHub
All Articles