Improving Zabbix + PostgreSQL Performance with Partitioning and Indexing
About a year ago, my colleagues and I were tasked with sorting out using the popular network infrastructure monitoring system - Zabbix. After studying the documentation, we immediately proceeded to load testing: we wanted to evaluate how many parameters Zabbix can work without noticeable performance drops. Only PostgreSQL was used as the DBMS.
During the tests, some architectural features of the database layout and the behavior of the monitoring system itself were identified, which by default do not allow the monitoring system to reach its maximum power. As a result, some optimization measures were developed, conducted, and tested mainly in terms of tuning the database.
I want to share the results of the work done in this article. This article will be useful for both Zabbix and PostgreSQL DBA administrators, as well as for everyone who wants to better understand and understand the popular PosgreSQL DBMS.
A small spoiler: on a weak machine with a load of 200 thousand parameters per minute, we managed to reduce the CPU iowait from 20% to 2%, reduce the recording time in portions to primary tables by 250 times and to aggregated data tables by 32 times, reduce the size of indexes 5-10 times and accelerate the acquisition of historical samples in some cases up to 18 times.
Load testing was carried out according to the scheme: one Zabbix server, one active Zabbix proxy, two agents. Each agent was configured to give 50 tons of integer and 50 tons of string parameters per minute (for a total of 200 agents, 200 tons of parameters per minute or 3333 parameters per second). To generate agent parameters we used a plug-in for Zabbix. To check how many parameters an agent can generate, you need to use a special script from the same plug-in author zabbix_module_stress . Zabbix web-admin has difficulties registering large templates, so we divided the parameters into 20 templates with 5 tons of parameters (2500 numeric and 2500 string).
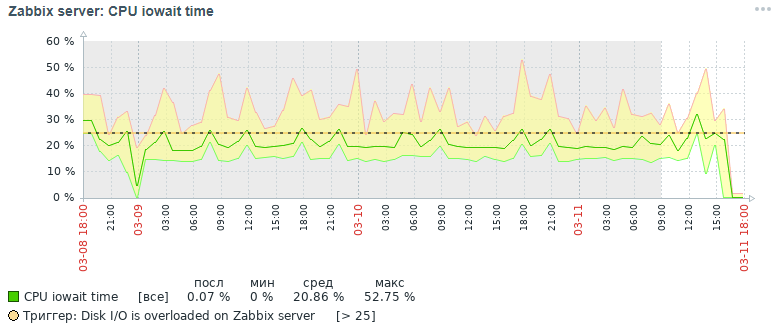
The cpu iostat metric is a good indicator of Zabbix performance - it reflects the fraction of the unit of time during which the processor expects access to the disk. The higher it is, the more the disk is occupied with read and write operations, which indirectly affects the performance degradation of the monitoring system as a whole. Those. this is a sure sign that something is wrong with the monitoring. By the way, on the open spaces of the network, the quite popular question is “how to remove the iostat trigger in Zabbix”, so this is a painful topic, because there are many reasons for increasing the value of the iowait metric.
Here's what picture for the cpu iowait metric we got three days later initially:
But what picture for the same metric we also got within three days in the end after all the optimization measures that have been done, which will be discussed below:
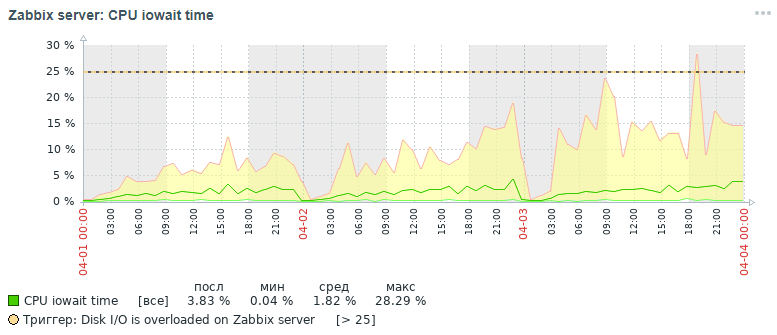
As can be seen from the graphs, the cpu iowait indicator fell from almost 20% to 2%, which indirectly accelerated the execution time of all requests for adding and reading data. Now let's see why, with standard database settings, the overall performance of the monitoring system drops and how to fix it.
With the accumulation of more than 10 million parameter values in each table of primary data, it was noticed that the performance of the monitoring system drops sharply, due to the following reasons:
The situation is aggravated at the beginning of each hour, when in addition to this, aggregated hourly statistics are calculated - at the same time, active reading and writing of index pages from disk, deletion of outdated data from the history is performed, which leads to the same result - a drop in database performance and an increase in execution time requests (in the limit, a request lasting up to 5 minutes was noted!).
A little help on organizing a monitoring data warehouse in Zabbix. It stores primary data and aggregated data in different tables, moreover, with the separation of the types of parameters. Each table stores an itemid field (an implicit reference to a registered data item in the system), a timestamp for registering the clock value in unix timestamp format (milliseconds in a separate column) and a value in a separate column (the exception is the log table, it has more fields - it’s like an event log ):
To improve the performance of the PostgreSQL database, various optimization measures were carried out, the main of which are partitioning and changing indexes. However, it is worth mentioning a few words about a few important and useful measures that can speed up the work of any database under the PostgreSQL database management system.
Important notice. At the time of collecting the material of the article, we used Zabbix version 4.0, although version 4.2 has already been released and version 4.4 is being prepared for release. Why is it important to mention this? Because starting from version 4.2, Zabbix began to support a special powerful extension for working with TimescaleDB time series, but so far in experimental mode: for all the advantages of using this extension, it is believed that some requests began to work more slowly and there are still unsolved performance problems (there will be resolved in version 4.4) - read this article . In the next article I plan to write about the results of load testing already using the TimescaleDB extension in comparison with this solution case. The version of PostgreSQL was used 10, but all the information given is relevant for versions 11 and 12 (we are waiting!).
Therefore, first things first:
In fact, PostgreSQL is a fairly lightweight DBMS. Its default configuration file is configured so that, as my colleague says, “even work on the coffee machine”, i.e. on a very modest iron. Therefore, it is necessary to configure PostgreSQL for the server configuration, taking into account the amount of memory, the number of processors, the type of intended use of the database, the type of disk (HDD or SSD) and the number of connections.
Alas, there is no single formula for tuning all DBMSs, but there are certain rules and patterns that are suitable for most configurations (finer tuning is already the work of an expert). To simplify the life of DBA, the pgtune utility was written, which was supplemented by the web version by le0pard , the author of an interesting and useful book on PostgreSQL administration.
An example of running the utility in the console with 100 connections (Zabbix has a demanding Web admin) for the “Data warehouses” application type:
This item is optional and is rather a transitional decision on the way to a fully-fledged distributed cluster, but it will be useful to know about this possibility. To speed up the database, you can put it on a separate disk. We mounted the entire disk in the base directory, where all PostgreSQL databases are stored, but in general it can be done differently: create a new tablesbase and transfer the database (or even only part of it - the tables of primary and aggregated monitoring data) to this tablesbase on a separate disk.
One of the problems that we encountered during stress testing of Zabbix - PostgreSQL does not manage to delete obsolete data from the database. With the help of partitioning, you can divide the table into its constituent parts, thereby reducing the size of the indexes and constituent parts of the supertable, which positively affects the speed of the database as a whole.
Partitioning solves two problems at once:
1. accelerate the removal of obsolete data by deleting entire tables
2. splitting indices for each composite table
There are four mechanisms for partitioning in PostgreSQL:
1.standard constraint_exclusion
2. extension pg_partman ( do not confuse with pg_pathman )
3. extension pg_pathman
4. manually create and maintain partitions by ourselves
The most convenient, reliable and optimized partitioning solution, in our opinion, is the pg_pathman extension. With this partitioning method, the query planner flexibly determines in which partitions to search for data. Rumor has it that in the 12th version of PostgreSQL there will be an excellent partition already out of the box.
Thus, we began to write monitoring data for each day in a separate inherited table from the super table and the removal of obsolete parameter values began to occur through the removal of all obsolete tables at once, which is much easier for a DBMS by labor costs. Deletion was done by calling the user-defined function of the database as a monitoring parameter of the Zabbix server at 2 a.m. with an indication of the permissible range of statistics storage.
Special thanks to erogov for the excellent series of overview articles on PostgreSQL indexes . And indeed the entire PostgresPRO team.Impressed by these articles, we played around with different types of indexes on the monitoring data tables and came to the conclusion which types of indexes on which fields will give the maximum performance boost.
It was noticed that the composite index btree (itemid, clock) is created by default on all tables of monitoring data - it is fast for searching, especially for monotonously ordered values, but it “swells” on the disk when there is a lot of data - more than 10 million.
On the tables By default hourly aggregated statistics, a unique index is generally created, although these tables for data storage and uniqueness are provided here at the application server level, and a unique index only slows down data insertion.
During testing of various indices, the most successful combination of indices was revealed: the brin index on the clock field and the btree-gin index on the itemid field for all tables of monitoring data.
The brin index is ideal for monotonically increasing data, such as the timestamp of the fact of an event, i.e. for time series. And the btree-gin index is essentially a gin index over standard data types, which is generally much faster than the classic btree index because gin index is not rebuilt during the addition of new values, but only supplemented by them. The btree-gin index is put as an extension to PostgreSQL.
A comparison of the sampling speed for this indexing strategy and for indexes in the Zabbix database by default is given below. During stress tests, we accumulated data for three days for three partitions:
To evaluate the results, three types of queries were performed:
The test results were tabulated below:
* the size in MB is indicated in total for three partitions
** type 1 request - data for 3 days, type 2 request - data for 12 hours, type 3 request - data for one hour
From the comparison table it can be seen that for large data tables with the number of records more than 100 million, it is clearly seen that changing the standard composite index btree to two indices brin and btree-gin has a beneficial effect on reducing the size of indexes and speeding up query execution time.
The effectiveness of indexing and partitioning is shown below on the example of a request to add new records to the history_uint and trends_uint tables (additions occur on average 2000 values per query).
Summarizing the results of tests of various index configurations for zabbix system monitoring data tables, we can say that a similar change in the standard index for zabbix system monitoring data tables positively affects the overall system performance, which is most felt when data volumes are accumulated in the amount of 10 million or more. you should forget about the indirect effect of "swelling" of the standard btree index by default - frequent rebuilds of the multi-gigabyte index leads to heavy load of the hard disk (utiliz metric ation), which ultimately increases the time of disk operations and the latency of access to the disk by the CPU (iowait metric).
But, so that the btree-gin index can work with the bigint (in8) data type, which is the itemid column, you need to register a family of bigint operators for the btree-gin index.
For the brin index for our data volume at an intensity of 100 tons of parameters per minute (100 tons in history and 100 tons in history_uint), it was noticed that on the tables of primary monitoring data, the index works twice as fast with a zone size of 512 pages than with the standard size of 128 pages, but this is individual and depends on the size of the tables and server configuration. In any case, the brin index takes up very little space, but its speed can be slightly increased by fine-tuning the size of the zone, but provided that the data flow rate does not change much.
As a result, it is worth noting that there is a limitation associated with the architecture of Zabbix itself: on the tab “Recent data”, the last two values for each parameter are collected taking into account filtering. For each parameter, values are requested in the database separately. Therefore, the more such parameters are selected, the longer the query will run. The most recent data is searched when the btree index (itemid, clock desc) is set on history tables with reverse sorting by time, but at the same time, the index itself of course “swells” on the disk and generally indirectly slows down the database, which causes a problem, described above.
Therefore, there are three ways out:
Pg_stat_statements is an extension for collecting statistics on query performance across the entire server. The advantage of this extension is that it does not need to collect and parse PostgreSQL logs.
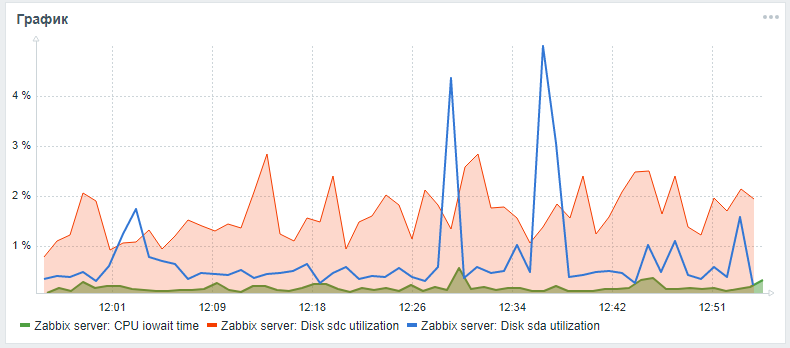
To monitor hard drives in Zabbix, only the vfs.dev.read and vfs.dev.write parameters are provided out of the box. These options do not provide information about disk utilization. Useful criteria for finding problems with the performance of your hard drives are utilization factor, await query time, and disk load queue load.
As a rule, high disk load correlates with high iowait of cpu itself and with an increase in the execution time of sql queries, which was found during load testing of a zabbix server with a standard configuration without partitioning and without setting up alternative indexes. You can add these monitoring parameters for hard drives using the following steps, which were peeped in an article from a friendlesovsky and improved: now iostat parameters are collected separately for each disk into a json temporary parameter, from where, according to the post-processing settings, they are already decomposed into the final monitoring parameters.
While the Pull request is pending, you can try to deploy monitoring of disk parameters according to the detailed instructions through my fork .
After all the described actions, you can add a custom graph with iowait cpu and utiliztion parameters for the system disk and the disk from the database (if they are different) to the main Zabbix server monitoring panel. The result may look like this (sda is the main disk, sdc is the disk with the database):
After setting up the DBMS, indexing and partitioning, you can proceed to vertical scaling - to improve the hardware characteristics of the server: add RAM, change drives to solid-state and add processor cores. This is a guaranteed performance increase, but it is better to do this only after software optimization.
After moderate vertical scaling, you need to start horizontal - create a distributed cluster: either shard or replicate the master slave. But this is a separate topic and material of a separate article(how to mold a cluster of shit and sticks) , as well as a comparison of the above described Zabbix database optimization technique using pg_pathman and indexing with the method of applying the TimescaleDB extension.
In the meantime, one can only hope that the material in this article turned out to be useful and informative!
During the tests, some architectural features of the database layout and the behavior of the monitoring system itself were identified, which by default do not allow the monitoring system to reach its maximum power. As a result, some optimization measures were developed, conducted, and tested mainly in terms of tuning the database.
I want to share the results of the work done in this article. This article will be useful for both Zabbix and PostgreSQL DBA administrators, as well as for everyone who wants to better understand and understand the popular PosgreSQL DBMS.
A small spoiler: on a weak machine with a load of 200 thousand parameters per minute, we managed to reduce the CPU iowait from 20% to 2%, reduce the recording time in portions to primary tables by 250 times and to aggregated data tables by 32 times, reduce the size of indexes 5-10 times and accelerate the acquisition of historical samples in some cases up to 18 times.
Stress Testing
Load testing was carried out according to the scheme: one Zabbix server, one active Zabbix proxy, two agents. Each agent was configured to give 50 tons of integer and 50 tons of string parameters per minute (for a total of 200 agents, 200 tons of parameters per minute or 3333 parameters per second). To generate agent parameters we used a plug-in for Zabbix. To check how many parameters an agent can generate, you need to use a special script from the same plug-in author zabbix_module_stress . Zabbix web-admin has difficulties registering large templates, so we divided the parameters into 20 templates with 5 tons of parameters (2500 numeric and 2500 string).
Script generator template for load testing in python
import argparse """ . 20 5000 ( 2500 : echo, ; ping, ) """ TEMP_HEAD = """ <?xml version="1.0" encoding="UTF-8"?> <zabbix_export> <version>2.0</version> <date>2015-08-17T23:15:01Z</date> <groups> <group> <name>Templates</name> </group> </groups> <templates> <template> <template>Template Zabbix Srv Stress {count} passive {char}</template> <name>Template Zabbix Srv Stress {count} passive {char}</name> <description/> <groups> <group> <name>Templates</name> </group> </groups> <applications/> <items> """ TEMP_END = """</items> <discovery_rules/> <macros/> <templates/> <screens/> </template> </templates> </zabbix_export> """ TEMP_ITEM = """<item> <name>{k}</name> <type>0</type> <snmp_community/> <multiplier>0</multiplier> <snmp_oid/> <key>{k}</key> <delay>1m</delay> <history>3</history> <trends>365</trends> <status>0</status> <value_type>{t}</value_type> <allowed_hosts/> <units/> <delta>0</delta> <snmpv3_contextname/> <snmpv3_securityname/> <snmpv3_securitylevel>0</snmpv3_securitylevel> <snmpv3_authprotocol>0</snmpv3_authprotocol> <snmpv3_authpassphrase/> <snmpv3_privprotocol>0</snmpv3_privprotocol> <snmpv3_privpassphrase/> <formula>1</formula> <delay_flex/> <params/> <ipmi_sensor/> <data_type>0</data_type> <authtype>0</authtype> <username/> <password/> <publickey/> <privatekey/> <port/> <description/> <inventory_link>0</inventory_link> <applications/> <valuemap/> <logtimefmt/> </item> """ TMP_FNAME_DEFAULT = "Template_App_Zabbix_Server_Stress_{count}_passive_{char}.xml" chars = "ABCDEFGHIJKLMNOPQRSTUVWXYZ" if __name__ == "__main__": parser = argparse.ArgumentParser( description=' zabbix') parser.add_argument('--items', dest='items', type=int, default=1000, help='- (default: 1000)') parser.add_argument('--templates', dest='templates', type=int, default=1, help=f'- [1-{len(chars)}] (default: 1)') args = parser.parse_args() items_count = args.items tmps_count = args.templates if not (tmps_count >= 1 and tmps_count <= len(chars)): sys.exit(f"Templates must be in range 1 - {len(chars)}") for i in range(tmps_count): fname = TMP_FNAME_DEFAULT.format(count=items_count, char=chars[i]) with open(fname, "w") as output: output.write(TEMP_HEAD.format(count=items_count, char=chars[i])) for k,t in [('stress.ping[{}-I-{:06d}]',3), ('stress.echo[{}-S-{:06d}]',4)]: for j in range(int(items_count/2)): output.write(TEMP_ITEM.format(k=k.format(chars[i],j),t=t)) output.write(TEMP_END)
The cpu iostat metric is a good indicator of Zabbix performance - it reflects the fraction of the unit of time during which the processor expects access to the disk. The higher it is, the more the disk is occupied with read and write operations, which indirectly affects the performance degradation of the monitoring system as a whole. Those. this is a sure sign that something is wrong with the monitoring. By the way, on the open spaces of the network, the quite popular question is “how to remove the iostat trigger in Zabbix”, so this is a painful topic, because there are many reasons for increasing the value of the iowait metric.
Here's what picture for the cpu iowait metric we got three days later initially:
But what picture for the same metric we also got within three days in the end after all the optimization measures that have been done, which will be discussed below:
As can be seen from the graphs, the cpu iowait indicator fell from almost 20% to 2%, which indirectly accelerated the execution time of all requests for adding and reading data. Now let's see why, with standard database settings, the overall performance of the monitoring system drops and how to fix it.
Reasons for Zabbix Performance Drop
With the accumulation of more than 10 million parameter values in each table of primary data, it was noticed that the performance of the monitoring system drops sharply, due to the following reasons:
- the iowait metric for the server CPU is increased by more than 20%, which indicates an increase in the time during which the CPU expects access to disk read and write operations
- indexes of tables in which monitoring data are greatly inflated
- the utilization metric is increased to 100% for a disk with monitoring data, which indicates that the disk is fully loaded with read and write operations
- obsolete values do not have time to be deleted from the history tables when cleaning according to the schedule of housekeeper
The situation is aggravated at the beginning of each hour, when in addition to this, aggregated hourly statistics are calculated - at the same time, active reading and writing of index pages from disk, deletion of outdated data from the history is performed, which leads to the same result - a drop in database performance and an increase in execution time requests (in the limit, a request lasting up to 5 minutes was noted!).
A little help on organizing a monitoring data warehouse in Zabbix. It stores primary data and aggregated data in different tables, moreover, with the separation of the types of parameters. Each table stores an itemid field (an implicit reference to a registered data item in the system), a timestamp for registering the clock value in unix timestamp format (milliseconds in a separate column) and a value in a separate column (the exception is the log table, it has more fields - it’s like an event log ):
| Table name | Appointment | Data type |
|---|---|---|
| history | Primary Monitoring Data | numeric (16.4) |
| history_uint | Primary Monitoring Data | numeric (20.0) |
| history_str | Primary Monitoring Data | varchar (255) |
| history_text | Primary Monitoring Data | text |
| history_logs | Primary Monitoring Data | text and int fields |
| trends | Aggregated Monitoring Data | numeric (16.4) |
| trends_uint | Aggregated Monitoring Data | numeric (20.0) |
Optimization Activities
To improve the performance of the PostgreSQL database, various optimization measures were carried out, the main of which are partitioning and changing indexes. However, it is worth mentioning a few words about a few important and useful measures that can speed up the work of any database under the PostgreSQL database management system.
Important notice. At the time of collecting the material of the article, we used Zabbix version 4.0, although version 4.2 has already been released and version 4.4 is being prepared for release. Why is it important to mention this? Because starting from version 4.2, Zabbix began to support a special powerful extension for working with TimescaleDB time series, but so far in experimental mode: for all the advantages of using this extension, it is believed that some requests began to work more slowly and there are still unsolved performance problems (there will be resolved in version 4.4) - read this article . In the next article I plan to write about the results of load testing already using the TimescaleDB extension in comparison with this solution case. The version of PostgreSQL was used 10, but all the information given is relevant for versions 11 and 12 (we are waiting!).
Therefore, first things first:
- setting up a configuration file using pgtune utility
- putting the database to a separate physical disk
- partitioning history tables with pg_pathman
- changing index types of history tables to brin (clock) and btree-gin (itemid)
- collection and analysis of query execution statistics pg_stat_statements
- setting physical disk monitoring parameters
- hardware performance improvement
- creation of a distributed cluster (material beyond the scope of this article)
Configuring a configuration file using pgtune utility
In fact, PostgreSQL is a fairly lightweight DBMS. Its default configuration file is configured so that, as my colleague says, “even work on the coffee machine”, i.e. on a very modest iron. Therefore, it is necessary to configure PostgreSQL for the server configuration, taking into account the amount of memory, the number of processors, the type of intended use of the database, the type of disk (HDD or SSD) and the number of connections.
Alas, there is no single formula for tuning all DBMSs, but there are certain rules and patterns that are suitable for most configurations (finer tuning is already the work of an expert). To simplify the life of DBA, the pgtune utility was written, which was supplemented by the web version by le0pard , the author of an interesting and useful book on PostgreSQL administration.
An example of running the utility in the console with 100 connections (Zabbix has a demanding Web admin) for the “Data warehouses” application type:
pgtune -i postgresql.conf -o new_postgresql.conf -T DW -c 100
The configuration parameters that the pgtune utility changes with a description of the purpose (values are given as an example)
 # DB Version: 11
 # OS Type: linux
 # DB Type: web
 # Total Memory (RAM): 8 GB
 # CPUs num: 1
 # Connections num: 100
 # Data Storage: hdd

 max_connections = 100 # maximum number of simultaneous database connections
 shared_buffers = 2GB # memory size for various buffers (mainly cache of table blocks and indexes) in shared memory
 effective_cache_size = 6GB # maximum size of required memory for query execution using indexes
 maintenance_work_mem = 512MB # affects the speed of operations VACUUM, ANALYZE, CREATE INDEX
 checkpoint_completion_target = 0.7 # target time to complete the checkpoint procedure
 wal_buffers = 16MB # amount of memory used by Shared Memory to maintain transaction logs
 default_statistics_target = 100 # amount of statistics collected by the ANALYZE command - when increasing, the optimizer builds queries more slowly, but better
 random_page_cost = 4 # conditional cost of index access to data pages - affects the decision to use the index
 effective_io_concurrency = 2 # number of asynchronous I / O operations that the DBMS will try to perform in a separate session
 work_mem = 10485kB # amount of memory used for sorting and hash tables before temporary files on disk are used
 min_wal_size = 1GB # limits below the number of WAL files that will be recycled for future use
 max_wal_size = 2GB # limits the number of WAL files that will be recycled for future use
Some useful postgresql configuration options
 # managing concurrent request handlers
 max_worker_processes = 8 # maximum number of background processes - at least one per database
 max_parallel_workers_per_gather = 4 # maximum number of parallel processes within a single request
 max_parallel_workers = 8 # the maximum number of work processes that the system can support for parallel operations

 # logging settings (an easy way to find out about the execution time of requests without using the pg_stat_statements extension)
 log_min_duration_statement = 3000 # write to the logs the duration of the execution of all commands whose operating time> = of the specified value in ms
 log_duration = off # record the duration of each completed command
 log_statement = 'none' # which SQL commands to write to the log, values: none (disabled), ddl, mod and all (all commands)
 debug_print_plan = off # output of the query plan tree for further analysis

 # squeeze the maximum out of the database and be ready to receive it for any failure (for the most repressed, who ignore the existence of ssd and a distributed cluster)
 #fsync = off # physical write to the changes disk, disabling fsync gives a speed gain, but can lead to permanent failures
 #synchronous_commit = off # allows you to respond to the client even before the transaction information is in the WAL - an almost safe alternative to disabling fsync
 #full_page_writes = off # shutdown speeds up normal operations, but can lead to data corruption or data corruption if the system crashes
Listing a database on a separate physical disk
This item is optional and is rather a transitional decision on the way to a fully-fledged distributed cluster, but it will be useful to know about this possibility. To speed up the database, you can put it on a separate disk. We mounted the entire disk in the base directory, where all PostgreSQL databases are stored, but in general it can be done differently: create a new tablesbase and transfer the database (or even only part of it - the tables of primary and aggregated monitoring data) to this tablesbase on a separate disk.
Mount example
First you need to format the disk with the ext4 file system and connect it to the server. Mount the disk for the database with the noatime label:
For permanent mounting, add the line to the / etc / fstab file:
mount / dev / sdc1 / var / lib / pgsql / 10 / data / base -o noatime
For permanent mounting, add the line to the / etc / fstab file:
 # where UUID is the identifier of the disk, you can see it using the blkid utility
 UUID = 121efe29-70bf-410b-bc71-90704568ce3b / var / lib / pgsql / 10 / data / base ext4 defaults, noatime 0 0
Partitioning history tables with pg_pathman
One of the problems that we encountered during stress testing of Zabbix - PostgreSQL does not manage to delete obsolete data from the database. With the help of partitioning, you can divide the table into its constituent parts, thereby reducing the size of the indexes and constituent parts of the supertable, which positively affects the speed of the database as a whole.
Partitioning solves two problems at once:
1. accelerate the removal of obsolete data by deleting entire tables
2. splitting indices for each composite table
There are four mechanisms for partitioning in PostgreSQL:
1.standard constraint_exclusion
2. extension pg_partman ( do not confuse with pg_pathman )
3. extension pg_pathman
4. manually create and maintain partitions by ourselves
The most convenient, reliable and optimized partitioning solution, in our opinion, is the pg_pathman extension. With this partitioning method, the query planner flexibly determines in which partitions to search for data. Rumor has it that in the 12th version of PostgreSQL there will be an excellent partition already out of the box.
Thus, we began to write monitoring data for each day in a separate inherited table from the super table and the removal of obsolete parameter values began to occur through the removal of all obsolete tables at once, which is much easier for a DBMS by labor costs. Deletion was done by calling the user-defined function of the database as a monitoring parameter of the Zabbix server at 2 a.m. with an indication of the permissible range of statistics storage.
Install and configure partitioning for PostgreSQL 10
Install and configure the pg_pathman extension from the standard OS repository (for instructions on building the latest version of the extension from the sources, look in the same repository on github):
We reboot the DBMS, create the extension for the database and configure the partitioning (1 day for the primary monitoring data and 3 days for the aggregated monitoring data - it could be done for 1 day):
If there is no data in any of the tables yet, then when calling the create_range_partitions function, one more additional argument p_count = 0_ must be passed.
Useful queries for monitoring and managing partitions:
Useful script for viewing statistics on the number and size of partitions:
 yum install pg_pathman10
 nano /var/pgsqldb/postgresql.conf
 shared_preload_libraries = 'pg_pathman' # important - here write pg_pathman last in the list
We reboot the DBMS, create the extension for the database and configure the partitioning (1 day for the primary monitoring data and 3 days for the aggregated monitoring data - it could be done for 1 day):
 systemctl restart postgresql-10.service
 psql -d zabbix -U postgres
 CREATE EXTENSION pg_pathman;
 # configure one day for the tables of primary monitoring data
 # 1552424400 - countdown as unix timestamp, 86400 - seconds in days
 select create_range_partitions ('history', 'clock', 1552424400, 86400);
 select create_range_partitions ('history_uint', 'clock', 1552424400, 86400);
 select create_range_partitions ('history_text', 'clock', 1552424400, 86400);
 select create_range_partitions ('history_str', 'clock', 1552424400, 86400);
 select create_range_partitions ('history_log', 'clock', 1552424400, 86400);
 # configure for three days for aggregated monitoring data tables
 # 1552424400 - countdown as unix timestamp, 259200 - seconds in three days
 select create_range_partitions ('trends', 'clock', 1545771600, 259200);
 select create_range_partitions ('trends_uint', 'clock', 1545771600, 259200);
If there is no data in any of the tables yet, then when calling the create_range_partitions function, one more additional argument p_count = 0_ must be passed.
Useful queries for monitoring and managing partitions:
 # general list of partitioned tables, main configuration storage:
 select * from pathman_config;
 # representation with all existing sections, as well as their parents and range boundaries:
 select * from pathman_partition_list;
 # additional parameters that override the standard pg_pathman behavior:
 select * from pathman_config_params;
 # copy the contents back to the parent table and delete partitions:
 select drop_partitions ('table_name' :: regclass, false);
Useful script for viewing statistics on the number and size of partitions:
/* */ SELECT nspname AS schemaname, relname, relkind, cast (reltuples as int), pg_size_pretty(pg_relation_size(C.oid)) AS "size" FROM pg_class C LEFT JOIN pg_namespace N ON (N.oid = C.relnamespace) WHERE nspname NOT IN ('pg_catalog', 'information_schema') and (relname like 'history%' or relname like 'trends%') and relkind = 'r' -- and reltuples > 0 -- and pg_relation_size(C.oid) >= 0 ORDER BY schemaname, relname
Auto-configuration of deleting obsolete partitions (ahtung - a big SQL function)
To configure auto-deletion of partitions, you need to create a function in the database
(wide text, so I had to remove the syntax highlighting):
To automatically call the auto-clean partition function, you need to create one data item for the zabbix server host of the "Database Monitor" type with the following settings:
As a result, we will obtain statistics on partitions cleansing of approximately this type:
Important! After setting up automatic deletion of partitions via the data element and user function, you need to turn off history and trend cleaning in the Zabbix housekeeper task scheduler: through the zabbix menu item, select “Administration” -> “General” -> select “Clear history” from the list in the corner -> disable all checkboxes in the sections “History” and “Dynamics of changes”.
(wide text, so I had to remove the syntax highlighting):
 CREATE OR REPLACE FUNCTION public.delete_old_partitions (history_days integer, trends_days integer, str_days integer)
  RETURNS text
  LANGUAGE plpgsql
 AS $ function $
 / *
 The function deletes all partitions older than the specified number of days:
 history_days - for partitions history_x, history_uint_x
 trends_days - for partitions trends_x, trends_uint_x
 str_days - for partitions history_str_x, history_text_x, history_log_x
 * /
 declare clock_today_start int;
 declare clock_delete_less_history int = 0;
 declare clock_delete_less_trends int = 0;
 declare clock_delete_less_strings int = 0;
 clock_delete_less int = 0;
 declare iterator int = 0;
 declare result_str text = '';
 declare buf_table_size text;
 declare buf_table_len text;
 declare partition_name text;
 declare clock_max text;
 declare err_detail text;
 declare t_start timestamp = clock_timestamp ();
 declare t_end timestamp;
 begin
     if $ 1 <= 0 then return 'ups, something wrong: history_days argument must be positive integer value';  end if;
     if $ 2 <= 0 then return 'ups, something wrong: trends_days argument must be positive integer value';  end if;
     if $ 3 <= 0 then return 'ups, something wrong: str_days argument must be positive integer value';  end if;
     clock_today_start = extract (epoch from date_trunc ('day', now ())) :: int;
     clock_delete_less_history = extract (epoch from date_trunc ('day', now ()) - ($ 1 :: text || 'days') :: interval) :: int;
     clock_delete_less_trends = extract (epoch from date_trunc ('day', now ()) - ($ 2 :: text || 'days') :: interval) :: int;
     clock_delete_less_strings = extract (epoch from date_trunc ('day', now ()) - ($ 3 :: text || 'days') :: interval) :: int;
     clock_delete_less = least (clock_delete_less_history, clock_delete_less_trends, clock_delete_less_strings);
     --raise notice 'clock_today_start% (%)', to_timestamp (clock_today_start), clock_today_start;
     --raise notice 'clock_delete_less_history% (%)% days', to_timestamp (clock_delete_less_history), clock_delete_less_history, $ 1;
     --raise notice 'clock_delete_less_trends% (%)% days', to_timestamp (clock_delete_less_trends), clock_delete_less_trends, $ 2;
     --raise notice 'clock_delete_less_strings% (%)% days', to_timestamp (clock_delete_less_strings), clock_delete_less_strings, $ 3;
     for partition_name, clock_max in select partition, range_max from pathman_partition_list where
     range_max :: int <= greatest (clock_delete_less_history, clock_delete_less_trends, clock_delete_less_strings) and
     (partition :: text like 'history%' or partition :: text like 'trends%') order by partition asc
     loop
         if (partition_name ~ 'history_uint_ \ d' and clock_max :: int <= clock_delete_less_history)
         or (partition_name ~ 'history_ \ d' and clock_max :: int <= clock_delete_less_history)
         or (partition_name ~ 'trends_ \ d' and clock_max :: int <= clock_delete_less_trends)
         or (partition_name ~ 'history_log_ \ d' and clock_max :: int <= clock_delete_less_strings)
         or (partition_name ~ 'history_str_ \ d' and clock_max :: int <= clock_delete_less_strings)
         or (partition_name ~ 'history_text_ \ d' and clock_max :: int <= clock_delete_less_strings)
         then
             iterator = iterator + 1;
             raise notice '%', format ('!!! delete% s% s', partition_name, clock_max);
             select max (reltuples :: int), pg_size_pretty (sum (pg_relation_size (pg_class.oid))) as "size" from pg_class where relname like partition_name ||  '%' into strict buf_table_len, buf_table_size;
             if result_str! = '' then result_str = result_str ||  ',';  end if;
             result_str = result_str ||  format ('% s (dt <% s, len% s,% s)', partition_name, to_char (to_timestamp (clock_max :: int), 'YYYY-MM-DD'), buf_table_len, buf_table_size);
             execute format ('drop table if exists% s', partition_name);
         end if;
     end loop;
     if iterator = 0 then result_str = format ('there is no partitions to delete older, then% s date', to_char (to_timestamp (clock_delete_less), 'YYYY-MM-DD'));
     else result_str = format ('deleted% s partitions in% s seconds:', iterator, trunc (extract (seconds from (clock_timestamp () - t_start)) :: numeric, 3)) ||  result_str;
     end if;
     --raise notice '%', result_str;
     return result_str;
 exception when others then
    get stacked diagnostics err_detail = PG_EXCEPTION_CONTEXT;
    return format ('ups, something wrong:% s [err code% s],% s', sqlerrm, sqlstate, err_detail);
 end;
 $ function $;
To automatically call the auto-clean partition function, you need to create one data item for the zabbix server host of the "Database Monitor" type with the following settings:
- type: database monitor - name: delete_old_history_partitions - key: db.odbc.select [delete_old_history_partitions, zabbix] - sql expression: select delete_old_partitions (3, 30, 30); # here, the parameters for calling the delete_old_partitions function indicate the storage time in days # for numeric values, aggregated numeric values and string values - data type: Text - update interval: 0 - user interval: scheduled in h2 - history storage period: 90 days - data element group: Database
As a result, we will obtain statistics on partitions cleansing of approximately this type:
2019-09-16 02:00:00, deleted 3 partitions in 0.024 seconds: trends_78 (dt <2019-08-17, len 1, 48 kB), history_193 (dt <2019-09-13, len 85343, 9448 kB ), history_uint_186 (dt <2019-09-13, len 27969, 3480 kB)
Important! After setting up automatic deletion of partitions via the data element and user function, you need to turn off history and trend cleaning in the Zabbix housekeeper task scheduler: through the zabbix menu item, select “Administration” -> “General” -> select “Clear history” from the list in the corner -> disable all checkboxes in the sections “History” and “Dynamics of changes”.
Changing index types of history tables to brin (clock) and btree-gin (itemid)
Special thanks to erogov for the excellent series of overview articles on PostgreSQL indexes . And indeed the entire PostgresPRO team.Impressed by these articles, we played around with different types of indexes on the monitoring data tables and came to the conclusion which types of indexes on which fields will give the maximum performance boost.
It was noticed that the composite index btree (itemid, clock) is created by default on all tables of monitoring data - it is fast for searching, especially for monotonously ordered values, but it “swells” on the disk when there is a lot of data - more than 10 million.
On the tables By default hourly aggregated statistics, a unique index is generally created, although these tables for data storage and uniqueness are provided here at the application server level, and a unique index only slows down data insertion.
During testing of various indices, the most successful combination of indices was revealed: the brin index on the clock field and the btree-gin index on the itemid field for all tables of monitoring data.
The brin index is ideal for monotonically increasing data, such as the timestamp of the fact of an event, i.e. for time series. And the btree-gin index is essentially a gin index over standard data types, which is generally much faster than the classic btree index because gin index is not rebuilt during the addition of new values, but only supplemented by them. The btree-gin index is put as an extension to PostgreSQL.
A comparison of the sampling speed for this indexing strategy and for indexes in the Zabbix database by default is given below. During stress tests, we accumulated data for three days for three partitions:
| Partition Name | The number of rows in the MLN | Size in MB |
|---|---|---|
| history_uint_1 | 81.3 | 4119 |
| history_uint_2 | 74.9 | 4426 |
| history_uint_3 | 100.7 | 5387 |
To evaluate the results, three types of queries were performed:
- for one specific parameter itemid data for the last month, in fact the last three days (total 1660 records)
explain analyze select * from history_uint where itemid = 313300
and clock> = extract (epoch from '2019-03-09 00:00:00' :: timestamp) :: int
and clock <= extract (epoch from '2019-04-09 12:00:00' :: timestamp) :: int;
- for one specific parameter data for 12 hours of one day (649 entries in total)
explain analyze select * from history_text where itemid = 310650
and clock> = extract (epoch from '2019-04-09 00:00:00' :: timestamp) :: int
and clock <= extract (epoch from '2019-04-09 12:00:00' :: timestamp) :: int;
- for one specific parameter data for one hour (61 records in total):
explain analyze select count (*) from history_text where itemid = 336540
and clock> = extract (epoch from '2019-04-08 11:00:00' :: timestamp) :: int
and clock <= extract (epoch from '2019-04-08 12:00:00' :: timestamp) :: int;
The test results were tabulated below:
| index type | size in MB * | request 1 ** in ms | request 2 ** in ms | request 3 ** in ms |
|---|---|---|---|---|
| btree (clock, itemid) | 14741 | 7154.3 | 2205.3 | 1860.4 |
| brin (clock),
btree-gin (itemid) | 0.42 and 1329 | 2958.2 | 1820.4 | 102.1 |
** type 1 request - data for 3 days, type 2 request - data for 12 hours, type 3 request - data for one hour
From the comparison table it can be seen that for large data tables with the number of records more than 100 million, it is clearly seen that changing the standard composite index btree to two indices brin and btree-gin has a beneficial effect on reducing the size of indexes and speeding up query execution time.
The effectiveness of indexing and partitioning is shown below on the example of a request to add new records to the history_uint and trends_uint tables (additions occur on average 2000 values per query).
| Table | Average request time to improvements, ms | Average request time after improvements, ms |
|---|---|---|
| trends_uint | 2201.48 | 8.72 |
| trends_uint | 1997.27 | 62.16 |
Summarizing the results of tests of various index configurations for zabbix system monitoring data tables, we can say that a similar change in the standard index for zabbix system monitoring data tables positively affects the overall system performance, which is most felt when data volumes are accumulated in the amount of 10 million or more. you should forget about the indirect effect of "swelling" of the standard btree index by default - frequent rebuilds of the multi-gigabyte index leads to heavy load of the hard disk (utiliz metric ation), which ultimately increases the time of disk operations and the latency of access to the disk by the CPU (iowait metric).
But, so that the btree-gin index can work with the bigint (in8) data type, which is the itemid column, you need to register a family of bigint operators for the btree-gin index.
Register a bigint operator family for the btree-gin index
/ *
     gin    biginteger  integer    .
 -   gin     int2, int4, int8,
       bigint     ,     bigint (<= 2147483647)
        intger_ops,  :
create index on tablename using gin(columnname int8_family_ops) with (fastupdate = false);
 * /

--       btree_gin
CREATE EXTENSION btree_gin;

CREATE OPERATOR FAMILY integer_ops using gin;

CREATE OPERATOR CLASS int4_family_ops
FOR TYPE int4 USING gin FAMILY integer_ops
AS
    OPERATOR 1 <,
    OPERATOR 2 <=,
    OPERATOR 3 =,
    OPERATOR 4 >=,
    OPERATOR 5 >,
    FUNCTION 1 btint4cmp(int4,int4),
    FUNCTION 2 gin_extract_value_int4(int4, internal),
    FUNCTION 3 gin_extract_query_int4(int4, internal, int2, internal, internal),
    FUNCTION 4 gin_btree_consistent(internal, int2, anyelement, int4, internal, internal),
    FUNCTION 5 gin_compare_prefix_int4(int4,int4,int2, internal),
STORAGE int4;

CREATE OPERATOR CLASS int8_family_ops
FOR TYPE int8 USING gin FAMILY integer_ops
AS
    OPERATOR 1 <,
    OPERATOR 2 <=,
    OPERATOR 3 =,
    OPERATOR 4 >=,
    OPERATOR 5 >,
    FUNCTION 1 btint8cmp(int8,int8),
    FUNCTION 2 gin_extract_value_int8(int8, internal),
    FUNCTION 3 gin_extract_query_int8(int8, internal, int2, internal, internal),
    FUNCTION 4 gin_btree_consistent(internal, int2, anyelement, int4, internal, internal),
    FUNCTION 5 gin_compare_prefix_int8(int8,int8,int2, internal),
STORAGE int8;

ALTER OPERATOR FAMILY integer_ops USING gin add
  OPERATOR 1 <(int4,int8),
  OPERATOR 2 <=(int4,int8),
  OPERATOR 3 =(int4,int8),
  OPERATOR 4 >=(int4,int8),
  OPERATOR 5 >(int4,int8);

ALTER OPERATOR FAMILY integer_ops USING gin add
  OPERATOR 1 <(int8,int4),
  OPERATOR 2 <=(int8,int4),
  OPERATOR 3 =(int8,int4),
  OPERATOR 4 >=(int8,int4),
  OPERATOR 5 >(int8,int4);
This script redistributes all indexes in the PostgreSQL database for Zabbix from the default configuration to the optimal configuration described above.
/*

 * /

--
drop index history_1;
drop index history_uint_1;
drop index history_str_1;
drop index history_text_1;
drop index history_log_1;
--          PK
-- (   ,         )
alter table trends drop constraint trends_pk;
alter table trends_uint drop constraint trends_uint_pk;

--     bree-gin   itemid
--   btree-gin  bigint
-- https://habr.com/ru/company/postgrespro/blog/340978/#comment_10545932
--    create extension btree_gin;
create index on history using gin(itemid int8_family_ops) with (fastupdate = false);
create index on history_uint using gin(itemid int8_family_ops) with (fastupdate = false);
create index on history_str using gin(itemid int8_family_ops) with (fastupdate = false);
create index on history_text using gin(itemid int8_family_ops) with (fastupdate = false);
create index on history_log using gin(itemid int8_family_ops) with (fastupdate = false);
create index on trends using gin(itemid int8_family_ops) with (fastupdate = false);
create index on trends_uint using gin(itemid int8_family_ops) with (fastupdate = false);

--     bree-gin   itemid
--     brin    128 ,
--           ,
--      https://habr.com/ru/company/postgrespro/blog/346460/
create index on history using brin(clock) with (pages_per_range = 128);
create index on history_uint using brin(clock) with (pages_per_range = 128);
create index on history_str using brin(clock) with (pages_per_range = 128);
create index on history_text using brin(clock) with (pages_per_range = 128);
create index on history_log using brin(clock) with (pages_per_range = 128);
create index on trends using brin(clock) with (pages_per_range = 128);
create index on trends_uint using brin(clock) with (pages_per_range = 128);
For the brin index for our data volume at an intensity of 100 tons of parameters per minute (100 tons in history and 100 tons in history_uint), it was noticed that on the tables of primary monitoring data, the index works twice as fast with a zone size of 512 pages than with the standard size of 128 pages, but this is individual and depends on the size of the tables and server configuration. In any case, the brin index takes up very little space, but its speed can be slightly increased by fine-tuning the size of the zone, but provided that the data flow rate does not change much.
As a result, it is worth noting that there is a limitation associated with the architecture of Zabbix itself: on the tab “Recent data”, the last two values for each parameter are collected taking into account filtering. For each parameter, values are requested in the database separately. Therefore, the more such parameters are selected, the longer the query will run. The most recent data is searched when the btree index (itemid, clock desc) is set on history tables with reverse sorting by time, but at the same time, the index itself of course “swells” on the disk and generally indirectly slows down the database, which causes a problem, described above.
Therefore, there are three ways out:
- « » 100 (.. , « » )
- Zabbix , , « »
- leave the indexes as they are by default, and limit ourselves to partitioning only to get quite large selections on the Recent Data tab at the same time for a variety of parameters (however, it was noticed that the Zabbix web server still has a limit on the number of simultaneously displayed parameter values on the tab “Recent data” - so, when trying to display 5000 values, the database calculated the result, but the server could not prepare a web page and display such a large amount of data).
Collection and analysis of query execution statistics pg_stat_statements
Pg_stat_statements is an extension for collecting statistics on query performance across the entire server. The advantage of this extension is that it does not need to collect and parse PostgreSQL logs.
Using the pg_stat_statements Extension
psql:
postgresql.conf:
:
:
CREATE EXTENSION pg_stat_statements;
postgresql.conf:
shared_preload_libraries = 'pg_stat_statements'
pg_stat_statements.max = 10000 #   sql ,     (     );
pg_stat_statements.track = all # all -   (    ), top -   /, none -
pg_stat_statements.save = true #
:
SELECT pg_stat_statements_reset();
:
select substring(query from '[^(]*') as query_sub, sum(calls) as calls, avg(mean_time) as mean_time from pg_stat_statements where query ~ 'insert into' or query ~ 'update trends' group by substring(query from '[^(]*') order by calls desc
To monitor hard drives in Zabbix, only the vfs.dev.read and vfs.dev.write parameters are provided out of the box. These options do not provide information about disk utilization. Useful criteria for finding problems with the performance of your hard drives are utilization factor, await query time, and disk load queue load.
As a rule, high disk load correlates with high iowait of cpu itself and with an increase in the execution time of sql queries, which was found during load testing of a zabbix server with a standard configuration without partitioning and without setting up alternative indexes. You can add these monitoring parameters for hard drives using the following steps, which were peeped in an article from a friendlesovsky and improved: now iostat parameters are collected separately for each disk into a json temporary parameter, from where, according to the post-processing settings, they are already decomposed into the final monitoring parameters.
While the Pull request is pending, you can try to deploy monitoring of disk parameters according to the detailed instructions through my fork .
After all the described actions, you can add a custom graph with iowait cpu and utiliztion parameters for the system disk and the disk from the database (if they are different) to the main Zabbix server monitoring panel. The result may look like this (sda is the main disk, sdc is the disk with the database):
Hardware Performance Improvement
After setting up the DBMS, indexing and partitioning, you can proceed to vertical scaling - to improve the hardware characteristics of the server: add RAM, change drives to solid-state and add processor cores. This is a guaranteed performance increase, but it is better to do this only after software optimization.
Creating a Distributed Cluster
After moderate vertical scaling, you need to start horizontal - create a distributed cluster: either shard or replicate the master slave. But this is a separate topic and material of a separate article
In the meantime, one can only hope that the material in this article turned out to be useful and informative!
All Articles