Best Practices for Kubernetes Containers: Health Checks

TL; DR
- To achieve high observability of containers and microservices, magazines and primary metrics is not enough.
- For faster recovery and increased fault tolerance, applications must apply the High Observability Principle (HOP).
- At the application level, NRA requires: proper logging, careful monitoring, health checks, and performance / transition tracing.
- Use the readinessProbe and livenessProbe Kubernetes checks as a HOP element.
What is a Health Check Template?
When designing a mission-critical and highly available application, it’s very important to think about the issue of fault tolerance. An application is considered fault tolerant if it is quickly restored after a failure. A typical cloud application uses a microservice architecture — when each component is placed in a separate container. And in order to make sure that the application on k8s is highly accessible, when you design a cluster, you need to follow certain patterns. Among them is the Health Check Template. It determines how the application reports k8s about its performance. This is not only information about whether pod works, but also about how it accepts requests and responds to them. The more Kubernetes knows about the performance of a pod, the more intelligent decisions it makes about traffic routing and load balancing. Therefore, the principle of high observability of the application in a timely manner to respond to inquiries.
The principle of high observability (NRA)
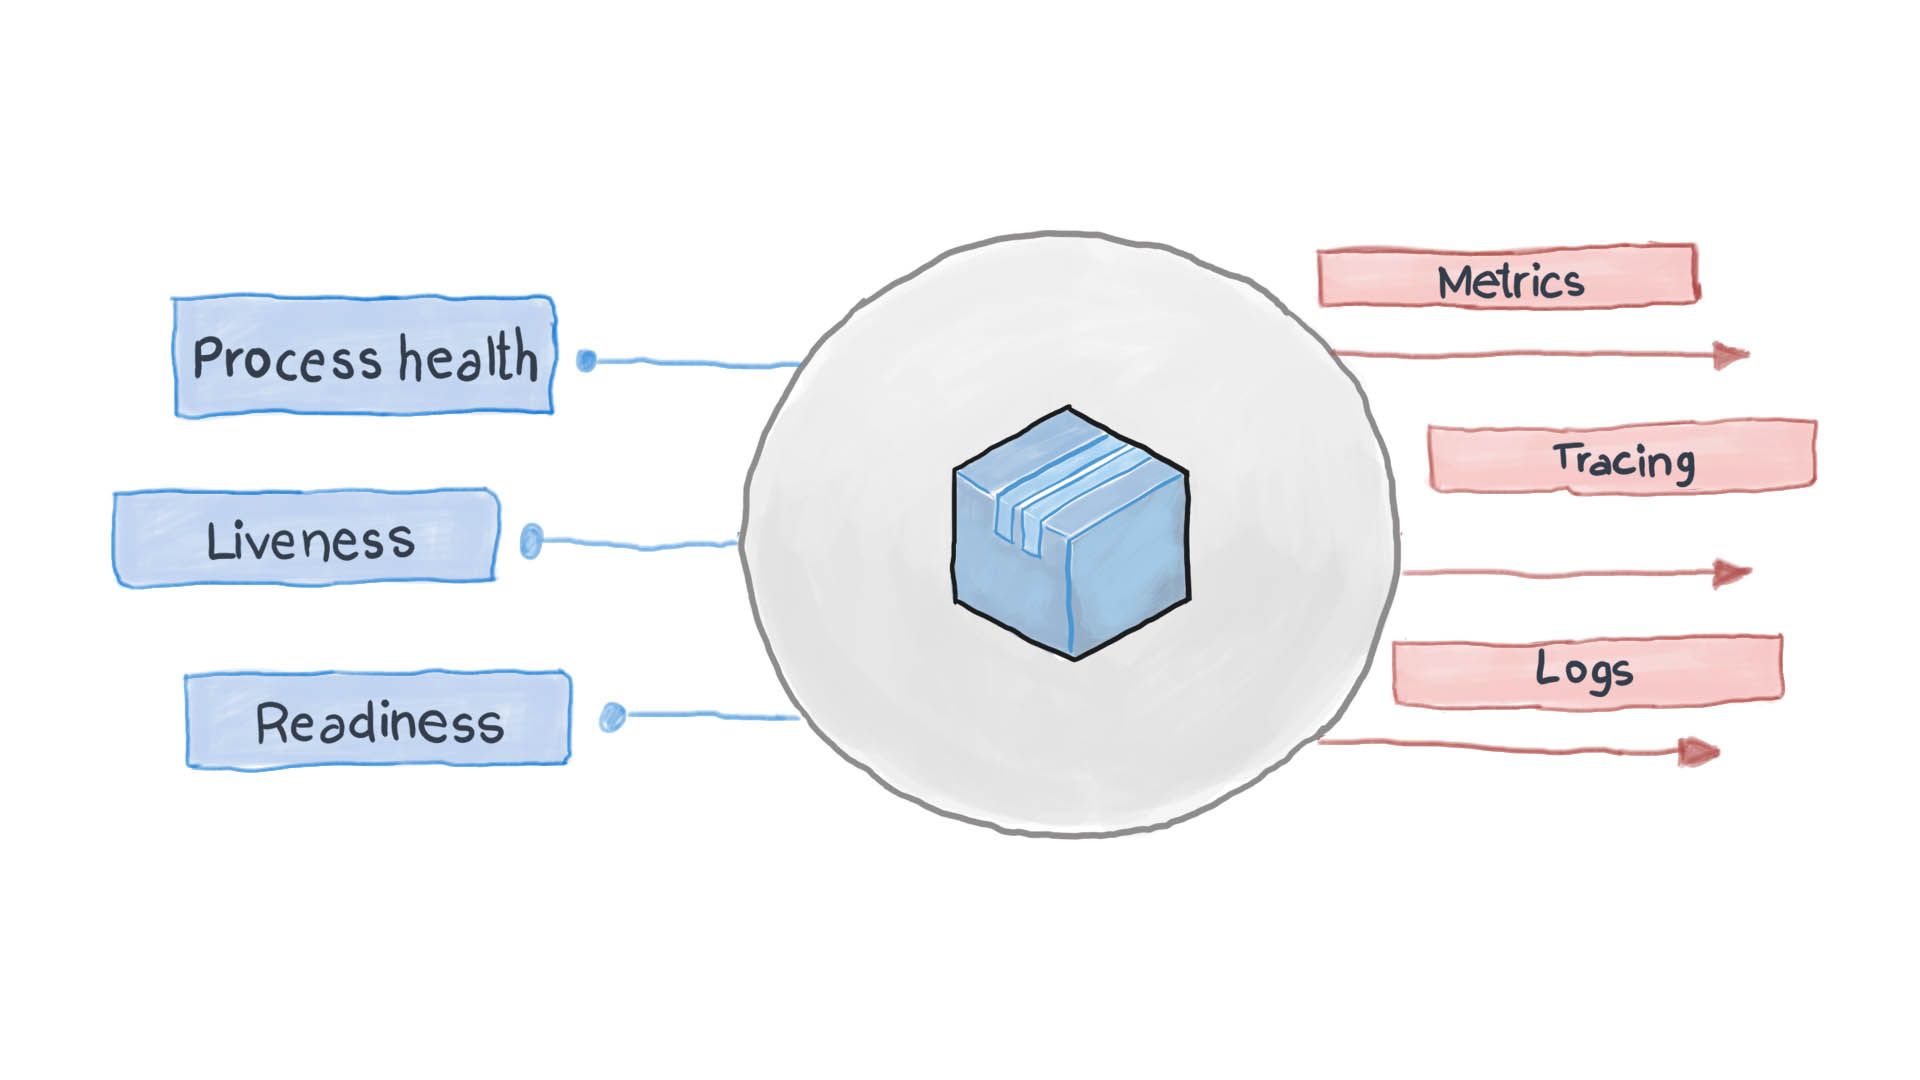
The principle of high observability is one of the principles of designing containerized applications . In microservice architecture, services do not care how their request is processed (and rightly so), but it is important how to get responses from receiving services. For example, to authenticate a user, one container sends another HTTP request, waiting for a response in a specific format - that’s all. PythonJS can also handle the request, and Python Flask can respond. Containers for each other are like black boxes with hidden content. However, the principle of NRA requires that each service disclose several API endpoints showing how efficient it is, as well as its state of readiness and fault tolerance. Kubernetes asks these metrics to think through the next steps in routing and load balancing.
A well-designed cloud application logs its key events using the standard STDERR and STDOUT I / O streams. Next, an auxiliary service, for example filebeat, logstash or fluentd, runs, delivering logs to a central monitoring system (for example Prometheus) and a log collection system (ELK software suite). The diagram below shows how the cloud application works in accordance with the Health Check Template and the High Observability Principle.
How to apply Health Check Pattern in Kubernetes?
Out of the box, k8s monitors the status of pods using one of the controllers ( Deployments , ReplicaSets , DaemonSets , StatefulSets , etc., etc.). Having discovered that the pod has fallen for some reason, the controller is trying to restart it or move it to another node. However, pod may report that it is up and running, while it itself is not functioning. Here is an example: your application uses Apache as the web server, you installed the component on several pods of the cluster. Since the library was not configured correctly, all requests to the application respond with code 500 (internal server error). When checking the delivery, checking the status of pods gives a successful result, however, customers consider otherwise. We describe this undesirable situation as follows:
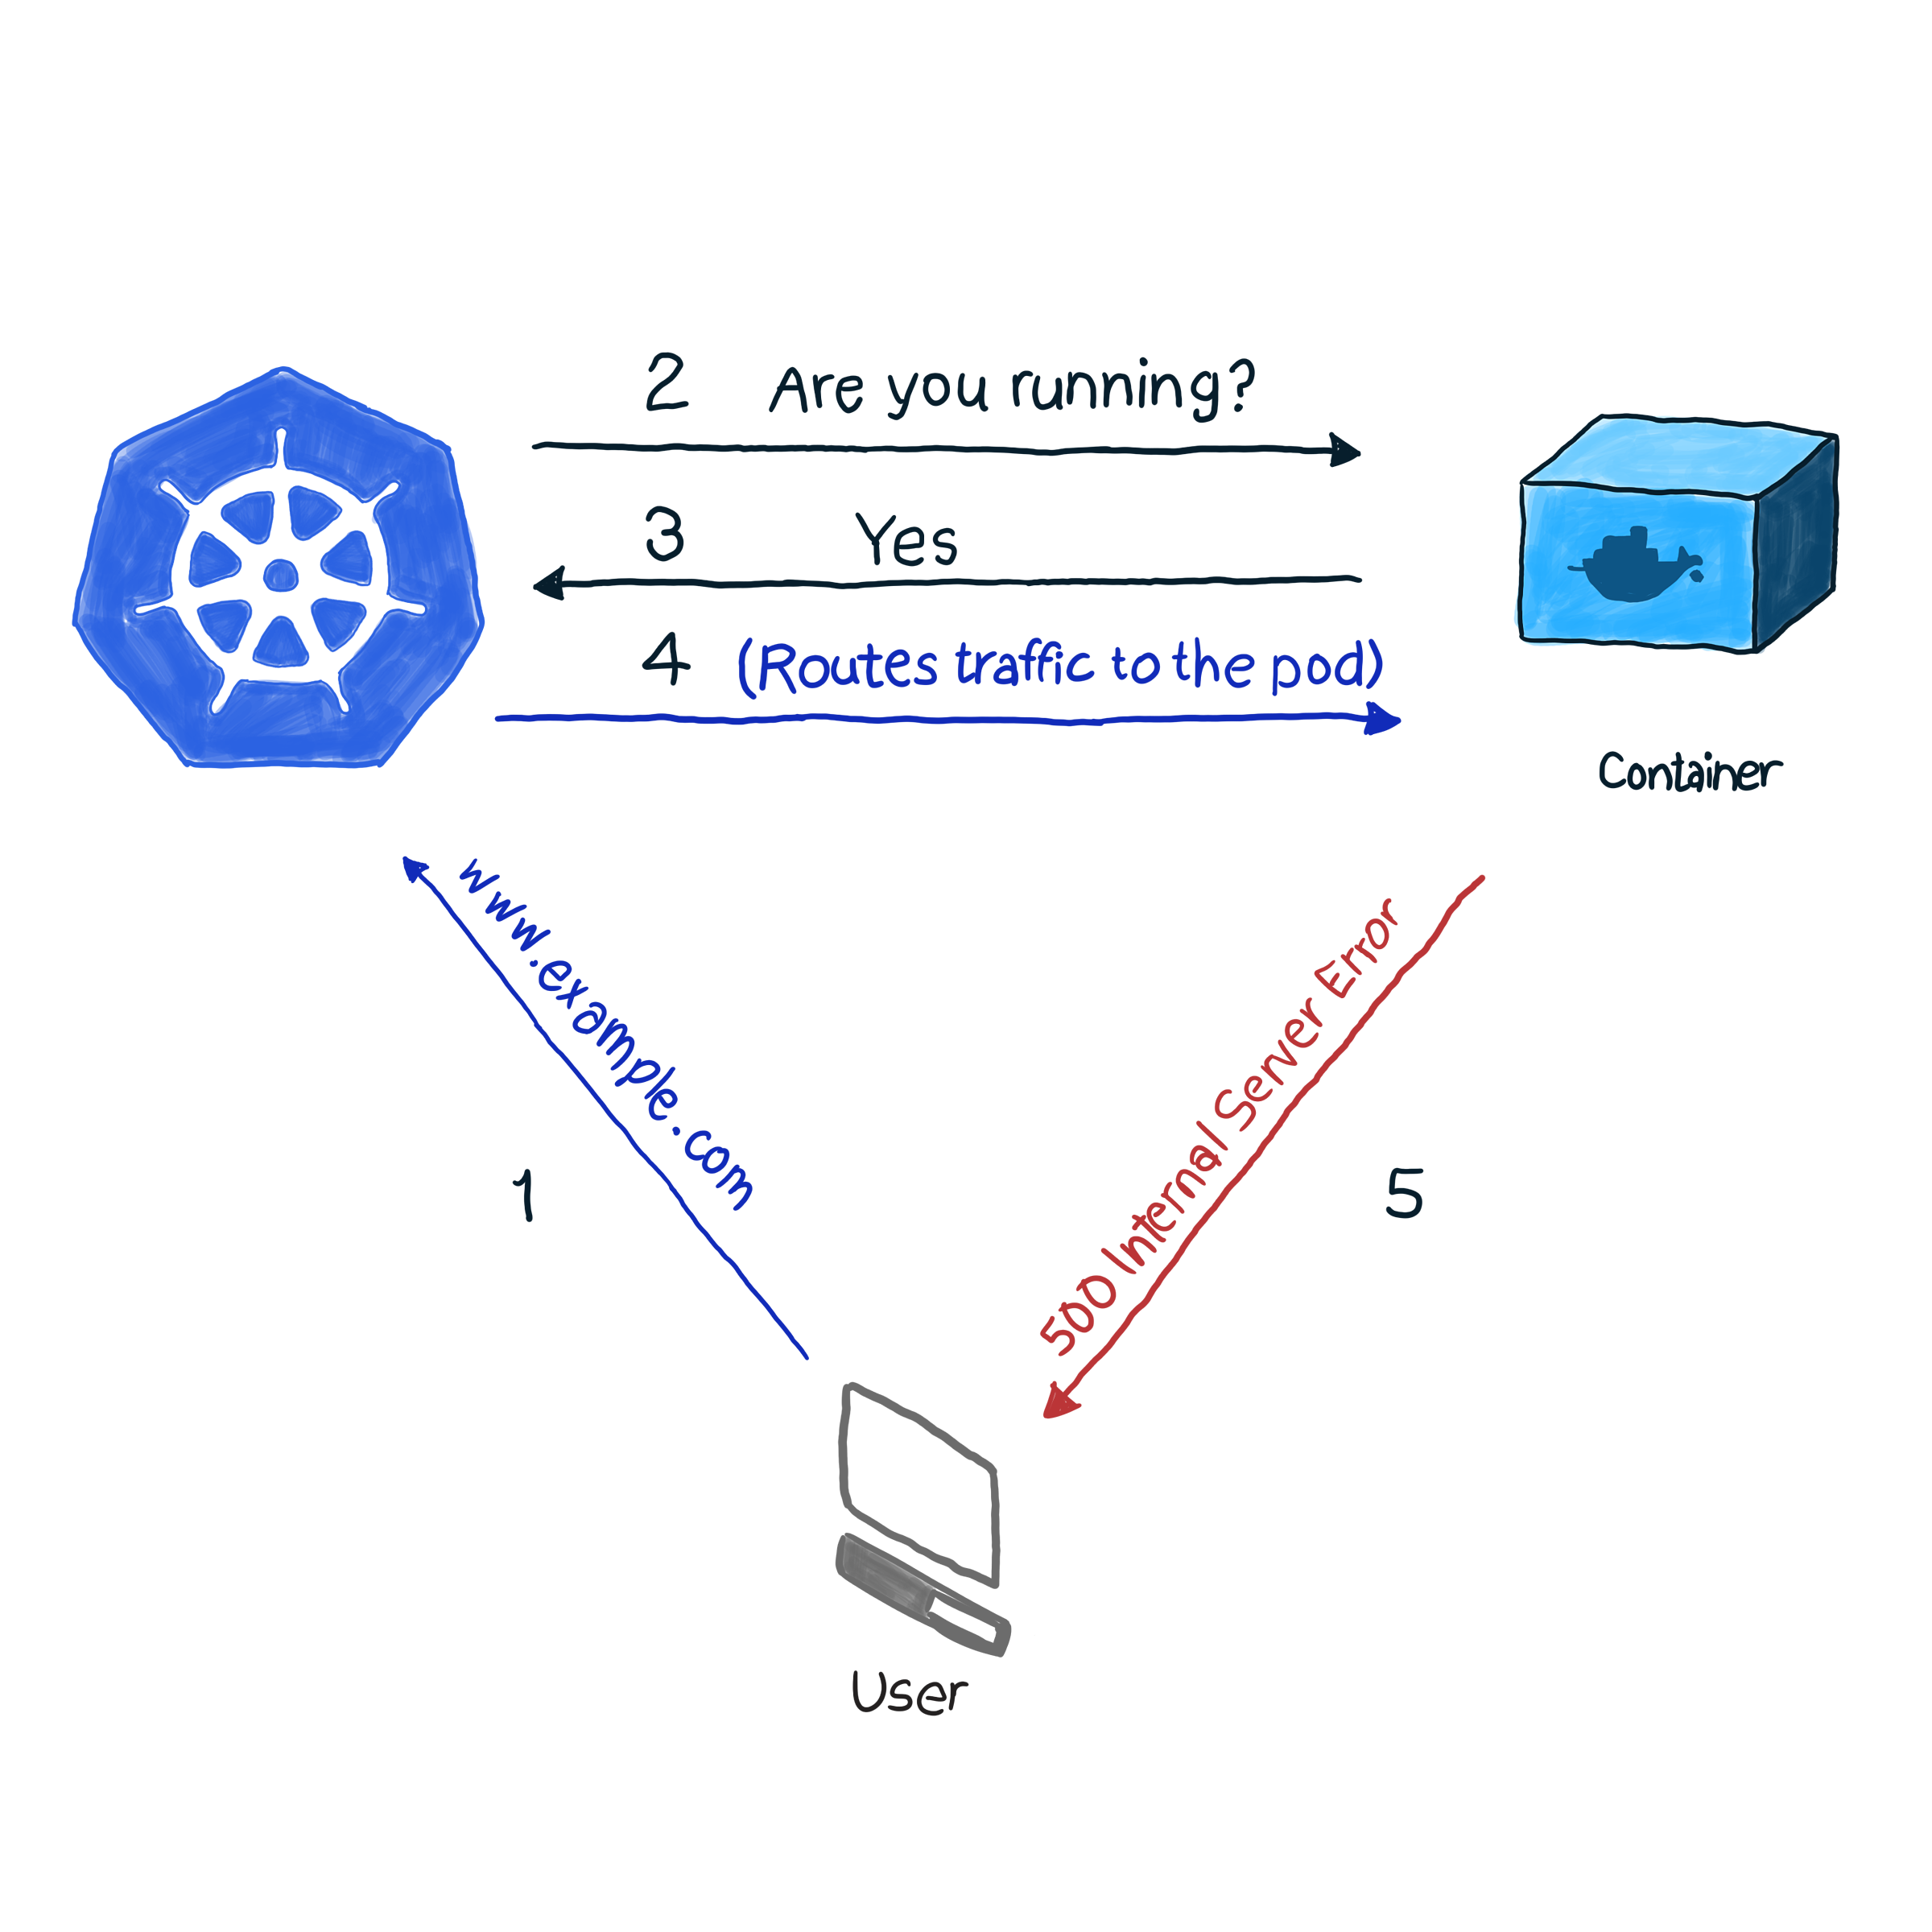
In our example, k8s performs a health check . In this type of check, kubelet constantly checks the status of the process in the container. Once he understands that the process has risen, he will restart it. If the error is eliminated by simply restarting the application, and the program is designed to turn off when there is any error, then you need to check the process operability to follow the NRA and the Health Check Template. It is a pity that not all errors are eliminated by restarting. For this case, k8s offers 2 deeper ways to troubleshoot pods : livenessProbe and readinessProbe .
LivenessProbe
During livenessProbe, kubelet performs 3 types of checks: it not only finds out if the pod works, but whether it is ready to receive and adequately respond to requests:
- Set an HTTP request to pod. The response should contain an HTTP response code in the range from 200 to 399. Thus, the 5xx and 4xx codes indicate that the pod has problems, even if the process is running.
- To check pods with non-HTTP services (for example, Postfix mail server), you need to establish a TCP connection.
- Execution of an arbitrary command for the pod (internally). Verification is considered successful if the command exit code is 0.
An example of how this works. The definition of the following pod contains a NodeJS application that gives an error of 500 for HTTP requests. To make sure that the container restarts after receiving such an error, we use the livenessProbe parameter:
apiVersion: v1 kind: Pod metadata: name: node500 spec: containers: - image: magalix/node500 name: node500 ports: - containerPort: 3000 protocol: TCP livenessProbe: httpGet: path: / port: 3000 initialDelaySeconds: 5
This is no different from any other .spec.containers.livenessProbe
definition, but we add a .spec.containers.livenessProbe
object. The httpGet
parameter accepts the path where the HTTP GET request is sent (in our example, this is /
, but in battle scenarios there may also be something like /api/v1/status
). Still livenessProbe accepts the initialDelaySeconds
parameter, which instructs the verification operation to wait for a specified number of seconds. The delay is needed because the container needs time to start, and when it restarts it will be unavailable for a while.
To apply this setting to a cluster, use:
kubectl apply -f pod.yaml
After a few seconds, you can check the contents of the pod with the following command:
kubectl describe pods node500
Find the following at the end of the output.
As you can see, livenessProbe initiated an HTTP GET request, the container generated an error 500 (which was programmed for), kubelet restarted it.
If you're interested in how the NideJS application was programmed, here is the app.js and Dockerfile that were used:
app.js
var http = require('http'); var server = http.createServer(function(req, res) { res.writeHead(500, { "Content-type": "text/plain" }); res.end("We have run into an error\n"); }); server.listen(3000, function() { console.log('Server is running at 3000') })
Dockerfile
FROM node COPY app.js / EXPOSE 3000 ENTRYPOINT [ "node","/app.js" ]
It is important to pay attention to this: livenessProbe will restart the container only in case of failure. If the restart does not fix the error that interferes with the operation of the container, kubelet will not be able to take measures to eliminate the malfunction.
readinessProbe
readinessProbe works similar to livenessProbes (GET requests, TCP communications, and command execution), with the exception of troubleshooting actions. The container in which the failure is recorded does not restart, but is isolated from incoming traffic. Imagine one of the containers does a lot of computation or is under heavy load, which increases the response time for requests. In the case of livenessProbe, a response availability check is triggered (via the timeoutSeconds check parameter), after which kubelet restarts the container. When launched, the container begins to perform resource-intensive tasks and is restarted again. This can be critical for applications that care about response speed. For example, a machine directly on the way awaits a response from the server, the response is delayed - and the car crashes.
Let's write a definition of redinessProbe that sets the response time for a GET request to no more than two seconds, and the application will respond to a GET request in 5 seconds. The pod.yaml file should look like this:
apiVersion: v1 kind: Pod metadata: name: nodedelayed spec: containers: - image: afakharany/node_delayed name: nodedelayed ports: - containerPort: 3000 protocol: TCP readinessProbe: httpGet: path: / port: 3000 timeoutSeconds: 2
Expand the pod with kubectl:
kubectl apply -f pod.yaml
Wait a couple of seconds, and then look at how readinessProbe worked:
kubectl describe pods nodedelayed
At the end of the conclusion, you can see that some of the events are similar to this .
As you can see, kubectl did not restart pod when the scan time exceeded 2 seconds. Instead, he canceled the request. Incoming connections are redirected to other, working pods.
Note: now that the extra load has been removed from the pod, kubectl sends requests to it again: responses to the GET request are no longer delayed.
For comparison: the following is the modified app.js file:
var http = require('http'); var server = http.createServer(function(req, res) { const sleep = (milliseconds) => { return new Promise(resolve => setTimeout(resolve, milliseconds)) } sleep(5000).then(() => { res.writeHead(200, { "Content-type": "text/plain" }); res.end("Hello\n"); }) }); server.listen(3000, function() { console.log('Server is running at 3000') })
TL; DR
Before the advent of cloud-based applications, logs were the main means of monitoring and checking the status of applications. However, there was no means to take any troubleshooting steps. Logs are useful today, they must be collected and sent to the log assembly system for analysis of emergency situations and decision making. [ all this could be done without cloud applications using monit, for example, but with k8s it has become much easier :) - Ed. ]
Today, corrections have to be made almost in real time, so applications should no longer be black boxes. No, they should show endpoints that allow monitoring systems to request and collect valuable data on the status of processes, so that they can respond instantly if necessary. This is called the Health Check Design Template, which follows the High Observability Principle (NRA).
Kubernetes by default offers 2 types of health checks: readinessProbe and livenessProbe. Both use the same types of checks (HTTP GET requests, TCP communications, and command execution). They differ in what decisions are made in response to problems in pods. livenessProbe restarts the container in the hope that the error will not recur, and readinessProbe isolates the pod from incoming traffic until the cause of the problem is resolved.
Proper application design should include both types of validation and that they collect enough data, especially when an exception is created. It should also show the necessary API endpoints that transmit important health status metrics to the monitoring system (also Prometheus).
All Articles