Designing dashboards for web analytics e-commerce site. Part 3: SEO Channel
In this article, we will collect a dashboard for SEO traffic analytics. We will unload the data through python scripts and through .csv files.
To analyze the dynamics of the positions of search phrases, you will need to unload from Yandex.Webmaster and Google Search Console . To assess the "usefulness" of pumping the position of the search phrase, frequency data will be useful. They can be obtained from Yandex.Direct and Google Ads . Well, to analyze the behavior of the technical side of the site, we will use Page Speed Insider .
SEO traffic dynamics
To interact with the API, we will use the searchconsole library. The github describes in detail how to get the necessary tokens for login. The procedure for uploading data and loading it into the MS SQL database will be as follows:
Unfortunately, the Webmaster can only upload 500 search phrases. Upload cuts by country, device type, etc. he can't either. Due to these restrictions, in addition to uploading positions for 500 words from the Webmaster, we will upload data from Yandex.Metrica to landing pages. For those who do not have many search phrases, 500 words will be enough. If your semantic core according to Yandex is wide enough, you will have to unload positions from other sources or write your position parser.
Allows you to evaluate the download speed of site content. If the site began to load more slowly, then this can significantly reduce the position of the site in search results.
To estimate the frequency of search queries, we unload the frequency of our SEO core.
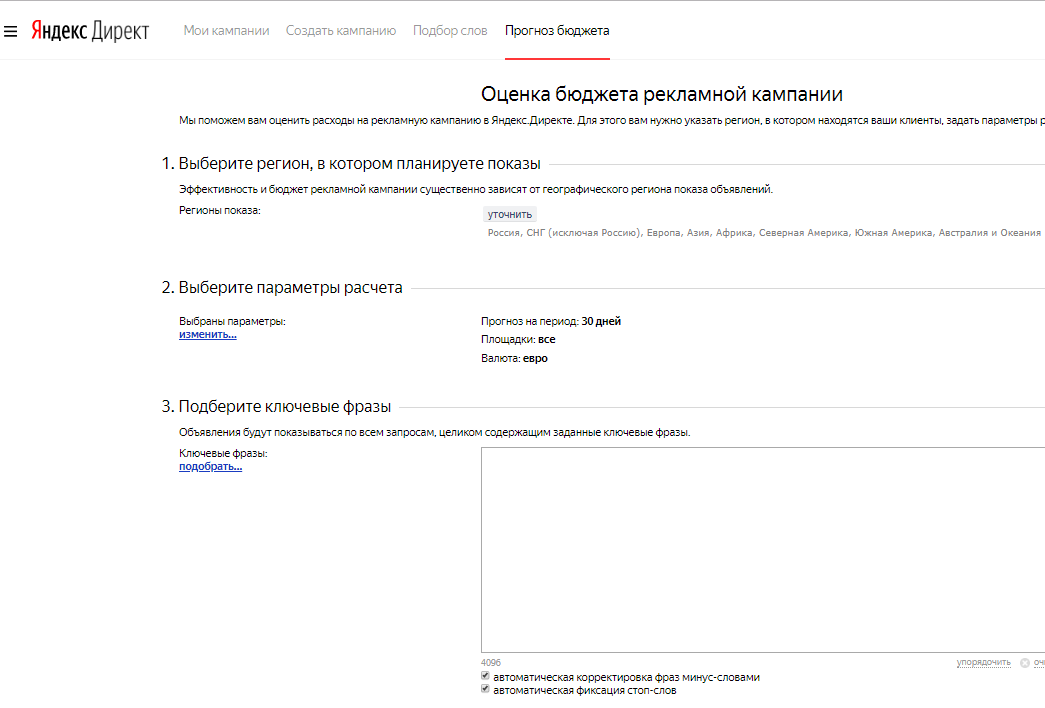
Yandex budget forecast
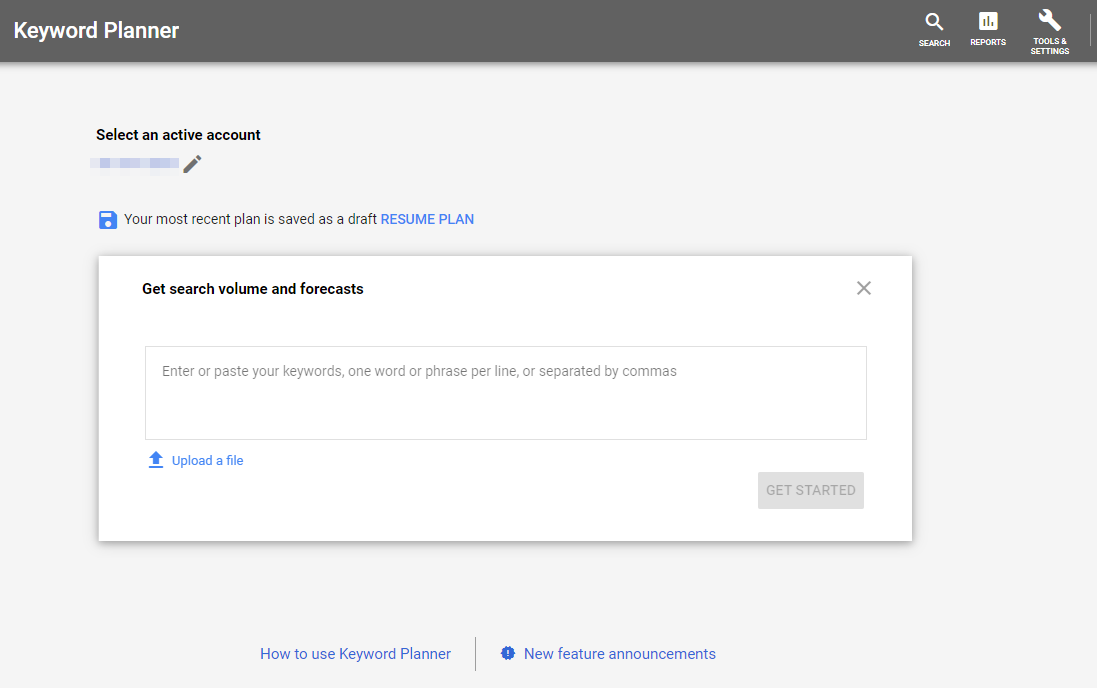
Google Keyword Planner
Upload data on views and visits to login pages from SEO traffic.
Let's see what we managed to unload:
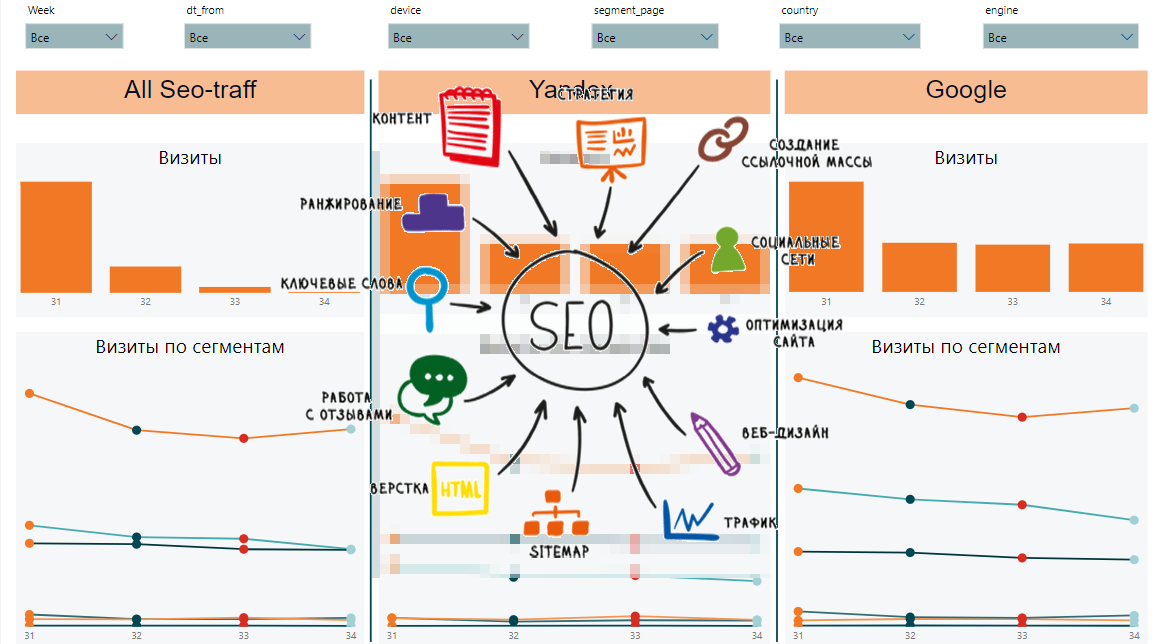
From this data we will be able to collect dynamics by week, by segment, general data by segments and requests, dynamics and general data by pages and speed of loading content. This is what the final report might look like:

On the one hand, there are a lot of different signs and it is difficult to understand what are the general trends. On the other hand, each plate displays important data on positions, impressions, clicks, CTR, page load speed.
Articles from the cycle:
What will we unload?
To analyze the dynamics of the positions of search phrases, you will need to unload from Yandex.Webmaster and Google Search Console . To assess the "usefulness" of pumping the position of the search phrase, frequency data will be useful. They can be obtained from Yandex.Direct and Google Ads . Well, to analyze the behavior of the technical side of the site, we will use Page Speed Insider .
SEO traffic dynamics
Google search console
To interact with the API, we will use the searchconsole library. The github describes in detail how to get the necessary tokens for login. The procedure for uploading data and loading it into the MS SQL database will be as follows:
def google_reports(): # account = searchconsole.authenticate(client_config=r'credentials.json' , credentials=r'cred_result.json') webproperty = account['https://test.com/'] # , , report = webproperty.query.range('today', days=-10).dimension('country', 'device', 'page', 'query').get() now = datetime.now() fr = now - timedelta(days = 9) to = now - timedelta(days = 3) res = pd.DataFrame(columns=['dt_from', 'dt_to', 'country', 'device', 'page', 'query', 'clicks', 'impressions', 'position']) # DataFrame for i in report.rows: temp={} temp['country'] = i[0] temp['device'] = i[1] temp['page'] = i[2] temp['query'] = i[3] temp['clicks'] = i[4] temp['impressions'] = i[5] temp['position'] = i[7] temp['dt_from'] = fr.strftime("%Y-%m-%d") temp['dt_to'] = to.strftime("%Y-%m-%d") res = res.append(temp, ignore_index=True) to_sql_server(res, 'google_positions')
Yandex.Webmaster
Unfortunately, the Webmaster can only upload 500 search phrases. Upload cuts by country, device type, etc. he can't either. Due to these restrictions, in addition to uploading positions for 500 words from the Webmaster, we will upload data from Yandex.Metrica to landing pages. For those who do not have many search phrases, 500 words will be enough. If your semantic core according to Yandex is wide enough, you will have to unload positions from other sources or write your position parser.
def yandex_reports(): token = "..." # UserID url = "https://api.webmaster.yandex.net/v4/user/" headers = {"Authorization": "OAuth " + token} res = requests.get(url, headers=headers) a = json.loads(res.text) userId = a['user_id'] host_id = "https:test.com:443" # 500 res = requests.get(url+str(userId)+"/hosts/"+host_id+"/search-queries/popular/?order_by=TOTAL_SHOWS&query_indicator=TOTAL_SHOWS", headers=headers) df1 = pd.DataFrame(columns=['query_id', 'query_text', 'shows', 'dt_from', 'dt_to']) a = json.loads(res.text) for i in a['queries']: temp={} temp['query_id'] = i['query_id'] temp['query_text'] = i['query_text'] temp['shows'] = i['indicators']['TOTAL_SHOWS'] temp['query_text'] = i['query_text'] temp['dt_from'] = a['date_from'] temp['dt_to'] = a['date_to'] df1 = df1.append(temp, ignore_index=True) # 500 res = requests.get(url+str(userId)+"/hosts/"+host_id+"/search-queries/popular/?order_by=TOTAL_SHOWS&query_indicator=TOTAL_CLICKS", headers=headers) df2 = pd.DataFrame(columns=['query_id', 'clicks']) a = json.loads(res.text) for i in a['queries']: temp={} temp['query_id'] = i['query_id'] temp['clicks'] = i['indicators']['TOTAL_CLICKS'] df2 = df2.append(temp, ignore_index=True) # 500 res = requests.get(url+str(userId)+"/hosts/"+host_id+"/search-queries/popular/?order_by=TOTAL_SHOWS&query_indicator=AVG_SHOW_POSITION", headers=headers) df3 = pd.DataFrame(columns=['query_id', 'position']) a = json.loads(res.text) for i in a['queries']: temp={} temp['query_id'] = i['query_id'] temp['position'] = i['indicators']['AVG_SHOW_POSITION'] df3 = df3.append(temp, ignore_index=True) df1 = df1.merge(df2, on='query_id') df1 = df1.merge(df3, on='query_id') to_sql_server(df1, 'yandex_positions')
Page Speed Insider
Allows you to evaluate the download speed of site content. If the site began to load more slowly, then this can significantly reduce the position of the site in search results.
# -50 conn = pymssql.connect(host=host,user=user,password=password) sql_string = r''' ;with a as( select distinct page, sum(clicks) as clicks from seo_google_positions group by page ) select top 50 page from a order by clicks desc ''' data = pd.read_sql(sql_string, conn) conn.close() # dat = pd.DataFrame(columns=['first_cpu_idle', 'first_contentful_paint', 'page', 'dt']) for i, j in data.iterrows(): url = "https://www.googleapis.com/pagespeedonline/v5/runPagespeed?url={0}&category=performance&strategy=desktop".format(j[0]) res = requests.get(url) res = json.loads(res.text) temp = {} temp['first_cpu_idle'] = res['lighthouseResult']['audits']['first-cpu-idle']['displayValue'] temp['first_contentful_paint'] = res['lighthouseResult']['audits']['first-contentful-paint']['displayValue'] temp['page'] = j[0] temp['dt'] = now.strftime("%Y-%m-%d") dat = dat.append(temp, ignore_index = True) to_sql_server(dat, 'google_pagespeed')
Google Ads and Yandex.Direct
To estimate the frequency of search queries, we unload the frequency of our SEO core.
Yandex budget forecast
Google Keyword Planner
Yandex Metric
Upload data on views and visits to login pages from SEO traffic.
token = token headers = {"Authorization": "OAuth " + token} now = datetime.now() fr = (now - timedelta(days = 9)).strftime("%Y-%m-%d") to = (now - timedelta(days = 3)).strftime("%Y-%m-%d") res = requests.get("https://api-metrika.yandex.net/stat/v1/data/?ids=ids&metrics=ym:s:pageviews,ym:s:visits&dimensions=ym:s:startURL,ym:s:lastsignSearchEngine,ym:s:regionCountry,ym:s:deviceCategory&date1={0}&date2={1}&group=all&filters=ym:s:lastsignTrafficSource=='organic'&limit=50000".format(fr,to), headers=headers) a = json.loads(res.text) re = pd.DataFrame(columns=['page', 'device', 'view', 'dt_from', 'dt_to', 'engine', 'visits', 'country', 'pageviews']) for i in a['data']: temp={} temp['page'] = i['dimensions'][0]['name'] temp['engine'] = i['dimensions'][1]['name'] temp['country'] = i['dimensions'][2]['name'] temp['device'] = i['dimensions'][3]['name'] temp['view'] = i['metrics'][0] temp['visits'] = i['metrics'][1] temp['pageviews'] = i['metrics'][0] temp['dt_from'] = fr temp['dt_to'] = to re=re.append(temp, ignore_index=True) to_sql_server(re, 'yandex_pages')
Data Acquisition in Power BI
Let's see what we managed to unload:
- google_positions and yandex_positions
- google_frequency and yandex_frequency
- google_speed and yandex_speed
- yandex_metrika
From this data we will be able to collect dynamics by week, by segment, general data by segments and requests, dynamics and general data by pages and speed of loading content. This is what the final report might look like:
On the one hand, there are a lot of different signs and it is difficult to understand what are the general trends. On the other hand, each plate displays important data on positions, impressions, clicks, CTR, page load speed.
Articles from the cycle:
All Articles