How to conduct A / B testing at 15,000 offline stores
Hello! Connected Big Data Ad-hoc analytics team from X5 Retail Group.
In this article, we will talk about our A / B testing methodology and the challenges we face daily.
Big Data X5 employs about 200 people, including 70 the date of Scientists and the date of analysts. Our main part is engaged in specific products - demand, assortment, promotion campaigns, etc. In addition to them, there is our separate Ad-hoc analytics team.
We:
The situation in which we work is very different from typical A / B tests. Typically, the technique is associated with online and online metrics: how the changes affected conversion, retention, CTR, etc. Most of the experiments are related to interface changes: rearranged the banner, repainted the button, replaced the text, etc.
X5 business is different - it is live 15,000 offline stores of various formats, distributed throughout the country. This feature imposes certain restrictions. Firstly, the set of metrics that can be tested varies greatly, and secondly, the restriction on experiments is imposed. The task of changing the design of a storefront of an online store is not comparable in terms of labor to the task of changing the order of departments in offline stores.
The company has a team that is engaged in a loyalty program and their pilots are closest to the classic idea of A / B testing. The questions that come to us are very atypical for “ordinary” A / B tests. For example:
Customers believe that a certain change will positively affect one of the indicators (we will talk about them later). Our job is to help them validate their hypotheses based on data.
What indicators are we testing? RTO , average check and traffic are the most frequently used words in our open space wing.
One of the main metrics for business and the most difficult to test.
The store’s daily turnover is measured in millions of rubles. Accordingly, the spread of the indicator is measured in at least thousands of rubles. The complex and long formula for determining the size of the sample says that the greater the variance, the more data is needed for any meaningful conclusions. To catch the effect even in the tenth percent with such a large dispersion of PTO, pilots in stores need to spend six months.
Imagine the reaction of the board, if at a meeting with them say that the pilot needs to spend six months, or even a year at all stores? =)
We have two standard approaches.
The first approach: we are not considering the RTO of the entire store, but some kind of product category. For example, as a result of the rearrangement of two sections in the store (“Cakes” and “Sausages”), an increase in PTO in both categories is expected. The RTO of one category is much smaller than the RTO of the entire store, therefore, the dispersion is lower. In this case, we hope that the pilot in these categories is isolated from the remaining categories.
Second approach: we sample time. The unit of observation is not the PTO of the store for the entire pilot, but the PTO per week or day. Thus, we increase the number of observations, while maintaining the variance of the raw data.
Part of the changes is aimed at making people buy more, so we test the RTO / number of checks, or the average check, if we draw analogies with the usual metrics.
The difficulty in testing this metric is related to the specifics of retail. For example, during the pilot launch of the “3 for the price of 2” campaign, a person who planned to buy one product would buy three, and the amount of the check will increase. But what if he later becomes less likely to go to the store and the pilot is actually not so successful?
To avoid erroneous conclusions when testing hypotheses that affect the average check, we simultaneously look at traffic changes. We cannot directly track how many people came to the store, as not all visitors are clients of the loyalty program, therefore for A / B testing each check is a “unique visit” to the client. By analogy with PTO, we consider traffic in different time intervals: traffic per day, traffic per hour.
The relationship between the average check and the traffic is very important: could the pilot increase the average check, but reduce the traffic and ultimately lead not to an increase in the PTO, but to its decrease? Could the pilot help increase traffic without changing the average bill?
There are pilots within which we change the price of goods - for some, the price has increased, for some on the contrary. Since we do not affect production costs, by changing prices we change the margin of goods. Such a pilot can lead to increased traffic, and to increase the average check. But does this mean that the pilot is successful and worth changing prices in all stores of the network? No, it could very well happen that people began to buy goods with a negative or small margin more often and abandoned goods with a high margin. Therefore, not always an increase in RTO is followed by an increase in the total margin; therefore, it is worth testing these indicators separately.
Well, let's say that we have decided on the target metrics. Next questions:
A / B tests conducted on online users have a significant advantage - they have a high generalizing ability. In other words, the conclusions obtained during the experiment can be scaled to all users. The generalizing ability is guaranteed by the setting of the experiment: the control and test groups are formed randomly, almost exactly both groups from the same distribution, you can catch a lot of traffic in both groups - there would be a budget.
In the case of offline retail, none of these settings work. Firstly, there is a limit on the number of stores. Secondly, stores are very different from each other. The Perekrestok store in the residential area and the Perekrestok near the business center are, in fact, very different objects from different distributions.

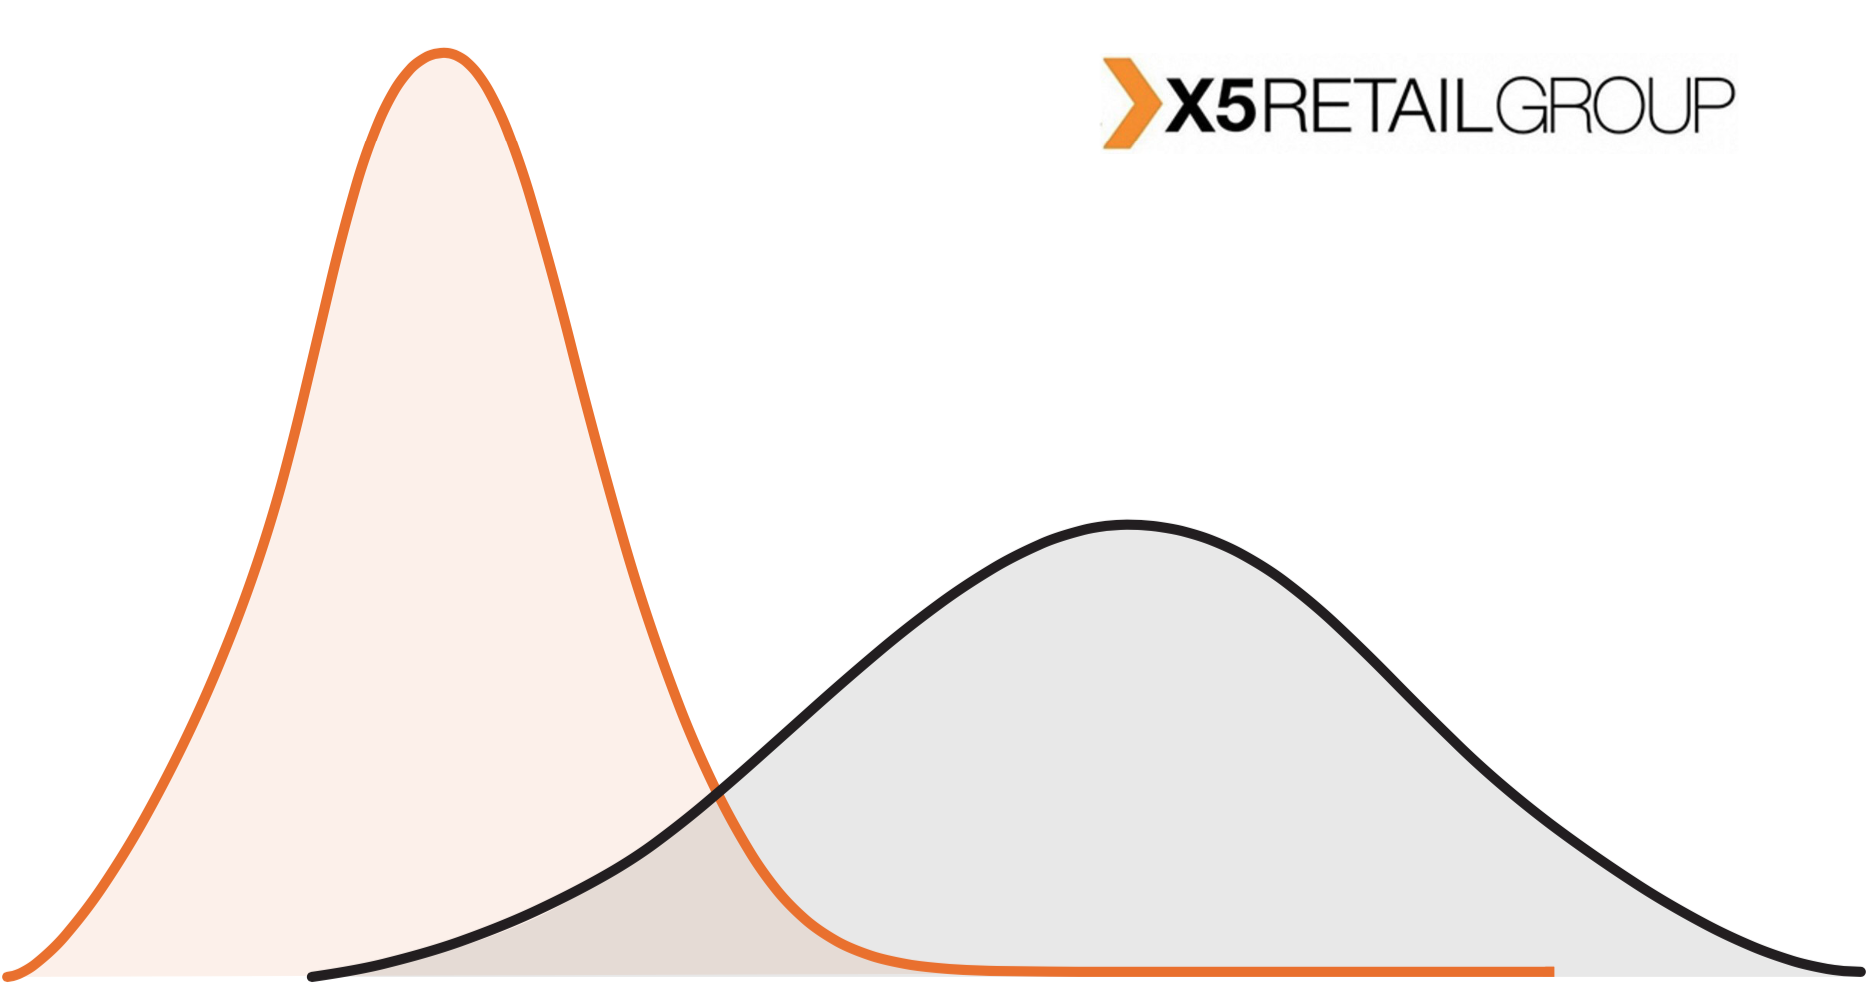
On the graph we see that the stores from the test group are different from the stores of the entire network. This is a fairly typical situation: in the Pyaterochka chain stores are located not only in cities, but also in small settlements. Large pilots are most often held in cities. Whatever effect we catch, scaling it across the entire network is wrong.
The total effect Є of the pilot we evaluate by the formula:

a is the area of intersection of the distributions of the pilot group and all stores in the network.
Note that this is not a consequence of statistical laws, but our assumption on how it is logical to consider the cumulative effect.
The ideal option seems to be to recruit a representative sample into the test group, that is, those stores that truly reflect the entire state of the network. But representativeness leads to sample heterogeneity, because shops with low or high RTO will be sampled.
And now for the most important thing - the size of the effect and the duration of the pilot. As a rule, we are faced with one of three situations:
It cannot be said that any of the scenarios is simpler, because in any case we are preparing a table of the effect-error.
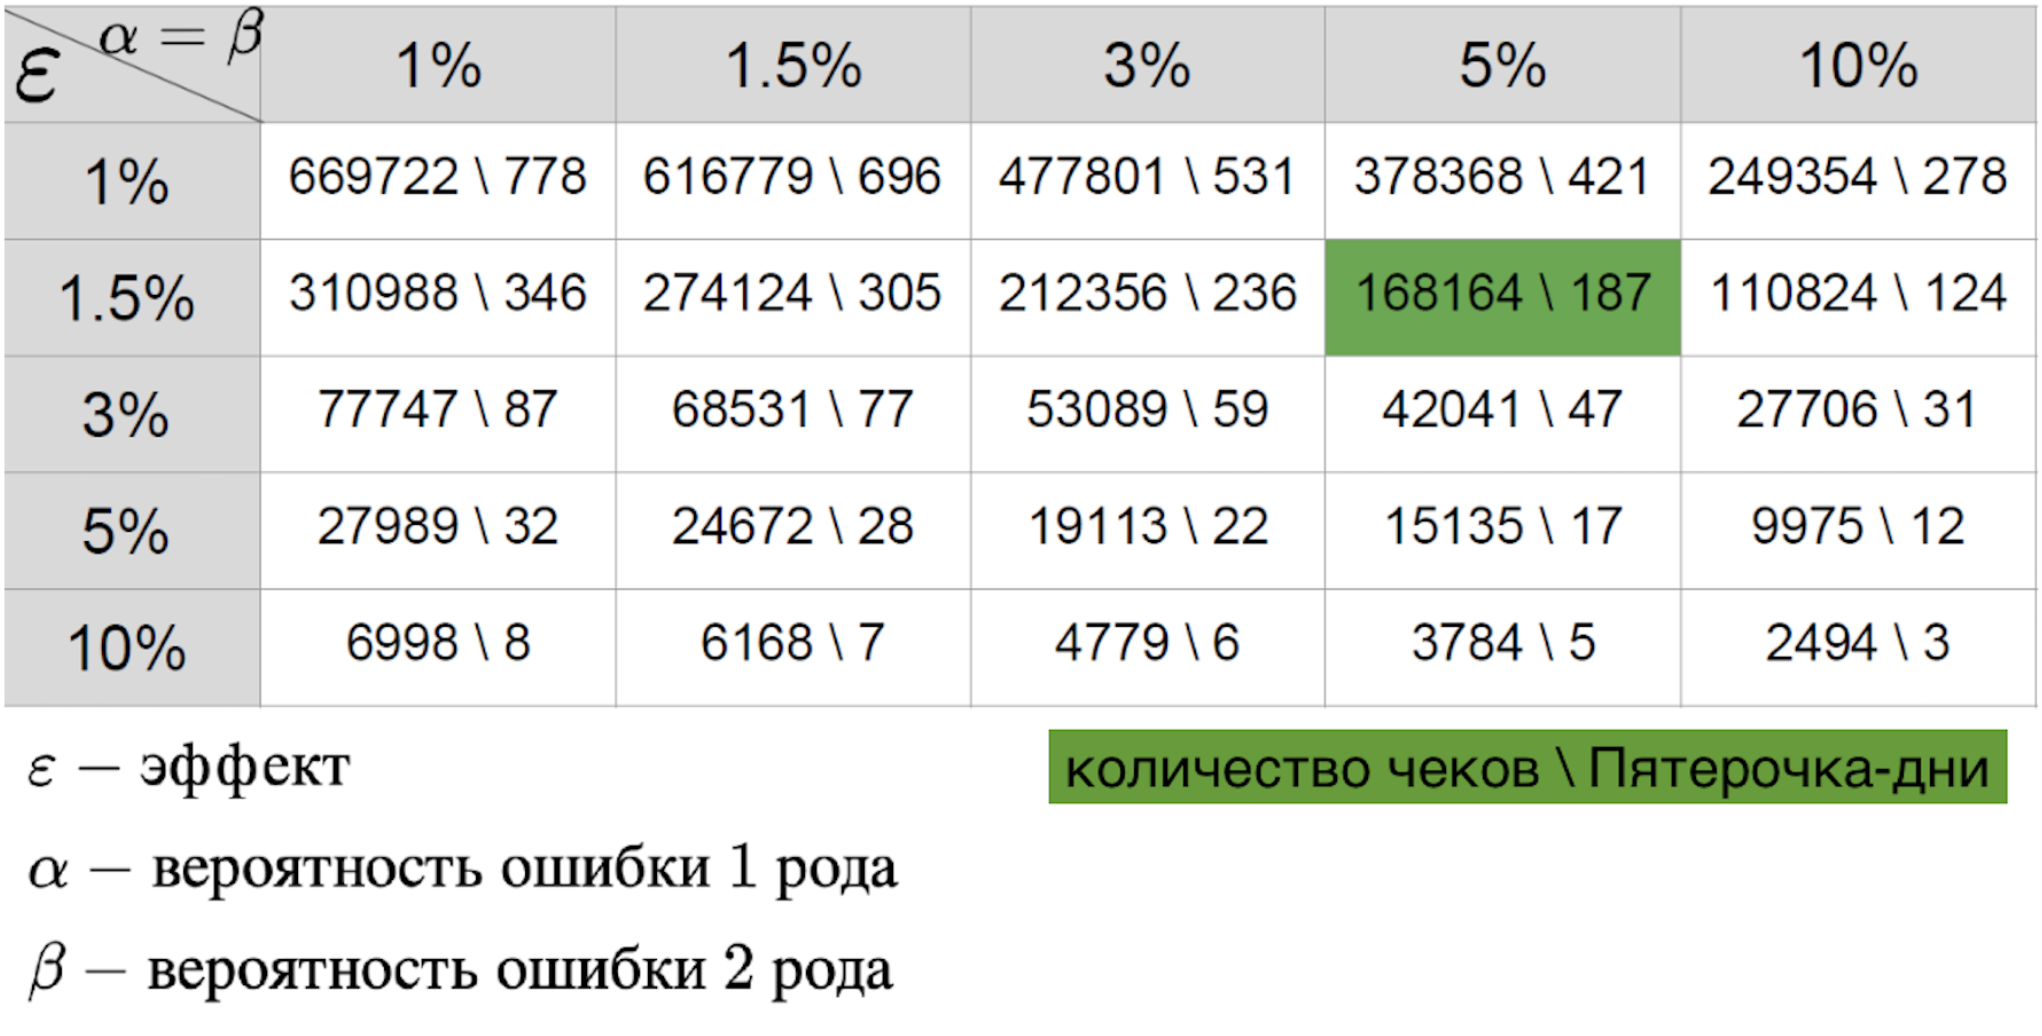
Important for her:
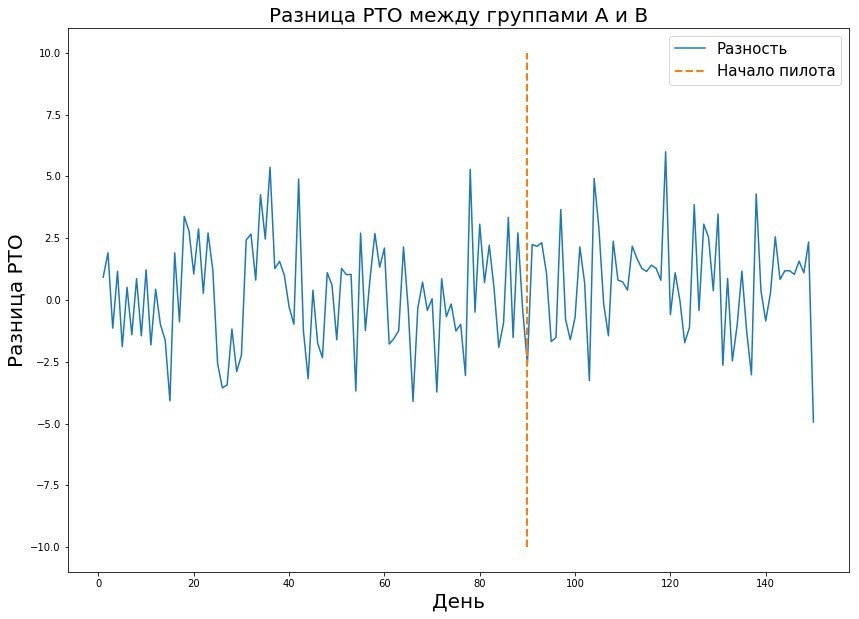
The combination of these three parameters allows you to calculate the required duration of the pilot. The value in the table is the sample size - in this case, the number of receipts or the average metric in the store per day, which are needed for the pilot. If we are talking about the real world, then usually the probability of errors of the first and second kind is 5-10 percent. As can be seen from the table, with such fixed errors, we need 421 Pyaterochka-day to catch the effect of one percent. It seems that the figure is pretty good - after all, 421 Pyaterochka-day is a pilot in 40 stores for 10 days. However, there is one “but” - there are very few pilots who really expect a one percent effect. Usually we are talking about tenths of a percent. Given that RTO is measured in billions, a tenth of a percent of the effect of a successful pilot can give a large increase in revenue. Because of this, I want to measure even the smallest effect. But the smaller the effect size, the higher the error of the second kind. This is understandable: the small effect is similar to random noise and will rarely be considered a real deviation from the norm. This is clearly seen in the graph below, where we want to catch a small effect in data with large variance.

Before the pilot starts, you need to decide on the test and control group. The customer may or may not have a pilot group. We are ready to help him in both cases by requesting restrictions - for example, stores should be strictly of three specific regions.
Suppose that we have chosen in some way a test and control group. How to be sure that the selected groups are good and you can really conduct A / B testing on them? It seems that everything sounds harmonious: we scored the required number of observations, according to the formula we can catch the effect of 0.7%, we found similar stores. What now does not suit us?
Unfortunately, there are many serious facts:
All these problems are not taken into account in the calculation of the formula for selecting the number of observations depending on errors and effect. To understand the extent of the impact of the above problems, we conduct A / A testing. In fact, this is a simulation of the entire pilot in stores at a time when there is no pilot in stores. This period is called pre-pilot.

During the pre-pilot period, we repeat three steps many times:

We do not invent a bicycle, so we are looking for similar groups with the good old method of nearest neighbors. The strategy of generating features for the store is a separate art. We found three working methods:
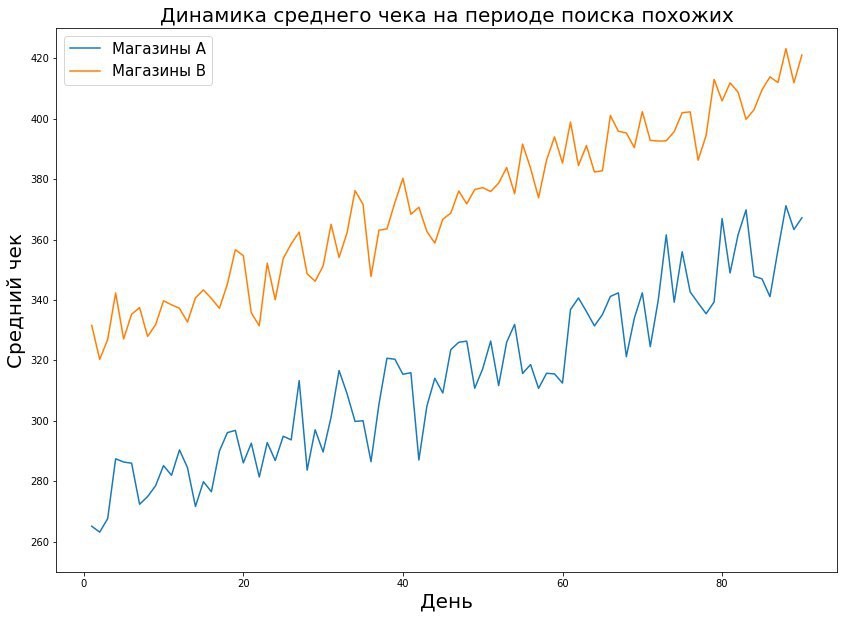
We adhere to a very simple hypothesis: if the stores were similar before the pilot, then had there not been a pilot change, they would have remained similar.
You can notice that even in these three working methods there are many aspects that can be varied: the number of days / weeks by which the feature is considered, the method of assessing the dynamics of the indicator, etc.
There is no universal pill, in each experiment we go through different options based on our goal. But it is very simple: find a method for selecting the nearest neighbors that gives reasonable errors of the first and second kind. Where they come from, we tell further.
Recall that at this point we:
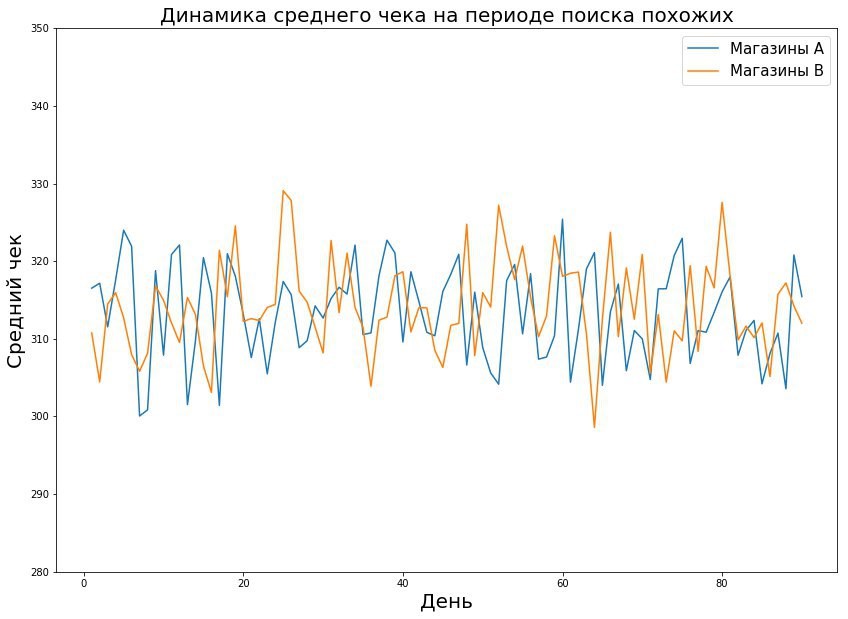
The objective of this stage is to make sure that the method we selected in Section 3 finds such groups that before the pilot starts the indicator (RTO, average check, traffic) in these stores is not statistically different.
In the cycle, we select the selected groups repeatedly for equality with some kind of statistical test and bootstrap. If the proportion of errors (i.e., the groups are not equal to each other) is higher than the threshold, then the method is rejected and a new one is selected. So until we reach the desired threshold of error.

It is important to find out how often we catch the effect when it is not there, i.e. whether our selection method responds to random differences between stores or not.
It’s a reasonable question, but are we not retraining so that we also perceive the real effects as noise and ignore them? In other words, are we able to detect an effect when it is?
After making sure at the last step that the groups coincide, we add an artificial effect to one of the groups, i.e. We guarantee that the pilot is successful and the effect should be.
This time, the goal is to find out how often the equality hypothesis is rejected, i.e. the test was able to distinguish between two groups. The mistake in this case is to assume that the groups are equal. We call this mistake a mistake of the second kind.
Again in the cycle we test for equality the control group and the “noisy” test group. If we make mistakes quite rarely, then we believe that the method of selecting groups has passed validation. It can be used to select groups in the pilot period and be sure that if the pilot gives an effect, we will be able to detect it.

We have already mentioned that data heterogeneity is one of the worst enemies we are fighting. Inhomogeneities arise from various root causes:
The heterogeneity increases the variance, which, as mentioned above, in evaluating the PTO of stores is already of great importance. The size of the captured effect directly depends on the variance. For example, reducing the dispersion by a factor of four makes it possible to detect a half effect.
In the simplest case, we are fighting linearization heterogeneity.
Suppose we had a pilot in two stores for three days (yes, this contradicts all the prescribed formulas about the size of the effect, but this is an example). Average RTOs in stores are respectively 200 thousand and 500 thousand, while the variance in both groups is 10,000, and according to all observations - 35,000
After the pilot, the averages are in the 300 and 600 groups and the variances are 10,000 and 22,500, respectively, and the entire group is 40,000.

A simple and elegant move is to linearize the data, i.e. subtract from each period value the average for the previous one.

At the output, the sample: 100, 0, 200, -50, 100, 250. The dispersion in the pilot period was reduced by 3 times to 13000.
This means that we can see a much more subtle effect than with the original absolute values.
This is not the only way to deal with heterogeneity. We will talk about others in the next article.
Preparation for large pilots and their assessment pass through our team and are thoroughly tested.
Our protocol:
None of these stages pass without difficulties; each of them has features. How we deal with some of them, we described in this article. In the next, we’ll talk about ....
In the end, I would like to mention all the actors:
In this article, we will talk about our A / B testing methodology and the challenges we face daily.
Big Data X5 employs about 200 people, including 70 the date of Scientists and the date of analysts. Our main part is engaged in specific products - demand, assortment, promotion campaigns, etc. In addition to them, there is our separate Ad-hoc analytics team.
We:
- we help business units with data analysis requests that do not fit into existing products;
- we help product teams if they need extra hands;
- We are engaged in A / B testing - and this is the main function of the team.
The situation in which we work is very different from typical A / B tests. Typically, the technique is associated with online and online metrics: how the changes affected conversion, retention, CTR, etc. Most of the experiments are related to interface changes: rearranged the banner, repainted the button, replaced the text, etc.
X5 business is different - it is live 15,000 offline stores of various formats, distributed throughout the country. This feature imposes certain restrictions. Firstly, the set of metrics that can be tested varies greatly, and secondly, the restriction on experiments is imposed. The task of changing the design of a storefront of an online store is not comparable in terms of labor to the task of changing the order of departments in offline stores.
The company has a team that is engaged in a loyalty program and their pilots are closest to the classic idea of A / B testing. The questions that come to us are very atypical for “ordinary” A / B tests. For example:
- How will the financial performance of the store change if I change the order of the Sausage and Cakes departments?
- How will the model of customer churn affect the financial result?
- How will setting postamates affect store performance?
Customers believe that a certain change will positively affect one of the indicators (we will talk about them later). Our job is to help them validate their hypotheses based on data.
Metrics
What indicators are we testing? RTO , average check and traffic are the most frequently used words in our open space wing.
- RTO (retail turnover) - the amount of money earned by the store.
One of the main metrics for business and the most difficult to test.
The store’s daily turnover is measured in millions of rubles. Accordingly, the spread of the indicator is measured in at least thousands of rubles. The complex and long formula for determining the size of the sample says that the greater the variance, the more data is needed for any meaningful conclusions. To catch the effect even in the tenth percent with such a large dispersion of PTO, pilots in stores need to spend six months.
Imagine the reaction of the board, if at a meeting with them say that the pilot needs to spend six months, or even a year at all stores? =)
We have two standard approaches.
The first approach: we are not considering the RTO of the entire store, but some kind of product category. For example, as a result of the rearrangement of two sections in the store (“Cakes” and “Sausages”), an increase in PTO in both categories is expected. The RTO of one category is much smaller than the RTO of the entire store, therefore, the dispersion is lower. In this case, we hope that the pilot in these categories is isolated from the remaining categories.
Second approach: we sample time. The unit of observation is not the PTO of the store for the entire pilot, but the PTO per week or day. Thus, we increase the number of observations, while maintaining the variance of the raw data.
- Average check , or RTO / number of checks - the average amount of money in one check.
Part of the changes is aimed at making people buy more, so we test the RTO / number of checks, or the average check, if we draw analogies with the usual metrics.
The difficulty in testing this metric is related to the specifics of retail. For example, during the pilot launch of the “3 for the price of 2” campaign, a person who planned to buy one product would buy three, and the amount of the check will increase. But what if he later becomes less likely to go to the store and the pilot is actually not so successful?
- Traffic - the number of checks in the store for a certain period of time.
To avoid erroneous conclusions when testing hypotheses that affect the average check, we simultaneously look at traffic changes. We cannot directly track how many people came to the store, as not all visitors are clients of the loyalty program, therefore for A / B testing each check is a “unique visit” to the client. By analogy with PTO, we consider traffic in different time intervals: traffic per day, traffic per hour.
The relationship between the average check and the traffic is very important: could the pilot increase the average check, but reduce the traffic and ultimately lead not to an increase in the PTO, but to its decrease? Could the pilot help increase traffic without changing the average bill?
- Margin - the difference between the price of a product and its cost
There are pilots within which we change the price of goods - for some, the price has increased, for some on the contrary. Since we do not affect production costs, by changing prices we change the margin of goods. Such a pilot can lead to increased traffic, and to increase the average check. But does this mean that the pilot is successful and worth changing prices in all stores of the network? No, it could very well happen that people began to buy goods with a negative or small margin more often and abandoned goods with a high margin. Therefore, not always an increase in RTO is followed by an increase in the total margin; therefore, it is worth testing these indicators separately.
Well, let's say that we have decided on the target metrics. Next questions:
- What size effect does the customer plan to receive?
- What effect can actually be detected in the experiment?
- How long does the experiment take?
- Which groups?
Experiment Summary
A / B tests conducted on online users have a significant advantage - they have a high generalizing ability. In other words, the conclusions obtained during the experiment can be scaled to all users. The generalizing ability is guaranteed by the setting of the experiment: the control and test groups are formed randomly, almost exactly both groups from the same distribution, you can catch a lot of traffic in both groups - there would be a budget.
In the case of offline retail, none of these settings work. Firstly, there is a limit on the number of stores. Secondly, stores are very different from each other. The Perekrestok store in the residential area and the Perekrestok near the business center are, in fact, very different objects from different distributions.
On the graph we see that the stores from the test group are different from the stores of the entire network. This is a fairly typical situation: in the Pyaterochka chain stores are located not only in cities, but also in small settlements. Large pilots are most often held in cities. Whatever effect we catch, scaling it across the entire network is wrong.
The total effect Є of the pilot we evaluate by the formula:
a is the area of intersection of the distributions of the pilot group and all stores in the network.
Note that this is not a consequence of statistical laws, but our assumption on how it is logical to consider the cumulative effect.
The ideal option seems to be to recruit a representative sample into the test group, that is, those stores that truly reflect the entire state of the network. But representativeness leads to sample heterogeneity, because shops with low or high RTO will be sampled.
Group sizes, pilot duration, and minimal detectable effect
And now for the most important thing - the size of the effect and the duration of the pilot. As a rule, we are faced with one of three situations:
- the customer has a time limit for the pilot and the number of stores with which you can work;
- the customer knows what effect size he expects to receive and asks to indicate the number of stores that the pilot needs (and then the stores themselves);
- the customer is open to our offers.
It cannot be said that any of the scenarios is simpler, because in any case we are preparing a table of the effect-error.
Important for her:
- error of the first kind - the probability of seeing the effect when it is not there;
- a mistake of the second kind - the probability of skipping an effect when it is;
- the size of the effect that is expected to be seen with a successful pilot.
The combination of these three parameters allows you to calculate the required duration of the pilot. The value in the table is the sample size - in this case, the number of receipts or the average metric in the store per day, which are needed for the pilot. If we are talking about the real world, then usually the probability of errors of the first and second kind is 5-10 percent. As can be seen from the table, with such fixed errors, we need 421 Pyaterochka-day to catch the effect of one percent. It seems that the figure is pretty good - after all, 421 Pyaterochka-day is a pilot in 40 stores for 10 days. However, there is one “but” - there are very few pilots who really expect a one percent effect. Usually we are talking about tenths of a percent. Given that RTO is measured in billions, a tenth of a percent of the effect of a successful pilot can give a large increase in revenue. Because of this, I want to measure even the smallest effect. But the smaller the effect size, the higher the error of the second kind. This is understandable: the small effect is similar to random noise and will rarely be considered a real deviation from the norm. This is clearly seen in the graph below, where we want to catch a small effect in data with large variance.
A / A testing
Before the pilot starts, you need to decide on the test and control group. The customer may or may not have a pilot group. We are ready to help him in both cases by requesting restrictions - for example, stores should be strictly of three specific regions.
Suppose that we have chosen in some way a test and control group. How to be sure that the selected groups are good and you can really conduct A / B testing on them? It seems that everything sounds harmonious: we scored the required number of observations, according to the formula we can catch the effect of 0.7%, we found similar stores. What now does not suit us?
Unfortunately, there are many serious facts:
- elements of the sample are not from the same distribution — our sample is a mixture of observations from different stores, and each store has its own distribution.
- the elements of the sample are not independent - the sample contains many observations from one store, respectively, there is a connection between them;
- equality of means is not guaranteed in the absence of a pilot - i.e. we’re not at all sure that if there weren’t a pilot, the store’s statistics would not differ.
All these problems are not taken into account in the calculation of the formula for selecting the number of observations depending on errors and effect. To understand the extent of the impact of the above problems, we conduct A / A testing. In fact, this is a simulation of the entire pilot in stores at a time when there is no pilot in stores. This period is called pre-pilot.
During the pre-pilot period, we repeat three steps many times:
- selection of similar groups;
- equality testing in two groups;
- adding effect to the test group and testing the means for equality.
Matching similar groups
We do not invent a bicycle, so we are looking for similar groups with the good old method of nearest neighbors. The strategy of generating features for the store is a separate art. We found three working methods:
- Each store is described by a feature vector according to the metric we are testing. For example, when examining an average check, we describe daily average checks for 8 weeks - we get 56 signs for the store. Then we take the Euclidean distance between the signs of a pair of stores.
- Find stores similar in dynamics. Stores may differ in absolute values of metrics, but coincide in trends - and with certain mathematical manipulations, these stores can be considered the same.
- Predict the store’s performance over the pilot’s period (in the future) and select similar ones based on them - but here we need an oracle who can predict the performance for the pilot quite accurately.
We adhere to a very simple hypothesis: if the stores were similar before the pilot, then had there not been a pilot change, they would have remained similar.
You can notice that even in these three working methods there are many aspects that can be varied: the number of days / weeks by which the feature is considered, the method of assessing the dynamics of the indicator, etc.
There is no universal pill, in each experiment we go through different options based on our goal. But it is very simple: find a method for selecting the nearest neighbors that gives reasonable errors of the first and second kind. Where they come from, we tell further.
Testing for equality of means, or an error of the first kind of method
Recall that at this point we:
- determined with the customer the size of the effect and the duration of the pilot
- explained the essence of mistakes of the first and second kind
- built a method for selecting similar groups
The objective of this stage is to make sure that the method we selected in Section 3 finds such groups that before the pilot starts the indicator (RTO, average check, traffic) in these stores is not statistically different.
In the cycle, we select the selected groups repeatedly for equality with some kind of statistical test and bootstrap. If the proportion of errors (i.e., the groups are not equal to each other) is higher than the threshold, then the method is rejected and a new one is selected. So until we reach the desired threshold of error.
It is important to find out how often we catch the effect when it is not there, i.e. whether our selection method responds to random differences between stores or not.
Adding an effect, or a mistake of the second kind of method
It’s a reasonable question, but are we not retraining so that we also perceive the real effects as noise and ignore them? In other words, are we able to detect an effect when it is?
After making sure at the last step that the groups coincide, we add an artificial effect to one of the groups, i.e. We guarantee that the pilot is successful and the effect should be.
This time, the goal is to find out how often the equality hypothesis is rejected, i.e. the test was able to distinguish between two groups. The mistake in this case is to assume that the groups are equal. We call this mistake a mistake of the second kind.
Again in the cycle we test for equality the control group and the “noisy” test group. If we make mistakes quite rarely, then we believe that the method of selecting groups has passed validation. It can be used to select groups in the pilot period and be sure that if the pilot gives an effect, we will be able to detect it.
About heterogeneity
We have already mentioned that data heterogeneity is one of the worst enemies we are fighting. Inhomogeneities arise from various root causes:
- shopping heterogeneity - each store has its own average value by metric (in Moscow RTO stores and traffic is much more than in village stores)
- heterogeneity by day of the week - different distribution of traffic and different average check on different days of the week: traffic on Tuesday does not look like traffic on Friday
- heterogeneity in weather - people go shopping differently in different weather conditions
- heterogeneity in time of year - traffic in the winter months differs from traffic in the summer - this must be taken into account if the pilot lasts several weeks.
The heterogeneity increases the variance, which, as mentioned above, in evaluating the PTO of stores is already of great importance. The size of the captured effect directly depends on the variance. For example, reducing the dispersion by a factor of four makes it possible to detect a half effect.
In the simplest case, we are fighting linearization heterogeneity.
Suppose we had a pilot in two stores for three days (yes, this contradicts all the prescribed formulas about the size of the effect, but this is an example). Average RTOs in stores are respectively 200 thousand and 500 thousand, while the variance in both groups is 10,000, and according to all observations - 35,000
After the pilot, the averages are in the 300 and 600 groups and the variances are 10,000 and 22,500, respectively, and the entire group is 40,000.
A simple and elegant move is to linearize the data, i.e. subtract from each period value the average for the previous one.
At the output, the sample: 100, 0, 200, -50, 100, 250. The dispersion in the pilot period was reduced by 3 times to 13000.
This means that we can see a much more subtle effect than with the original absolute values.
This is not the only way to deal with heterogeneity. We will talk about others in the next article.
General approach to A / B testing
Preparation for large pilots and their assessment pass through our team and are thoroughly tested.
Our protocol:
- receive information from the customer about the metric and the expected effect;
- determine the size of the groups and the duration of the pilot;
- to develop an algorithm for distributing stores into groups;
- conduct an A / A test between groups and validate this algorithm;
- wait for the pilot to finish and calculate the effect.
None of these stages pass without difficulties; each of them has features. How we deal with some of them, we described in this article. In the next, we’ll talk about ....
Team
In the end, I would like to mention all the actors:
- Valery Babushkin
- Alexander Sakhnov
- Denis Ivanov
- Sergey Demchenko
- Nikolay Nazarov
- Sergey Kabanov
- Yuri Galimullin
- Helen Tevanyan
- Vladislav Ladenkov
- Sergey Zakharov
- Vasily Rasskazov
- Alexander Belyaev
- Kismat Magomedov
- Egor Krashennikov
- Egor Karnaukh
- Svyatoslav Oreshin
- Yuri Trubitsyn
All Articles