Information tools or how we talk about our services and processes
Habr, hello!
Everyone who worked in at least one large geographically distributed company with a network of branches throughout the country, faced with the problem: “How to inform interested parties about the services and services that you provide within your unit? How to avoid duplication of reports / functional development due to the fragmentation of IT teams from different regions of a vast country, how to centralize data and reporting, how to reduce the company's costs for developing reports? ”
This issue has not passed our team, the business intelligence team for data management. But how to convey information about what we currently have, what projects we are working on, and how to interact with us? We will talk about our communication tools and I hope you share your recommendations.
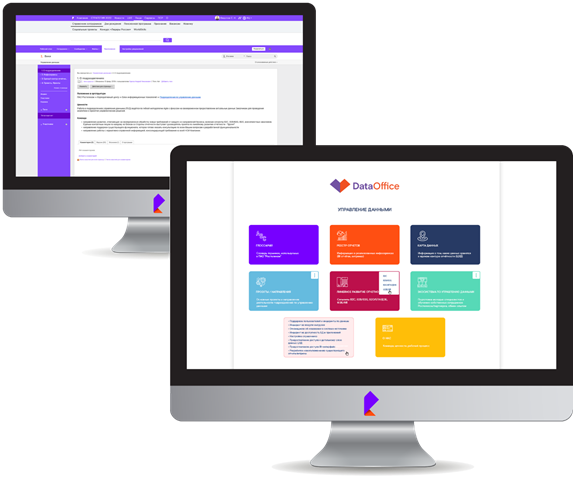
What we started with is building a portal. For a quick start, a wiki was raised in which they reflected the main aspects of their services and processes. Then they parallelized their activities. On the one hand, they began to work on a full-fledged portal with a convenient and functional interface. On the other hand, they were filling content on the wiki with a view to its further reuse.
So, let's talk about the content that we want to broadcast. Our main goal was to make the database of reports implemented in the company - “Report Registry”. The idea is great, but ... the question immediately arises: “What data should be indicated in the registry so that the user understands what kind of report it is and whether it suits him?”
Indeed, if we indicate the name, then this will obviously not be enough, and if we indicate everything that we know from the report, including the technological stack, it will be a clear excess of information, which can frighten off.
Then where is this middle ground that will allow the user to understand the main important information on the report, but will not be redundant for him? Everyone will probably answer this question in their own way, but we will share with you our approach in compiling the list:
And now in order.
In large companies, everyone speaks different languages. For one department, the address is the registration address, and for the other, the address of the actual residence.
How to solve this problem? A single dictionary of highly specialized terms, abbreviations and concepts comes to the aid - a glossary. To the development of which we started.
In the registry, we reflected all the reports, but there were a lot of them. It is not necessary to rely on the user to see everything that is listed in it. Keyword searches may not always work correctly. To assist in the search, we divided all reports by subject areas and displayed this field in the filters.
And what else can be included in the register for the purpose of informing? It’s already at your discretion, but there are still many options: the reporting customer (i.e., who generally set the requirements for these reports), the initial sources of information (i.e. where the data gets to the storage from), a visualization tool, and much more.
Is the registry enough to solve the needs of the user without a detailed description of the attribute composition? Of course not. And for each report, we began to prepare this description.
Of course, to indicate just the name of the attribute will be small. Therefore, we decided to indicate the following points:
And now we have a convenient tool for viewing reports implemented in the company, and this is already a huge victory. And BUT again appears ...
But what is the relationship between the Report Registry and the general report description, the report registry with a detailed description of the report and the glossary?
To answer this question, let's look at the diagram:
So, the user can start the search either from the report registry with a general description, or from the glossary.
And then the transitions are configured:
So we were able to connect the two main reporting tools for the implemented reporting and lay the foundation for a complete Data Lineage process.
But these are not all the information services that we have implemented. In addition to the developed reporting, we wanted to show what data we have in the repository and how often it is downloaded. For these purposes, we published a Data Map on the portal.
Since we needed a simple, understandable tool that any interested user could use, we made a dashboard consisting of two tabs:
Judging by the feedback received, this tool turned out to be very useful for our users and business customers. Without contacting the specialists of our department, they were able to get a general idea of the data that we operate in the repository.
What else would you like to convey about the portal? In addition to the information services that tell us about what has been implemented, we have posted sections on current activities on the portal. Our activities are divided into two large streams - these are linear development and projects. As part of the linear development, we are developing reporting on the current needs of business customers, and in the framework of projects, major infrastructure activities related to the development of the warehouse itself. So on the portal we publish all the information about these activities - goals, objectives, project participants, work plan, milestones.
If you thought that we were fixated on the portal, then this is not so. To ensure the transparency of the processes and inform customers about the stages of the tasks, we took up Jira. At its core, Jira is a system that is more suitable for organizing support and development. But the downside of Jira is that it has virtually no time management capabilities. Schedule dates have to do outside, for example, in MS Project.
How to give the customer the familiar time-planning format in a modern work organization tool of our unit? For ourselves, we found a solution in installing the BigGantt plugin.

What new features this plugin brought to JIRA functionality:
As a result, the customer got the opportunity at any time to see the actual statistics on the implementation of tasks in the form of a report and a Gantt chart.
Everything seems to be clear with the portal tools. But how to make sure that users find out about our products as they appear and launch on the market? To solve this problem, we have introduced the practice of sending regular digests. The format and content of the digest was processed several times before leaving for the newsletter. But in the end, we came to the most convenient approach:
When the digest is ready, the question arises with the recipients: to whom to send it and how to create a mailing list? Initially, we prepared the mailing list based on feedback from the business partners of the directions. Then they asked for recommendations on contacts from the recipients themselves. So we got a list covering the main target audience. For the rest of those interested in the newsletter, they worked out the opportunity to subscribe independently on the DataOffice portal, or to submit an appeal to a single mailbox.

The next way of informing, which we began to use at home, is through webinars. At webinars, we talk about our processes, approaches to the implementation of tasks, about the main areas of activity for the linear development of reporting, a plan / fact on the implementation of reporting tasks. This format turned out to be very convenient, since you could immediately get feedback and discuss open issues.
So that useful information is not lost anywhere and can be quickly obtained, we save all webinars on the portal.
But we did not stop at these methods of informing, we began to actively interact with colleagues in the framework of the Guilds, self-organized communities of specialists from different directions and projects. Our company has already launched guilds of architects, project managers, and analysts. Inside the guild, we discuss common practices, develop a joint toolkit and approach. Now we are actively developing the “internal mitapnaya” project, designed to increase the effectiveness of mitaps and interest other colleagues in connecting to them.
So far, that's all we wanted to tell you about our tools. But we do not stop there and continue to work on the development of our communications. We will be glad if our experience is useful for you!
DataOffice Team
Everyone who worked in at least one large geographically distributed company with a network of branches throughout the country, faced with the problem: “How to inform interested parties about the services and services that you provide within your unit? How to avoid duplication of reports / functional development due to the fragmentation of IT teams from different regions of a vast country, how to centralize data and reporting, how to reduce the company's costs for developing reports? ”
This issue has not passed our team, the business intelligence team for data management. But how to convey information about what we currently have, what projects we are working on, and how to interact with us? We will talk about our communication tools and I hope you share your recommendations.
What we started with is building a portal. For a quick start, a wiki was raised in which they reflected the main aspects of their services and processes. Then they parallelized their activities. On the one hand, they began to work on a full-fledged portal with a convenient and functional interface. On the other hand, they were filling content on the wiki with a view to its further reuse.
So, let's talk about the content that we want to broadcast. Our main goal was to make the database of reports implemented in the company - “Report Registry”. The idea is great, but ... the question immediately arises: “What data should be indicated in the registry so that the user understands what kind of report it is and whether it suits him?”
Indeed, if we indicate the name, then this will obviously not be enough, and if we indicate everything that we know from the report, including the technological stack, it will be a clear excess of information, which can frighten off.
Then where is this middle ground that will allow the user to understand the main important information on the report, but will not be redundant for him? Everyone will probably answer this question in their own way, but we will share with you our approach in compiling the list:
- The name of the report - well, everything is clear, without knowing the name, it is impossible to use the report.
- A brief description of the report - everything is clear here too, the name does not always fully reflect the essence of the report, therefore, in the brief description we indicated the main indicators and sections for which it was made.
- Reporting system - this item is relevant if you have more than one reporting system. You need to understand in which reporting system the report is implemented.
- Frequency of data availability - this can be really important for users. For example, a report is updated monthly, and for specific purposes a daily update is needed.
- The depth of data availability - it is important to understand how much data there is in the report.
- Link to the documentation - if, having looked at everything that we indicated before, the user is interested in the report, then you can go in and see a document with a more detailed description, where all the detailed requirements are described.
- Contact person - an employee who can advise colleagues in case of questions on the report.
- Link to the report - if there is an understanding that the report is suitable, then you can immediately click on the link and get into the report form.
And now in order.
1. Glossary
In large companies, everyone speaks different languages. For one department, the address is the registration address, and for the other, the address of the actual residence.
How to solve this problem? A single dictionary of highly specialized terms, abbreviations and concepts comes to the aid - a glossary. To the development of which we started.
2. The registry
In the registry, we reflected all the reports, but there were a lot of them. It is not necessary to rely on the user to see everything that is listed in it. Keyword searches may not always work correctly. To assist in the search, we divided all reports by subject areas and displayed this field in the filters.
And what else can be included in the register for the purpose of informing? It’s already at your discretion, but there are still many options: the reporting customer (i.e., who generally set the requirements for these reports), the initial sources of information (i.e. where the data gets to the storage from), a visualization tool, and much more.
Is the registry enough to solve the needs of the user without a detailed description of the attribute composition? Of course not. And for each report, we began to prepare this description.
Of course, to indicate just the name of the attribute will be small. Therefore, we decided to indicate the following points:
- The name of the attribute - everything is clear
- Attribute description - here the business meaning of the term is indicated and, if it is calculated, then the business logic of the calculation
- Attribute Type - Dimension or Metric
- Attribute category - an attribute is simply a filter, or is only reflected in the report, or is generally present both as a filter and as an attribute of the report
Glossary and registry interaction
And now we have a convenient tool for viewing reports implemented in the company, and this is already a huge victory. And BUT again appears ...
But what is the relationship between the Report Registry and the general report description, the report registry with a detailed description of the report and the glossary?
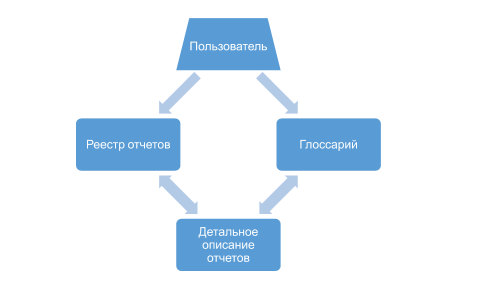
To answer this question, let's look at the diagram:
So, the user can start the search either from the report registry with a general description, or from the glossary.
And then the transitions are configured:
- Glossary - Detailed description of reports - in this transition, when you click on the name of the term, you will be taken to the page for a detailed description of the term, which displays reports that use this term. Through the name of the report, you can go to the register of reports.
- Report registry - Detailed description of reports - in this transition, when you click on the name of the report, you get to a sheet with a detailed description of the report, where the attributive structure is indicated. Through each attribute, you can go to the glossary.
So we were able to connect the two main reporting tools for the implemented reporting and lay the foundation for a complete Data Lineage process.
But these are not all the information services that we have implemented. In addition to the developed reporting, we wanted to show what data we have in the repository and how often it is downloaded. For these purposes, we published a Data Map on the portal.
3. Data card
Since we needed a simple, understandable tool that any interested user could use, we made a dashboard consisting of two tabs:
- On the main tab, we showed all the sources connected to our repository. And we have a lot of them - more than 150 pieces. But information on the name of the sources would not be useful if we did not reflect the regulations and planned dates of loading. So we added this information.
- On the second tab, we have already detailed information to tables and attributes by storage layers. The structure and description of the tables of the operating layer, loaded in source format from the source. And the structure of the analytical layer - the reporting reporting layer.
Judging by the feedback received, this tool turned out to be very useful for our users and business customers. Without contacting the specialists of our department, they were able to get a general idea of the data that we operate in the repository.
What else would you like to convey about the portal? In addition to the information services that tell us about what has been implemented, we have posted sections on current activities on the portal. Our activities are divided into two large streams - these are linear development and projects. As part of the linear development, we are developing reporting on the current needs of business customers, and in the framework of projects, major infrastructure activities related to the development of the warehouse itself. So on the portal we publish all the information about these activities - goals, objectives, project participants, work plan, milestones.
Not a single portal
If you thought that we were fixated on the portal, then this is not so. To ensure the transparency of the processes and inform customers about the stages of the tasks, we took up Jira. At its core, Jira is a system that is more suitable for organizing support and development. But the downside of Jira is that it has virtually no time management capabilities. Schedule dates have to do outside, for example, in MS Project.
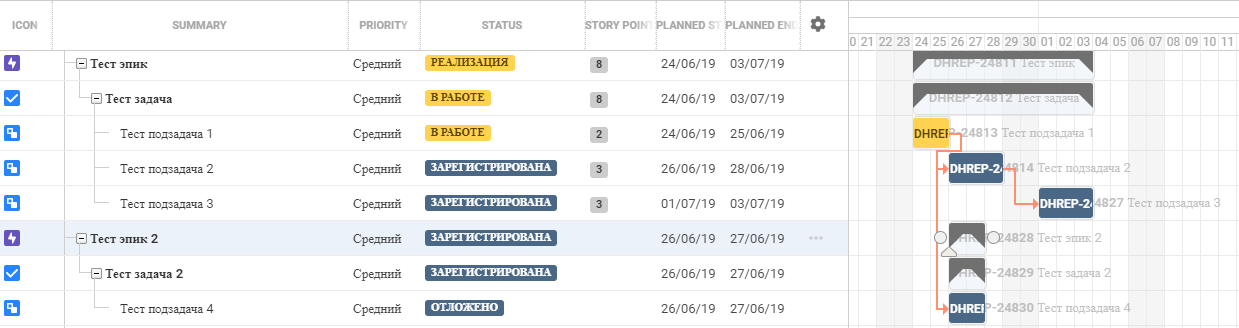
How to give the customer the familiar time-planning format in a modern work organization tool of our unit? For ourselves, we found a solution in installing the BigGantt plugin.
What new features this plugin brought to JIRA functionality:
- There is a hierarchy feature for all epics \ tasks \ subtasks
- Now you can build dependencies between tasks on the basis of the Gantt chart
- Now you can plan the upcoming sprint directly in the plugin interface
- Now you can visually display current activities in the format of a Gantt chart.
As a result, the customer got the opportunity at any time to see the actual statistics on the implementation of tasks in the form of a report and a Gantt chart.
Everything seems to be clear with the portal tools. But how to make sure that users find out about our products as they appear and launch on the market? To solve this problem, we have introduced the practice of sending regular digests. The format and content of the digest was processed several times before leaving for the newsletter. But in the end, we came to the most convenient approach:
- They reflected minimally useful information about the task, a link to business functional requirements and a contact person for the project.
- We divided digests into 2 types: monthly on linear development and quarterly on project activities.
- Responsible for preparation, verification, and agreed training regulations.
When the digest is ready, the question arises with the recipients: to whom to send it and how to create a mailing list? Initially, we prepared the mailing list based on feedback from the business partners of the directions. Then they asked for recommendations on contacts from the recipients themselves. So we got a list covering the main target audience. For the rest of those interested in the newsletter, they worked out the opportunity to subscribe independently on the DataOffice portal, or to submit an appeal to a single mailbox.
The next way of informing, which we began to use at home, is through webinars. At webinars, we talk about our processes, approaches to the implementation of tasks, about the main areas of activity for the linear development of reporting, a plan / fact on the implementation of reporting tasks. This format turned out to be very convenient, since you could immediately get feedback and discuss open issues.
So that useful information is not lost anywhere and can be quickly obtained, we save all webinars on the portal.
But we did not stop at these methods of informing, we began to actively interact with colleagues in the framework of the Guilds, self-organized communities of specialists from different directions and projects. Our company has already launched guilds of architects, project managers, and analysts. Inside the guild, we discuss common practices, develop a joint toolkit and approach. Now we are actively developing the “internal mitapnaya” project, designed to increase the effectiveness of mitaps and interest other colleagues in connecting to them.
So far, that's all we wanted to tell you about our tools. But we do not stop there and continue to work on the development of our communications. We will be glad if our experience is useful for you!
DataOffice Team
All Articles