We eat the elephant in parts. Example Application Health Monitoring Strategy
Hello!
Our company is engaged in software development and subsequent technical support. As part of technical support, you need to not just fix errors, but monitor the performance of our applications.
For example, if one of the services "crashes", then you need to automatically fix this problem and begin to solve it, and not wait for calls to technical support for dissatisfied users.
We have a small company, there are no resources to study and contain any complex solutions for monitoring applications, it was necessary to find a simple and effective solution.
Performing an application health check is not easy, this task is non-trivial, one might even say creative. It is especially difficult to test a complex multi-link system.
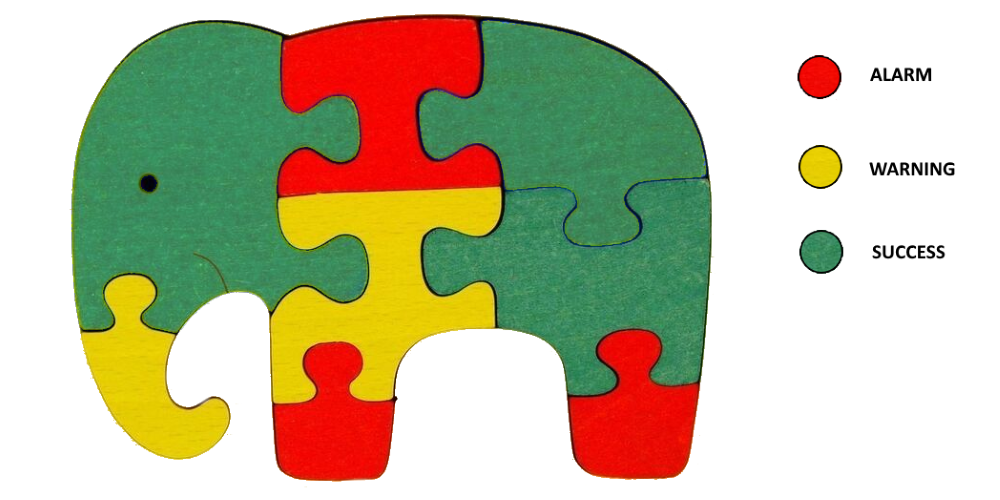
How to eat an elephant? Only in parts! We use this approach to monitor applications.
The essence of our monitoring strategy:
Thus, any system can be represented as a tree of components. Complex components are broken down into simpler ones. Simple components have checks.

Control checks should not perform functional testing; these are not unit tests. Control checks should check how the component feels at the current moment of time, whether there are all the resources necessary for its functioning, whether there are any problems.
There are no miracles, most of the checks will need to be developed independently. But do not be scared, because in most cases one check takes 5-10 lines of code, but then you can implement any logic and you will clearly understand how the check works out.
Suppose we split the application into components, invent and implement checks for each component, but what to do with the results of these checks? How do we know that some kind of check failed?
We will need a monitoring system. She will perform the following tasks:
Best explained by example. Let's see how the monitoring of the operation of the ASMO system is organized.
ASMO is an automated weather support system. The system helps road service specialists understand where and when it is necessary to treat the road with anti-icing materials. The system collects data from traffic control points. A road control point is a place on the road where the equipment is installed: a weather station, a video camera, and more. To predict dangerous situations, the system receives weather forecasts from external sources.

So, the composition of the system is quite typical: website, agent, equipment. Let's start monitoring.
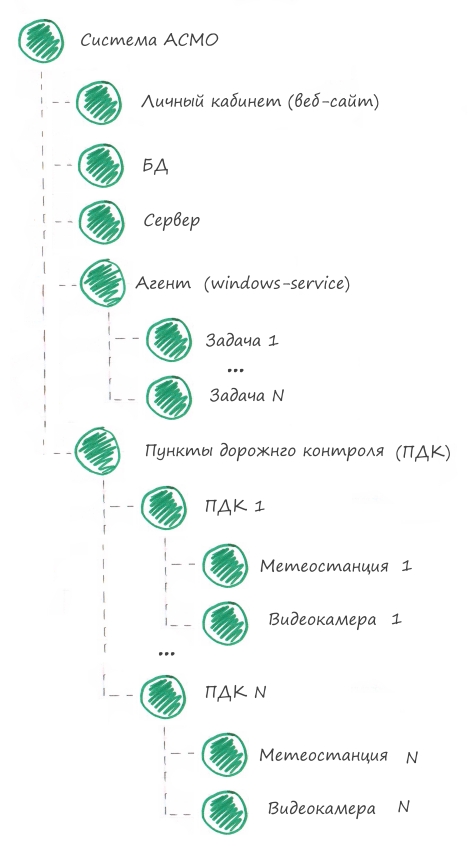
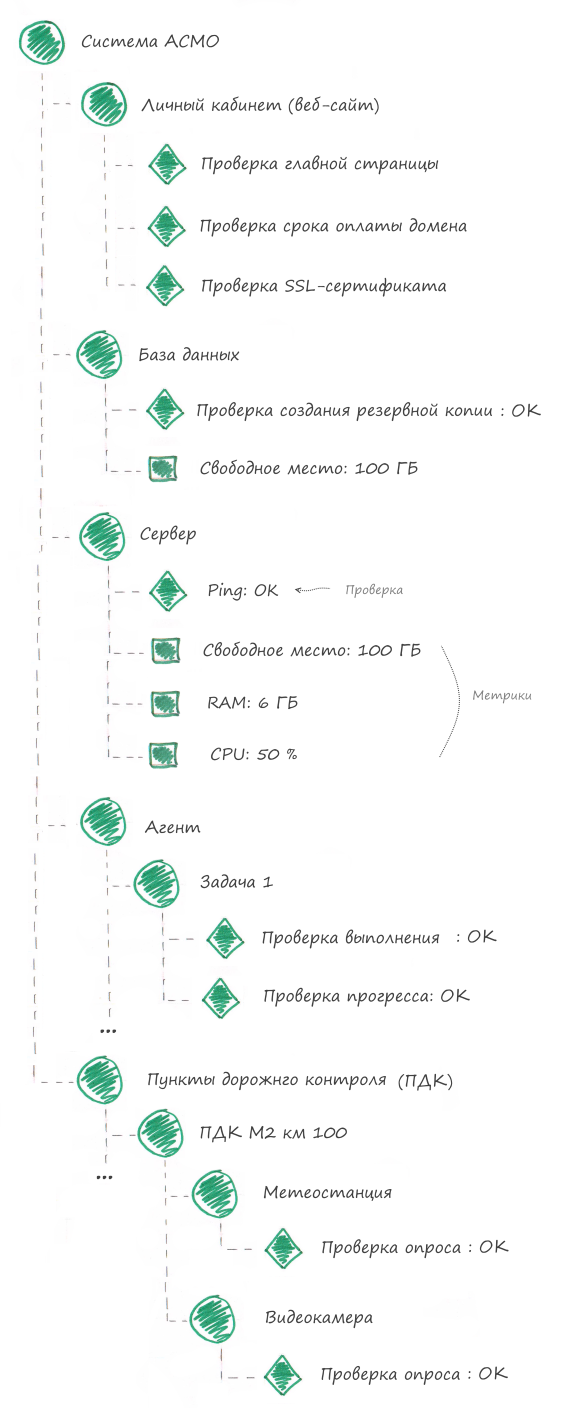
The following components can be distinguished in the ASMO system:
1. Personal account
This is a web application. At a minimum, you need to verify that the application is available on the Internet.
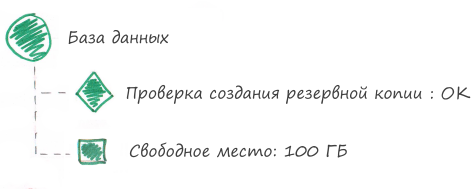
2. Database
The database stores important data for reporting, it is necessary to verify that the database backups are successfully created.
3. Server
By server we mean hardware on which applications are running. It is necessary to check the status of HDD, RAM, CPU.
4. Agent
This is a windows service that performs many different scheduled tasks. At a minimum, you must verify that the service is running.
5. Agent task
Just knowing that the agent is working is not enough. An agent can work, but not fulfill the tasks assigned to it. We will divide the agent component into tasks and we will check whether each agent task works successfully.
6. Road control points (container of all MPCs)
There are many points of road control, so we will combine all MPCs in one component. This will make it easier to read monitoring data. When viewing the state of the component "ASMO system" it will immediately be clear where the problems are: in applications, hardware or in MPC.
7. Road control point (one MPC)
We will consider this component serviceable if all devices on this MPC are serviceable.
8. Device
This is a video camera or weather station that are installed on the MPC. You must verify that the device is working properly.
In the monitoring system, the component tree will look like this:
So, we divided the system into components, now we need to come up with checks for each component.
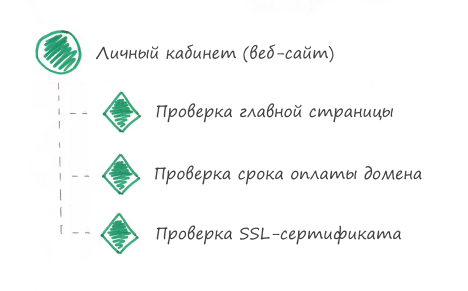
To monitor the web application, we use the following checks:
1. Checking the opening of the main page
This check is performed by the monitoring system. To execute it, we indicate the page address, the expected response fragment and the maximum query execution time.
2. Verification of domain payment term
Very important check. When a domain is left without payment, users cannot open the site. It may take several days to resolve the problem. DNS changes are not applied immediately.
3. SSL certificate verification
Now almost all sites use the https protocol for access. For the protocol to work correctly, you need a valid SSL certificate.
Below is the “My Account” component in the monitoring system:
All checks above are suitable for most applications and do not require writing code. This is great because you can start monitoring any web application in 5 minutes. Below are additional checks that can be performed for a web application, but their implementation is more complex and specific for different applications, so we will not analyze them in this article.
What else can I check?
To more fully monitor your web application, you can perform the following checks:
In the ASMO system, the agent acts as a task scheduler, which in the background performs scheduled tasks.
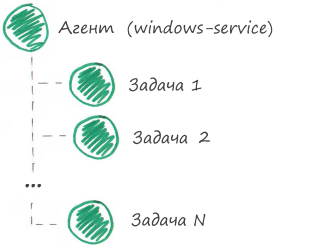
If all tasks of the agent are successful, then the agent is working properly. It turns out that in order to monitor an agent, it is necessary to monitor its tasks. Therefore, we break the Agent component into tasks. We will create for each task a separate component in the monitoring system, where the “Agent” component will be the “parent”.
We break the Agent component into child components (tasks):
So, we have broken a complex component into several simple ones. Now you need to come up with checks for each simple component. Please note that the parent component "Agent" will not have any checks, because the monitoring system will calculate its status on the basis of the status of its child components. In other words, if all tasks are completed successfully, then the agent also works successfully.
There are more than a hundred tasks in the ASMO system, is it really necessary to come up with unique checks for each task? Of course, control will be better if for each task of the agent we come up with and implement our own special checks, but in most cases it is enough to use universal checks.
The ASMO system uses only universal checks for tasks and this is enough to monitor the system’s performance.
Check execution
The simplest and most effective check is a check of progress. The check verifies that the task is being performed, and without errors. All tasks have this check.
Let's consider how these problems are solved in more detail.
Problem 1 - The task runs but fails
Below is the case when the task is executed, but from 14:00 to 16:00 ends with an error.
The figure shows that when the task fails, the signal is immediately sent to the monitoring system and the status of the corresponding check in the monitoring system becomes alarm.
Please note that in the monitoring system the status of the component depends on the status of the verification. The alarm status of the check will translate all higher-level components into alarm, see the figure below.
Problem 2 - The task stopped working (hung)
How does the monitoring system understand that the task is frozen?
The result of the check has a time of relevance, for example, 1 hour. If an hour passes and there is no new test result, then the monitoring system will set the alarm status in the scan.
In the picture above at 14:00 the lights were turned off. At 15:00, the monitoring system will detect that the test result (from 14:00) is rotten, because the relevance time has expired (one hour), but there is no new result, and will transfer the check to alarm status.
At 16:00 the light was turned on again, the program will complete the task and send the result to the monitoring system, the verification status will become success again.
What is the validity time of the check?
The relevance time should be longer than the task execution period. I recommend setting the time of relevance 2-3 times longer than the period of the task. This is necessary so as not to receive false notifications when, for example, the task took longer than usual or someone reloaded the program.
Progress Check
The ASMO system has the task “Downloading a forecast”, which once an hour tries to download a new forecast from an external source. The exact time when a new forecast appears in the external system is not known, but it is known that this happens 2 times a day. It turns out that if there is no new forecast for several hours, then this is normal, but if there is no new forecast for more than a day, then something has broken somewhere. For example, in an external forecast system the data format may change, because of which ASMO will not see a new forecast release.
Please note that we learn about the problem with a delay, because the monitoring system waits until the time of relevance of the last test result expires. Therefore, the time of relevance of the check does not need to be made too long.
To control the database in the ASMO system, we perform the following checks:
Verify backups
In most applications, it is important to have current database backups so that in case of a server failure, you can deploy the program to a new server.
ASMO once a week creates a backup copy and sends it to the repository. When this procedure successfully completes, the result of the success check is sent to the monitoring system. The result of the check has a validity time of 9 days. Those. To control the creation of backups, the mechanism of “checking progress” is used, which we examined above.
Checking free disk space
If there is not enough free space on the disk, then the database will not be able to work normally, therefore it is important to control the amount of free space.
It is convenient to use metrics to check the numerical parameters.
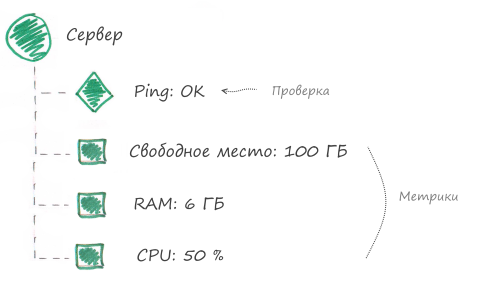
To monitor the server, we use the following checks and metrics:
1. Free disk space
If the disk space runs out, the application will not be able to work. We use 2 threshold values: the first level is WARNING, the second level is ALARM.
2. The average value of RAM in percent per hour
We use the average value per hour, as we are not interested in rare races.
3. The average value of CPU in percent per hour
We use the average value per hour, as we are not interested in rare races.
4. Ping check
Checks that the server is on the network. The monitoring system is able to perform this check, no need to write code.
Below is a picture of what the “Server” component looks like in the monitoring system:
I’ll tell you how data is received. For each point of road control (MPC) in the task scheduler there is a task, for example, "Poll MPC M2 km 200". The task once every 30 minutes receives data from all MPC devices.
Communication channel problem
Most of the equipment is located outside the city, a GSM network is used for data transfer, which does not work stably (that is, it doesn’t exist).
Due to frequent network failures, the first time checking the MAC poll in monitoring looked like this:

It became clear that this is not a working option, because a lot of false alerts were received about the problems. Then it was decided for each device to use a "progress check", i.e. only the success signal is sent to the monitoring system when the device is polled without error. The relevance time was set 5 hours.

Now monitoring sends a notification of problems only when the device fails to interrogate for more than 5 hours. With a high degree of probability these are not false alarms, but real problems.
Below is a picture of what the equipment looks like in a monitoring system:

Important!
When the GSM network stops working, then all MPC devices are not interrogated. To reduce the number of letters from the monitoring system, our engineers subscribe to notifications of problems with components of the type "MPC" and not "Device". This allows you to receive one notification for each MAC, and not receive a separate notification for each device.
Let's put it all together and see what kind of monitoring scheme we have.
Let's summarize.
What did the monitoring of ASMO performance give us?
1. Decreased troubleshooting time
Previously, we learned about defects from users, but not all users report defects. It so happened that we found out about the malfunction of any component of the system a week after its appearance. Now the monitoring system notifies us of problems as soon as the problem is detected.
2. Increased system stability
Since defects began to be eliminated earlier, the system as a whole began to work much more stable.
3. Reducing the number of technical support calls
Many problems are now resolved before users find out about them. Users are less likely to contact technical support. All this has a good effect on our reputation.
4. Increasing customer and user loyalty
The customer noticed positive changes in the stability of the system. Users are less likely to experience problems with the system.
5. Reduce technical support costs
We have stopped manually performing any checks. Now all checks are automated. Previously, we learned about problems from users, it was often difficult to understand what problem the user was talking about. Now most of the problems are reported by the monitoring system, notifications contain technical data, on which it is always clear what and where it broke.
Important!
You cannot install a monitoring system on the same server where your applications are running. If the server crashes, the applications will stop working, and there will be no one to send a notification about this.
The monitoring system should work on a separate server in another data center.
If you do not want to use a dedicated server in the new data center, you can use the cloud monitoring system. Our company uses the Zidium cloud monitoring system, but you can use any other monitoring system. The cost of a cloud monitoring system is lower than renting a new server.
Recommendations:
If you are not already using a monitoring system, get started! It is not as difficult as it seems. Get high by looking at the green tree of components that you have grown yourself.
Good luck.
Our company is engaged in software development and subsequent technical support. As part of technical support, you need to not just fix errors, but monitor the performance of our applications.
For example, if one of the services "crashes", then you need to automatically fix this problem and begin to solve it, and not wait for calls to technical support for dissatisfied users.
We have a small company, there are no resources to study and contain any complex solutions for monitoring applications, it was necessary to find a simple and effective solution.
Monitoring strategy
Performing an application health check is not easy, this task is non-trivial, one might even say creative. It is especially difficult to test a complex multi-link system.
How to eat an elephant? Only in parts! We use this approach to monitor applications.
The essence of our monitoring strategy:
Break the application down into components.A component is considered healthy if all of its control checks are performed without errors. An application is considered healthy if all its components are functional.
For each component, come up with control checks.
Thus, any system can be represented as a tree of components. Complex components are broken down into simpler ones. Simple components have checks.
Control checks should not perform functional testing; these are not unit tests. Control checks should check how the component feels at the current moment of time, whether there are all the resources necessary for its functioning, whether there are any problems.
There are no miracles, most of the checks will need to be developed independently. But do not be scared, because in most cases one check takes 5-10 lines of code, but then you can implement any logic and you will clearly understand how the check works out.
Monitoring system
Suppose we split the application into components, invent and implement checks for each component, but what to do with the results of these checks? How do we know that some kind of check failed?
We will need a monitoring system. She will perform the following tasks:
- Receive test results and determine the status of components from them.
Visually, it looks like highlighting the component tree. Serviceable components turn green, troubled components turn red.
- Perform general checks out of the box.
The monitoring system can perform some checks by itself. Why reinvent the wheel, we will use them. For example, you can check that the site page is opening or the server is responding.
- Notification of problems to interested parties.
- Visualization of monitoring data, reporting, graphs and statistics.
Short description of the ASMO system
Best explained by example. Let's see how the monitoring of the operation of the ASMO system is organized.
ASMO is an automated weather support system. The system helps road service specialists understand where and when it is necessary to treat the road with anti-icing materials. The system collects data from traffic control points. A road control point is a place on the road where the equipment is installed: a weather station, a video camera, and more. To predict dangerous situations, the system receives weather forecasts from external sources.
So, the composition of the system is quite typical: website, agent, equipment. Let's start monitoring.
We break the system into components
The following components can be distinguished in the ASMO system:
1. Personal account
This is a web application. At a minimum, you need to verify that the application is available on the Internet.
2. Database
The database stores important data for reporting, it is necessary to verify that the database backups are successfully created.
3. Server
By server we mean hardware on which applications are running. It is necessary to check the status of HDD, RAM, CPU.
4. Agent
This is a windows service that performs many different scheduled tasks. At a minimum, you must verify that the service is running.
5. Agent task
Just knowing that the agent is working is not enough. An agent can work, but not fulfill the tasks assigned to it. We will divide the agent component into tasks and we will check whether each agent task works successfully.
6. Road control points (container of all MPCs)
There are many points of road control, so we will combine all MPCs in one component. This will make it easier to read monitoring data. When viewing the state of the component "ASMO system" it will immediately be clear where the problems are: in applications, hardware or in MPC.
7. Road control point (one MPC)
We will consider this component serviceable if all devices on this MPC are serviceable.
8. Device
This is a video camera or weather station that are installed on the MPC. You must verify that the device is working properly.
In the monitoring system, the component tree will look like this:
Web application monitoring
So, we divided the system into components, now we need to come up with checks for each component.
To monitor the web application, we use the following checks:
1. Checking the opening of the main page
This check is performed by the monitoring system. To execute it, we indicate the page address, the expected response fragment and the maximum query execution time.
2. Verification of domain payment term
Very important check. When a domain is left without payment, users cannot open the site. It may take several days to resolve the problem. DNS changes are not applied immediately.
3. SSL certificate verification
Now almost all sites use the https protocol for access. For the protocol to work correctly, you need a valid SSL certificate.
Below is the “My Account” component in the monitoring system:
All checks above are suitable for most applications and do not require writing code. This is great because you can start monitoring any web application in 5 minutes. Below are additional checks that can be performed for a web application, but their implementation is more complex and specific for different applications, so we will not analyze them in this article.
What else can I check?
To more fully monitor your web application, you can perform the following checks:
- Number of JavaScript errors per period
- The number of errors on the side of the web application (back-end) for the period
- Number of unsuccessful web application responses (response code 404, 500, etc.)
- Average query execution time
Monitoring windows service (agent)
In the ASMO system, the agent acts as a task scheduler, which in the background performs scheduled tasks.
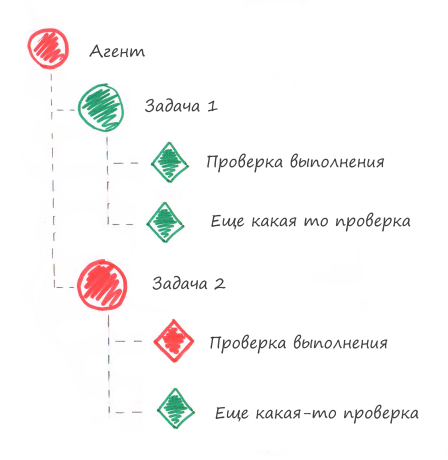
If all tasks of the agent are successful, then the agent is working properly. It turns out that in order to monitor an agent, it is necessary to monitor its tasks. Therefore, we break the Agent component into tasks. We will create for each task a separate component in the monitoring system, where the “Agent” component will be the “parent”.
We break the Agent component into child components (tasks):
So, we have broken a complex component into several simple ones. Now you need to come up with checks for each simple component. Please note that the parent component "Agent" will not have any checks, because the monitoring system will calculate its status on the basis of the status of its child components. In other words, if all tasks are completed successfully, then the agent also works successfully.
There are more than a hundred tasks in the ASMO system, is it really necessary to come up with unique checks for each task? Of course, control will be better if for each task of the agent we come up with and implement our own special checks, but in most cases it is enough to use universal checks.
The ASMO system uses only universal checks for tasks and this is enough to monitor the system’s performance.
Check execution
The simplest and most effective check is a check of progress. The check verifies that the task is being performed, and without errors. All tasks have this check.
Validation algorithmThis check allows you to detect the following problems:
After each task execution, it is necessary to send the result of the SUCCESS check to the monitoring system if the task was successful, or ERROR if the execution failed.
- The task runs, but fails.
- The task has stopped executing, for example, it has frozen.
Let's consider how these problems are solved in more detail.
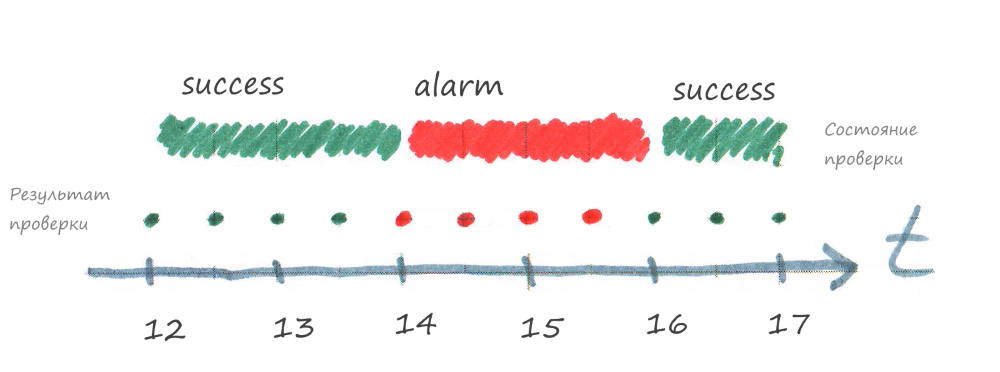
Problem 1 - The task runs but fails
Below is the case when the task is executed, but from 14:00 to 16:00 ends with an error.
The figure shows that when the task fails, the signal is immediately sent to the monitoring system and the status of the corresponding check in the monitoring system becomes alarm.
Please note that in the monitoring system the status of the component depends on the status of the verification. The alarm status of the check will translate all higher-level components into alarm, see the figure below.
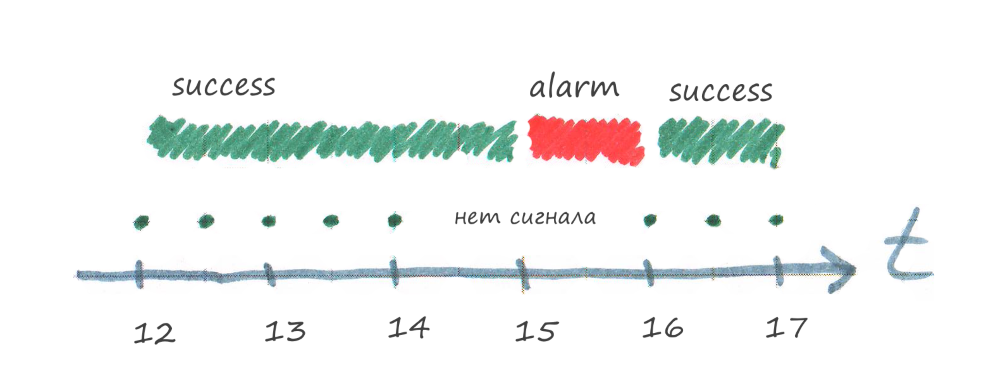
Problem 2 - The task stopped working (hung)
How does the monitoring system understand that the task is frozen?
The result of the check has a time of relevance, for example, 1 hour. If an hour passes and there is no new test result, then the monitoring system will set the alarm status in the scan.
In the picture above at 14:00 the lights were turned off. At 15:00, the monitoring system will detect that the test result (from 14:00) is rotten, because the relevance time has expired (one hour), but there is no new result, and will transfer the check to alarm status.
At 16:00 the light was turned on again, the program will complete the task and send the result to the monitoring system, the verification status will become success again.
What is the validity time of the check?
The relevance time should be longer than the task execution period. I recommend setting the time of relevance 2-3 times longer than the period of the task. This is necessary so as not to receive false notifications when, for example, the task took longer than usual or someone reloaded the program.
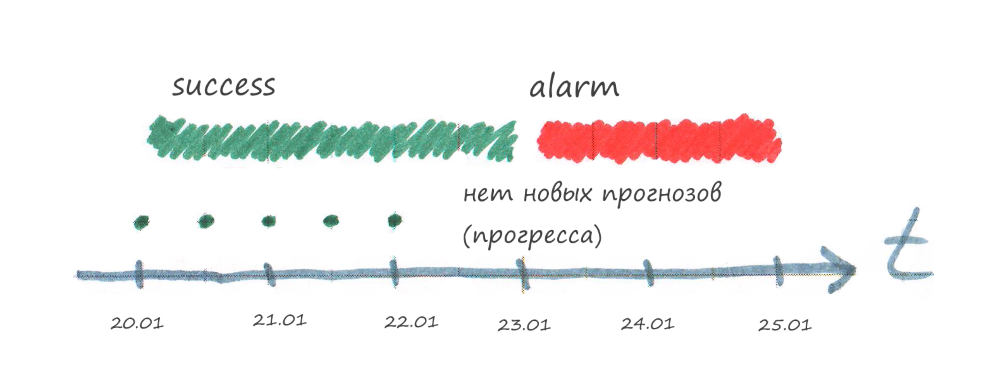
Progress Check
The ASMO system has the task “Downloading a forecast”, which once an hour tries to download a new forecast from an external source. The exact time when a new forecast appears in the external system is not known, but it is known that this happens 2 times a day. It turns out that if there is no new forecast for several hours, then this is normal, but if there is no new forecast for more than a day, then something has broken somewhere. For example, in an external forecast system the data format may change, because of which ASMO will not see a new forecast release.
Validation algorithm
The task sends the result of the SUCCESS check to the monitoring system when it is possible to obtain progress (download a new weather forecast). If there is no progress or an error has occurred, then nothing is sent to the monitoring system.
The audit should have an interval of relevance such that it is guaranteed to receive new progress during this time.
Please note that we learn about the problem with a delay, because the monitoring system waits until the time of relevance of the last test result expires. Therefore, the time of relevance of the check does not need to be made too long.
Database monitoring
To control the database in the ASMO system, we perform the following checks:
- Verify backups
- Checking free disk space
Verify backups
In most applications, it is important to have current database backups so that in case of a server failure, you can deploy the program to a new server.
ASMO once a week creates a backup copy and sends it to the repository. When this procedure successfully completes, the result of the success check is sent to the monitoring system. The result of the check has a validity time of 9 days. Those. To control the creation of backups, the mechanism of “checking progress” is used, which we examined above.
Checking free disk space
If there is not enough free space on the disk, then the database will not be able to work normally, therefore it is important to control the amount of free space.
It is convenient to use metrics to check the numerical parameters.
Metric is a numerical variable whose value is passed to the monitoring system. The monitoring system checks thresholds and calculates the status of the metric.Below is a picture of what the “Database” component looks like in the monitoring system:
Server monitoring
To monitor the server, we use the following checks and metrics:
1. Free disk space
If the disk space runs out, the application will not be able to work. We use 2 threshold values: the first level is WARNING, the second level is ALARM.
2. The average value of RAM in percent per hour
We use the average value per hour, as we are not interested in rare races.
3. The average value of CPU in percent per hour
We use the average value per hour, as we are not interested in rare races.
4. Ping check
Checks that the server is on the network. The monitoring system is able to perform this check, no need to write code.
Below is a picture of what the “Server” component looks like in the monitoring system:
Equipment monitoring
I’ll tell you how data is received. For each point of road control (MPC) in the task scheduler there is a task, for example, "Poll MPC M2 km 200". The task once every 30 minutes receives data from all MPC devices.
Communication channel problem
Most of the equipment is located outside the city, a GSM network is used for data transfer, which does not work stably (that is, it doesn’t exist).
Due to frequent network failures, the first time checking the MAC poll in monitoring looked like this:
It became clear that this is not a working option, because a lot of false alerts were received about the problems. Then it was decided for each device to use a "progress check", i.e. only the success signal is sent to the monitoring system when the device is polled without error. The relevance time was set 5 hours.
Now monitoring sends a notification of problems only when the device fails to interrogate for more than 5 hours. With a high degree of probability these are not false alarms, but real problems.
Below is a picture of what the equipment looks like in a monitoring system:
Important!
When the GSM network stops working, then all MPC devices are not interrogated. To reduce the number of letters from the monitoring system, our engineers subscribe to notifications of problems with components of the type "MPC" and not "Device". This allows you to receive one notification for each MAC, and not receive a separate notification for each device.
The final monitoring scheme ASMO
Let's put it all together and see what kind of monitoring scheme we have.
Conclusion
Let's summarize.
What did the monitoring of ASMO performance give us?
1. Decreased troubleshooting time
Previously, we learned about defects from users, but not all users report defects. It so happened that we found out about the malfunction of any component of the system a week after its appearance. Now the monitoring system notifies us of problems as soon as the problem is detected.
2. Increased system stability
Since defects began to be eliminated earlier, the system as a whole began to work much more stable.
3. Reducing the number of technical support calls
Many problems are now resolved before users find out about them. Users are less likely to contact technical support. All this has a good effect on our reputation.
4. Increasing customer and user loyalty
The customer noticed positive changes in the stability of the system. Users are less likely to experience problems with the system.
5. Reduce technical support costs
We have stopped manually performing any checks. Now all checks are automated. Previously, we learned about problems from users, it was often difficult to understand what problem the user was talking about. Now most of the problems are reported by the monitoring system, notifications contain technical data, on which it is always clear what and where it broke.
Important!
You cannot install a monitoring system on the same server where your applications are running. If the server crashes, the applications will stop working, and there will be no one to send a notification about this.
The monitoring system should work on a separate server in another data center.
If you do not want to use a dedicated server in the new data center, you can use the cloud monitoring system. Our company uses the Zidium cloud monitoring system, but you can use any other monitoring system. The cost of a cloud monitoring system is lower than renting a new server.
Recommendations:
- Break applications and systems in the form of a tree of components in as much detail as possible, so it will be convenient to understand where and what has broken, and the control will be more complete.
- To check the health of a component, use checks. It’s better to use many simple checks than one complex one.
- Threshold metric values are configured on the side of the monitoring system, and do not write in the code. This will save you from recompiling, reconfiguring, or restarting the application.
- For custom checks, use the time of relevance with a margin so as not to receive false notifications due to the fact that some kind of check took a little longer than usual.
- Try to make the components in the monitoring system turn red only when the problem is definitely there. If they turn red for nothing, then you will cease to pay attention to notifications of the monitoring system, its meaning will be lost.
If you are not already using a monitoring system, get started! It is not as difficult as it seems. Get high by looking at the green tree of components that you have grown yourself.
Good luck.
All Articles