The concept of persistent fabric to control IT infrastructure
Hello. I’ll tell you about microservices, but from a slightly different point of view than Vadim Madison in the post “What do we know about microservices” . In general, I consider myself a database developer. What does microservices have to do with it? Avito uses: Vertica, PostgreSQL, Redis, MongoDB, Tarantool, VoltDB, SQLite ... In total, we have 456+ databases for 849+ services. And somehow you need to live with it.
In this post I will tell you about how we implemented data discovery in microservice architecture. This post is a free transcript of my report with Highload ++ 2018 , the video can be viewed here .
Everybody knows quite well how a microservice architecture should be built in terms of databases. Here is the pattern that everyone usually starts with. There is a common base between the services. On the slide, orange rectangles are services, there is a common base between them.
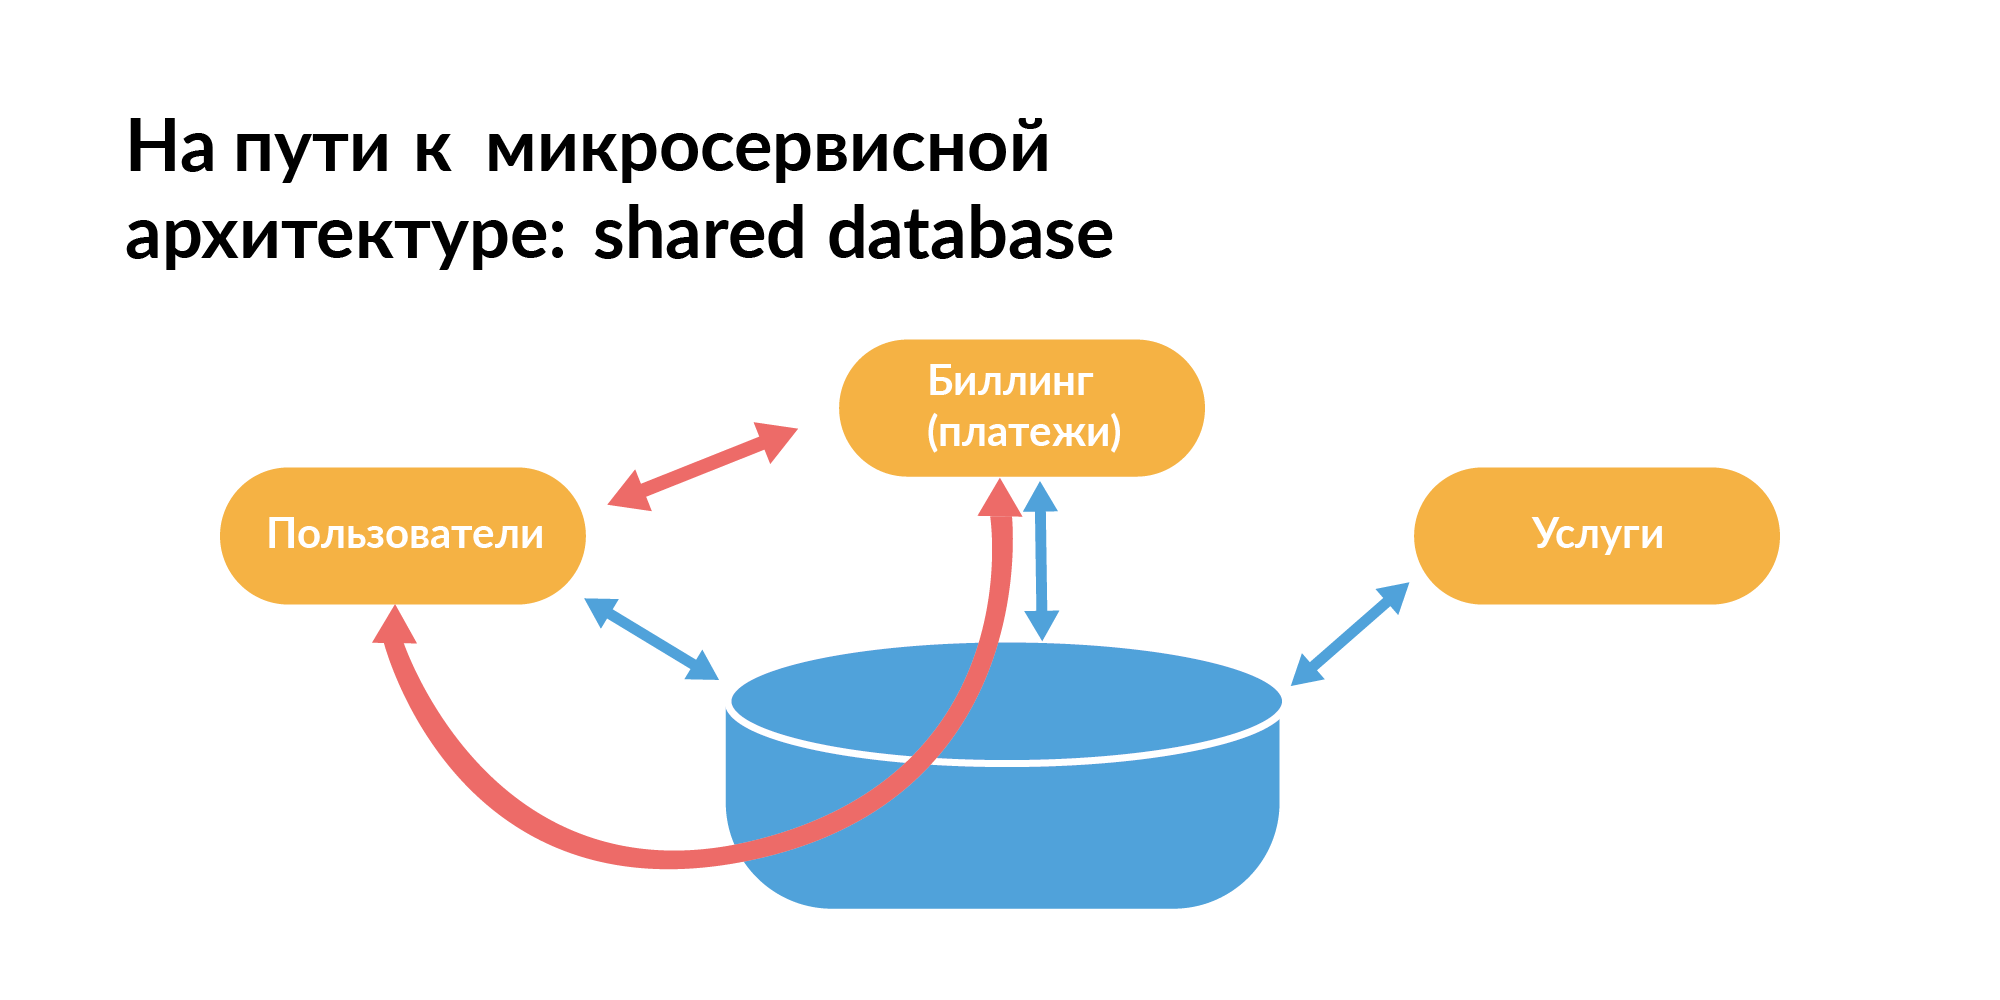
You can’t live like that, because you cannot test services in isolation when, in addition to direct communication between them, there is also communication through the database. One service request may slow down another service. This is bad.

From the point of view of working with databases for microservice architecture, the DataBase-per-Service pattern should be used - each service has its own database. If there are a lot of shards in the database, then the base should be shared so that they synchronize. This is a theory, but in reality it’s not so.

In real companies, they use not only microservices, but also a monolith. There are services written correctly. And there are old services that still use a pattern with a common base.
Vadim Madison at his presentation showed this picture with connectedness. Only he showed it without one component, and the network in it was uniform. In this network in the center there is a point that is associated with many points (microservices). This is a monolith. It is small in the diagram. But in fact, the monolith is big. When we talk about a real company, then you need to understand the nuances of the coexistence of microservice, born, and outgoing, but still important monolithic architecture.
How does a monolith rewrite to a microservice architecture at the planning level? Of course, this is domain modeling. Everywhere it says that you need to do domain modeling. But, for example, we in Avito for several years created microservices without domain modeling. Then I took up it and the database developers. We are aware of complete data streams. This knowledge helps to design a domain model.
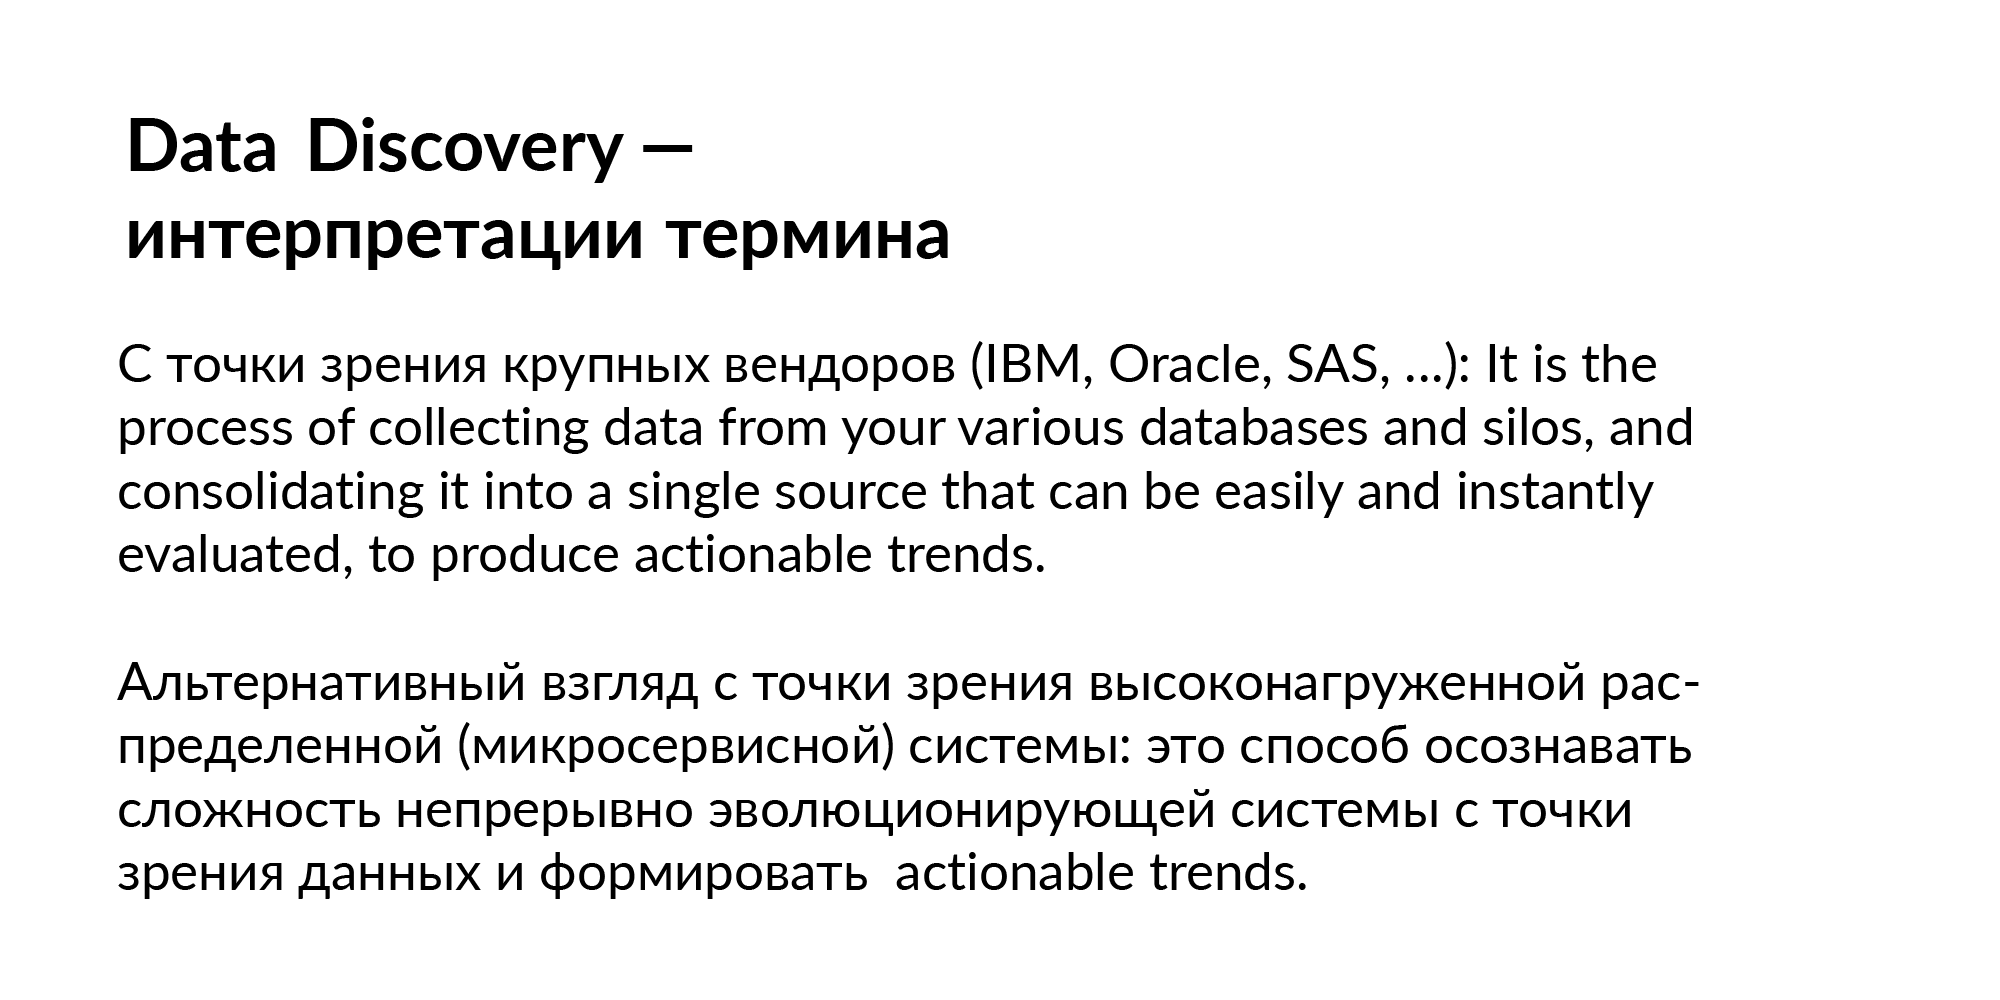
Data discovery has a classic interpretation - this is how to work with data scattered across different storages in order to lead to aggregate conclusions and make any correct conclusions. This is actually all marketing bullshit. These definitions are about how to download all data from microservices to storage. About this I had reports several years ago, we will not dwell on this.
I’ll tell you about another process, which is closer to the process of switching to microservices. I want to show a way how you can understand the complexity of a continuously evolving system in terms of data, in terms of microservices. Where to see the whole picture of hundreds of services, bases, teams, people? In fact, this question is the main idea of the report.
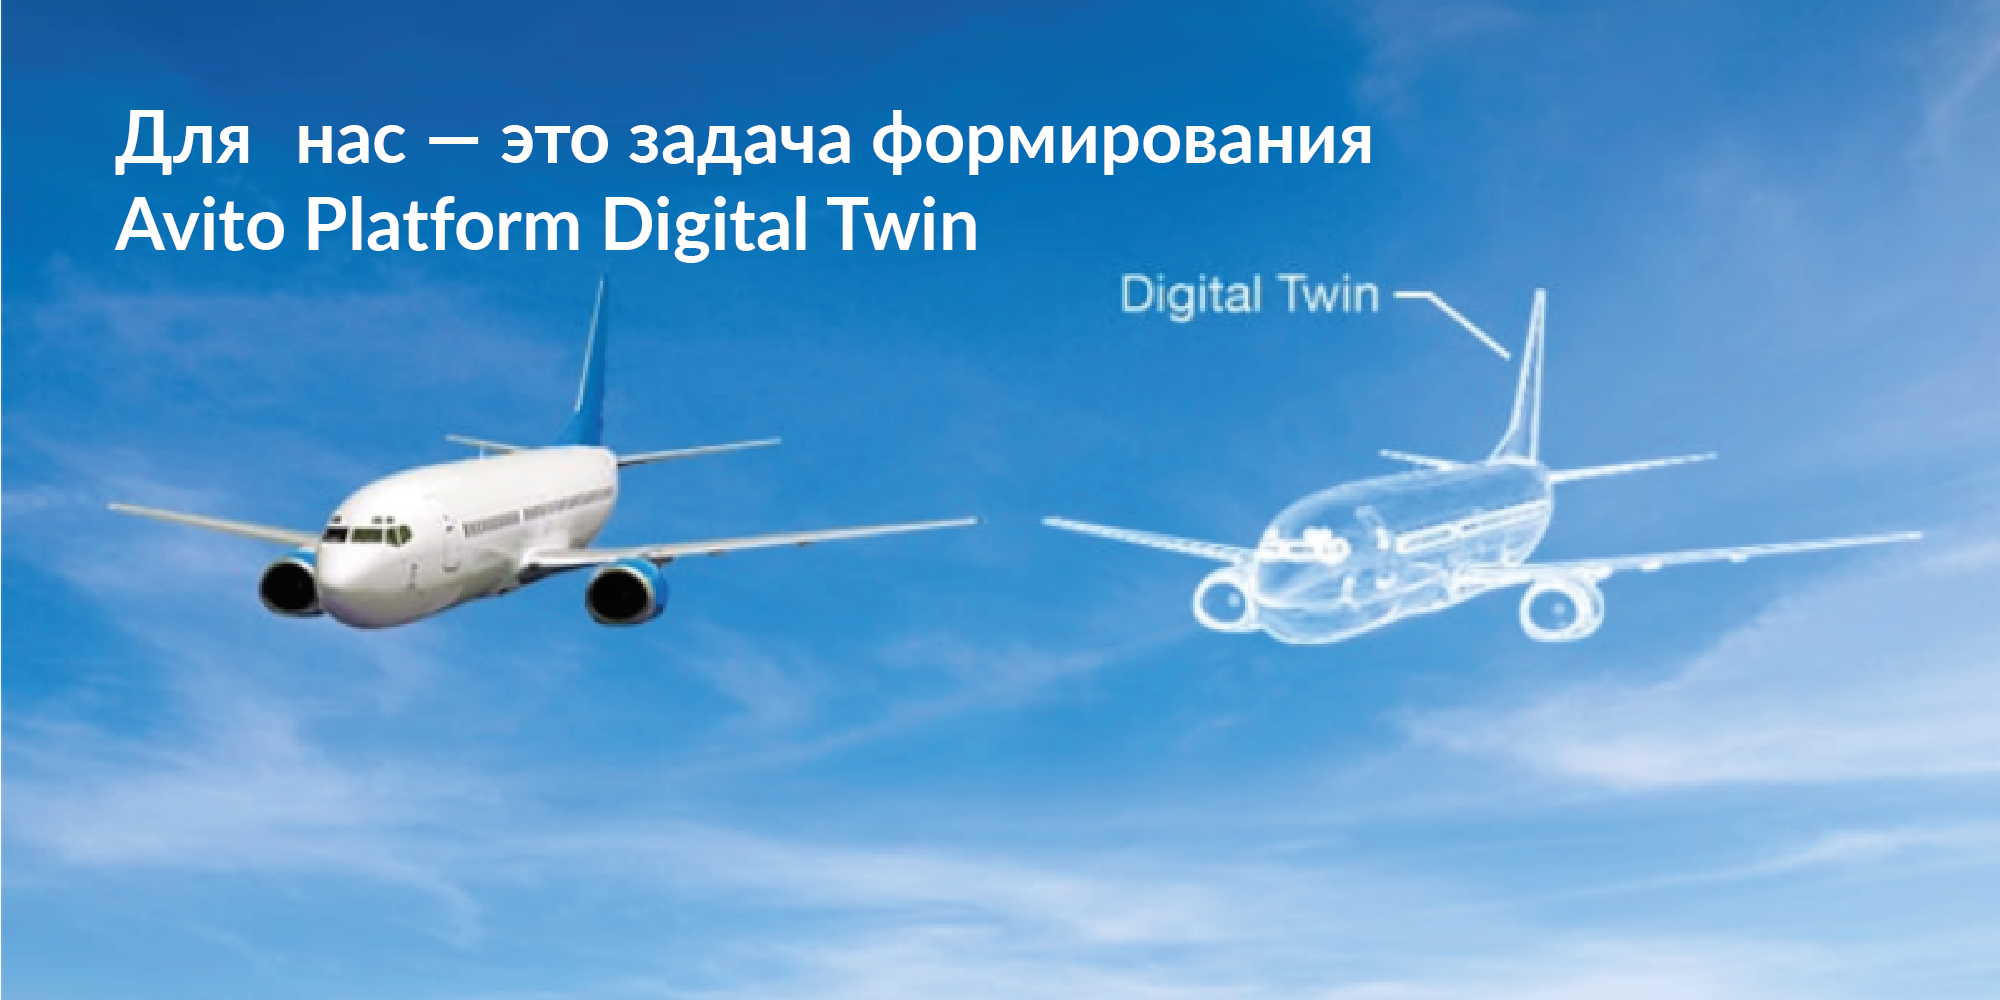
In order not to die in this microservice architecture, you need a digital twin. Your company is the totality of everything that provides the technological infrastructure. You need to create an adequate image of all these difficulties, on the basis of which you can quickly solve problems. And this is not an analytical repository.
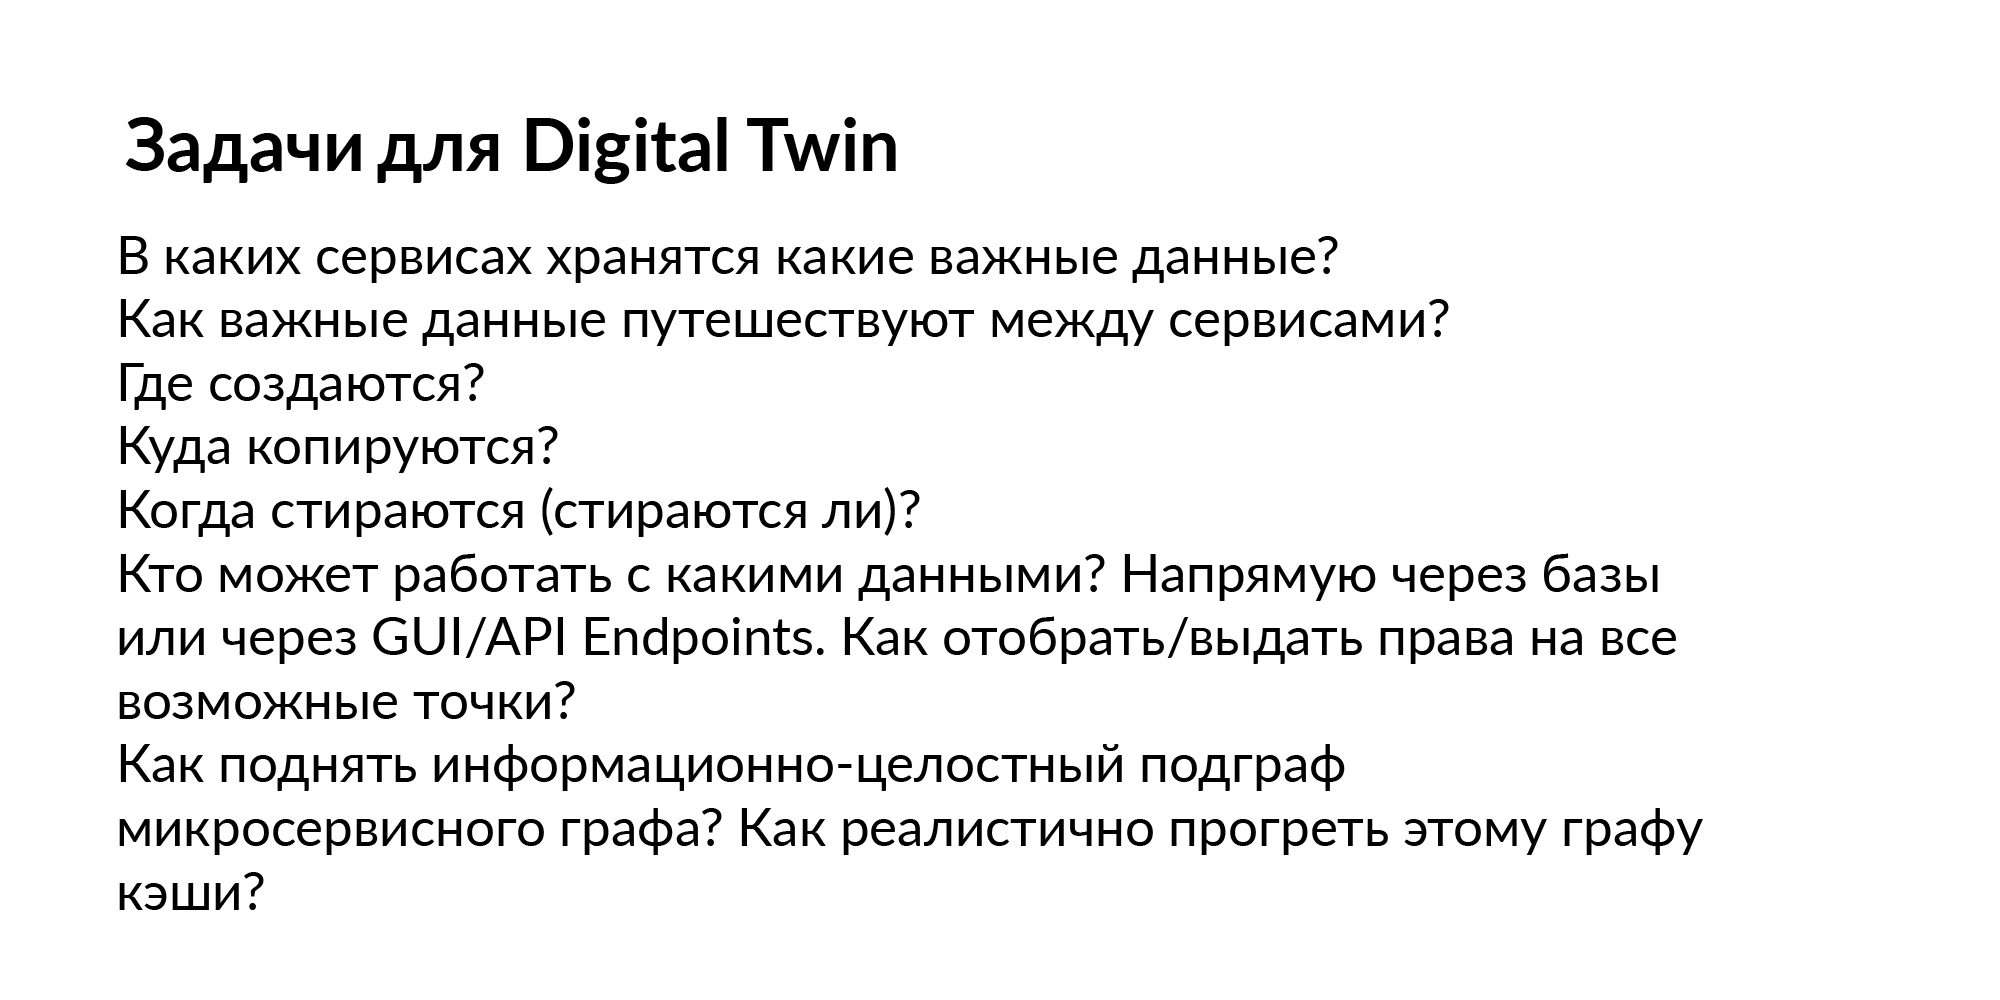
What tasks can we set for such a digital twin? After all, it all started with the simplest data discovery.
Questions:
- What services store important data?
- In which personal data is not stored?
- You have hundreds of bases. What personal data is there? And in which not?
- How do important data flow between services?
- For example, the service did not have personal data, and then he began to listen to the bus, and they appeared. Where are the data copied when they are erased?
- Who can work with what data?
- Who can access directly through the service, some through the database, some through the bus?
- Who through another service can pull the API handle (request) and download something?
The answer to these questions is almost always a graph of elements, a graph of relationships. This graph needs to be filled, updated and maintained with fresh data. We decided to call this graph Persistent Fabric (in translation - remembering fabric). Here is his visualization.
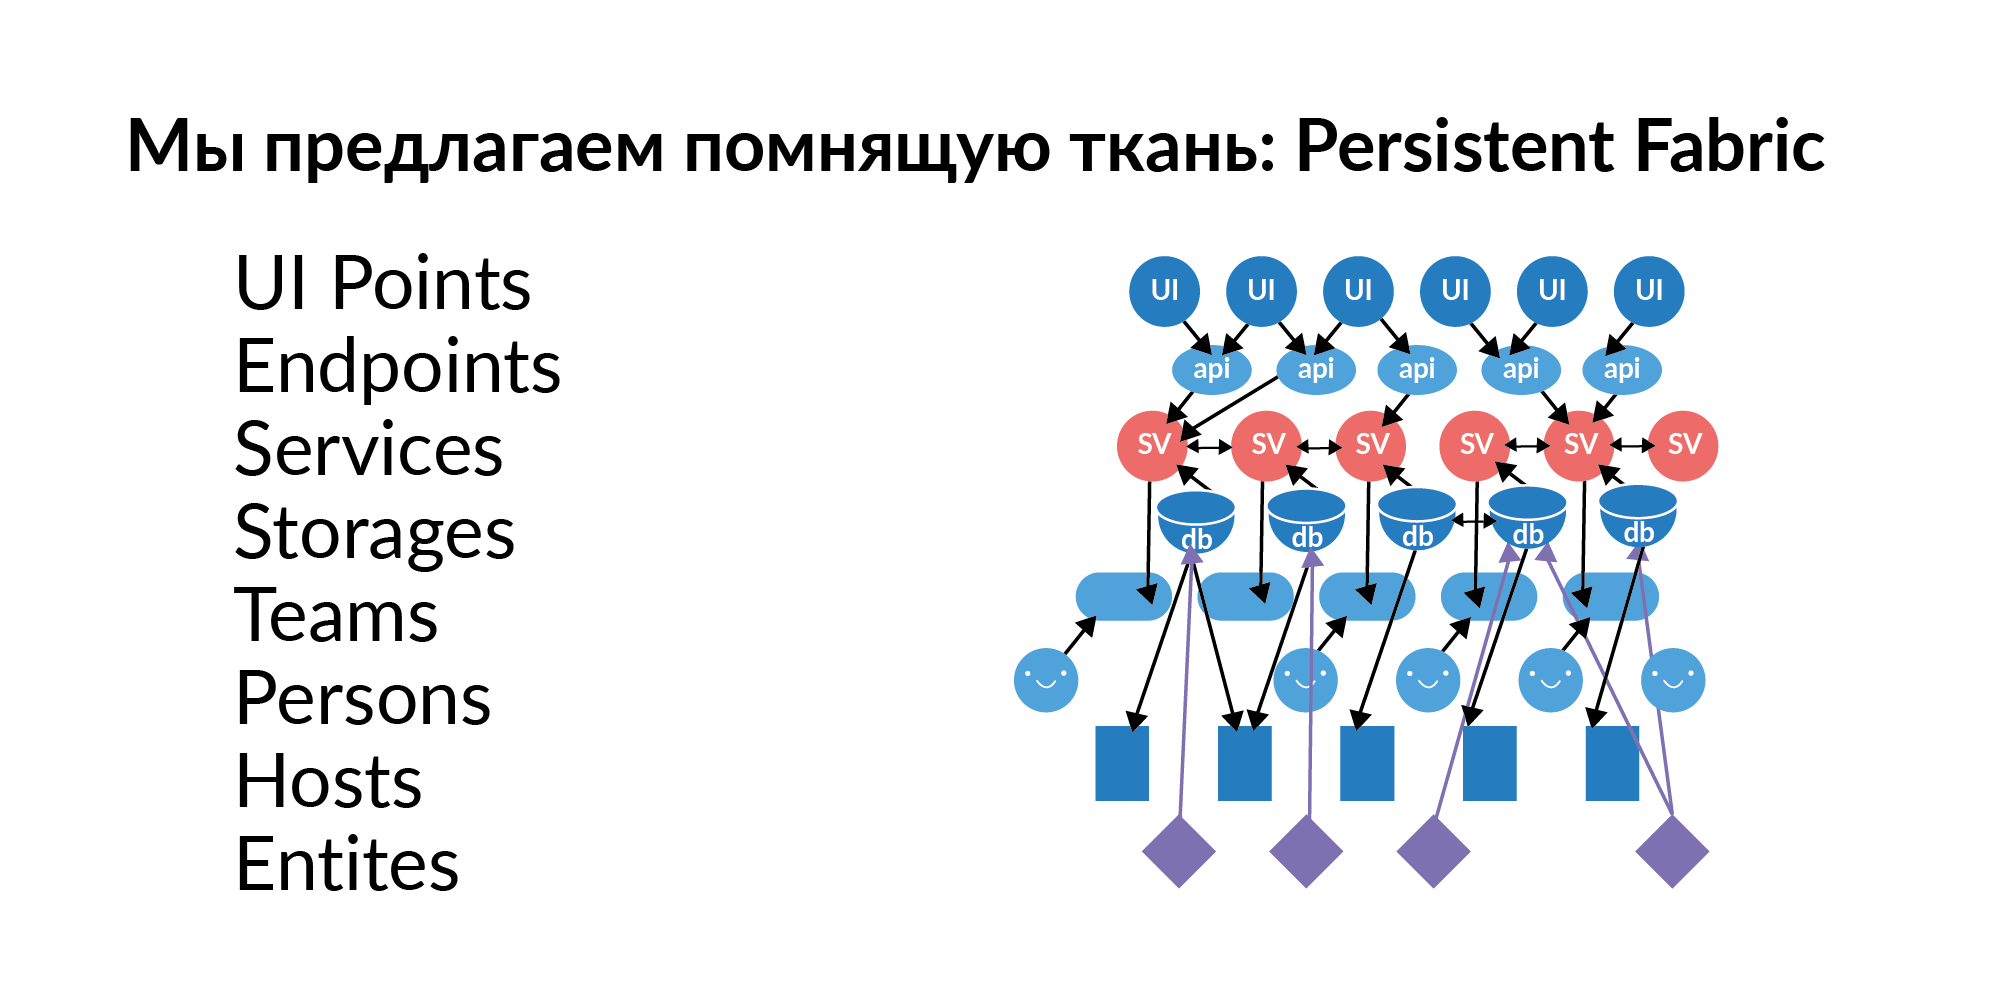
Let’s see what can be in this remembering fabric.
Interface points . These are elements of user interaction with the graphic interface. There can be several UI points on one page. These are, relatively speaking, custom key actions.
Endpoints . UI points jerk Endpoints. In the Russian tradition, this is called pens. Handles of services. Endpoints pull services.
Services Hundreds of services. Services are connected to each other. We understand which service can pull the service. We understand which call UI points can call which services in the chain.
Bases (in a logical sense) . The base as a storage term sounds bad, because this term refers to something analytical. Now we consider the base as storage. For example, Redis, PostgreSQL, Tarantool. If a service uses a database, it usually uses several databases.
- For long-term data storage, for example, PostgreSQL.
- Redis is used as a cache.
- Tarantool, which can quickly calculate something in the data stream.
Hosts The database has a deployment to hosts. One base, one Redis can actually live on 16 machines (master ring) and another 16 live slave. This gives an understanding of which servers you need to restrict access so that some important data does not leak.
Entities . Entities are stored in the databases. Examples of entities: user, announcement, payment. Entities can be stored in several databases. And here it is important not just to know that this entity is there. It is important to know that this entity has one storage being Golden Source. Golden Source is the base where an entity is created and edited. All other bases are functional caches. An important point. If, God forbid, an entity has two Golden Source, then a laborious coordination of the separated sources is necessary. The entities that are in the database must be given access to the service if we want to enrich this service with new functionality.
Teams . Teams that own the services. A service that does not belong to teams is a poor service. It’s hard for him to find someone responsible.
Now I will strongly correlate with the report of Vadim Madison, because he mentioned that the service reflects the person who last made the commit there. This is not bad as a starting point. But in the long run, this is bad, because the person who last committed there can quit.
Therefore, you need to know the team, the people in them and their roles. We have got such a simple graph, where on each layer there are several hundred elements. Do you know a system where all this can be stored?
Key moment. In order for this Persistent Fabric to live, it must not just fill up once. Services are created, they die, storage is allocated, they move around the servers, teams are created, broken, people switch to other teams. Entities are new, added to new services, deleted. Endpoints are created, registered, user trajectories from the point of view of the GUI are also redone. The most important thing is not that somewhere you need to technically store it. The most important thing is to make every Persistent Fabric layer fresh and relevant. That it is updated.
I propose to walk through the layers. I will illustrate how we do it. I will show how this can be done at the level of individual layers.

Information about the team can be taken from the organizational structure of 1C. Here I want to illustrate that Persistent Fabric does not need to fill the entire giant graph to populate. Each layer needs to be filled correctly.

Information about people can be taken from LDAP. One person can take different roles in different teams. This is absolutely normal. Now we have made the Avito People system and from it we take the binding of people to teams and their roles. The most important thing is that such simple data go so that at least they keep links to the ends of the links, so that the team names correspond to the teams from the 1C organizational structure.
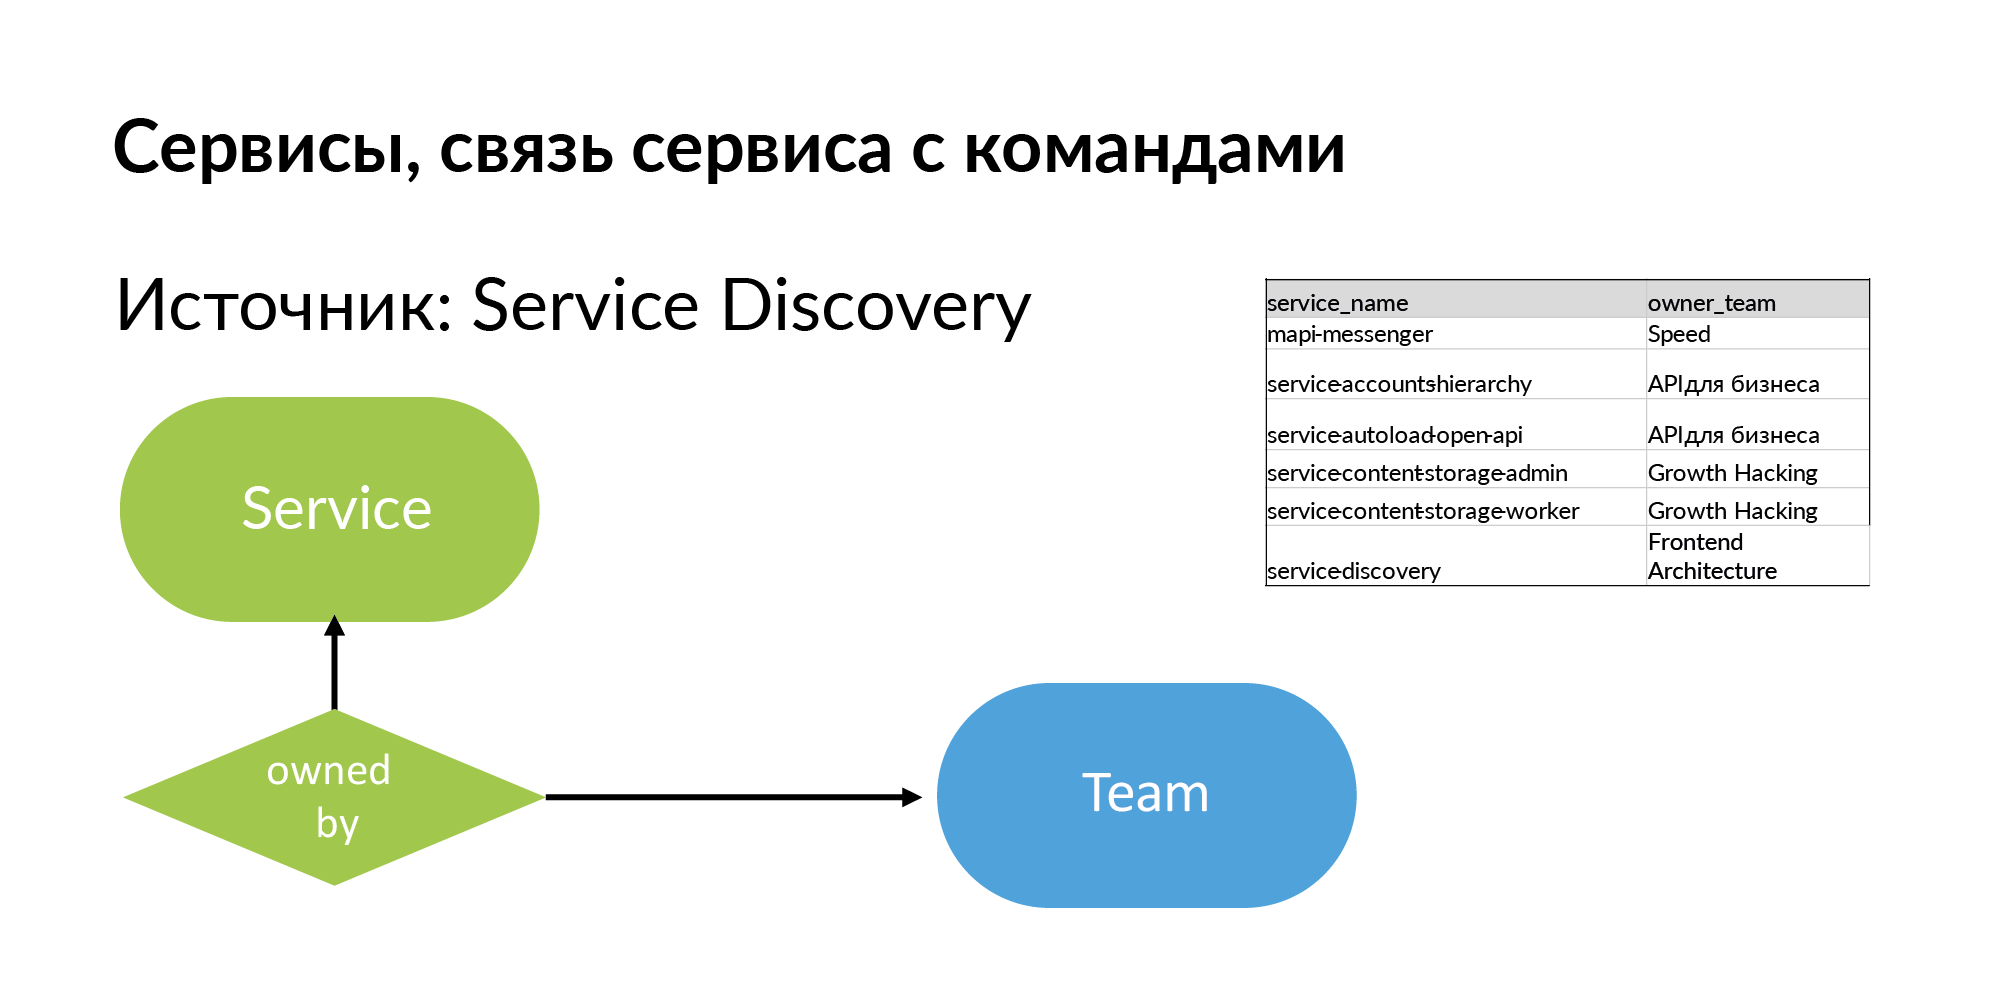
Services For the service you need to get the name and team that owns it. The source is Service Discovery. This is the system that Vadim Madison mentioned under the name Atlas. Atlas is a general registry of services.
It is useful to understand that almost all such systems like Atlas store information about 95% of services. 5% of services in such systems are absent, because old services created without registration in Atlas. And when you start working with this scheme, you feel what you are missing.
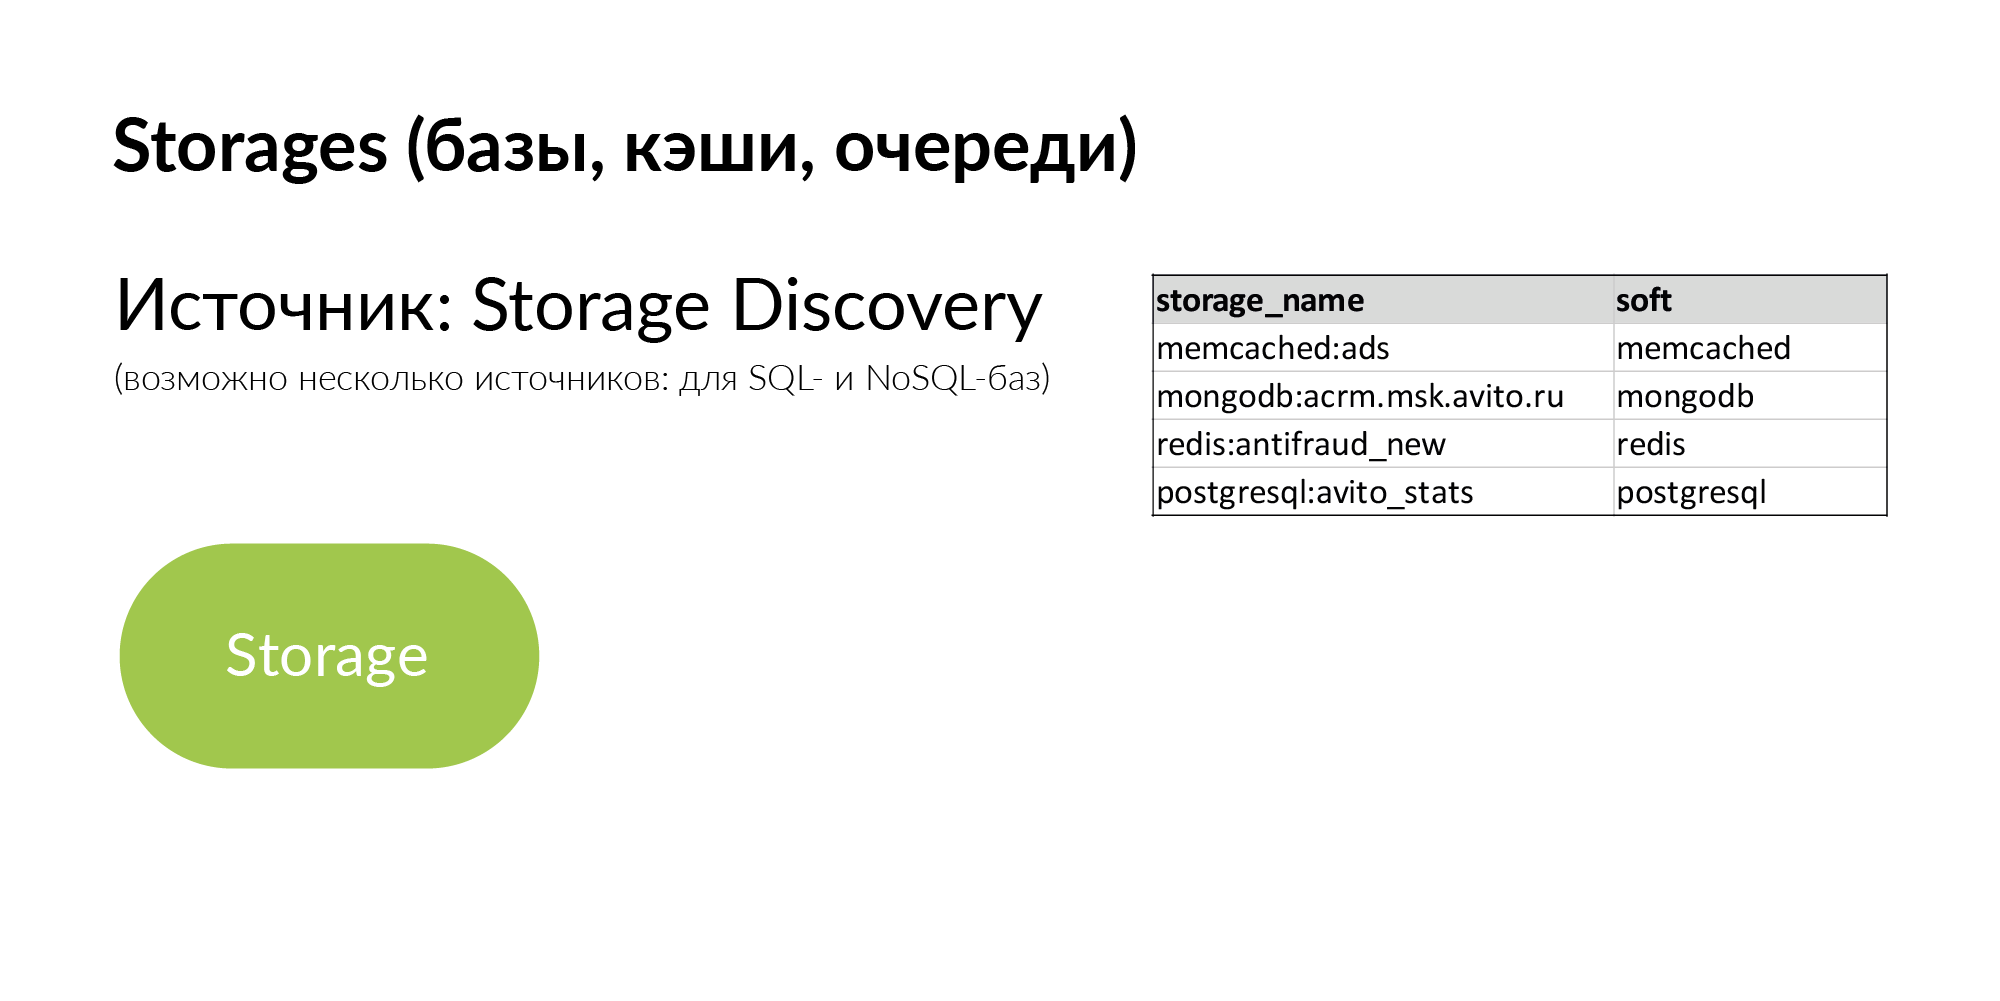
Storages are generic repositories. It can be PostgreSQL, MongoDB, Memcache, Vertica. We have several sources for Storage Discovery. NoSQL databases use their own half of the Atlas. For information about PostgreSQL databases, yaml parsing is used. But they want to make their Storage Discovery more correct.
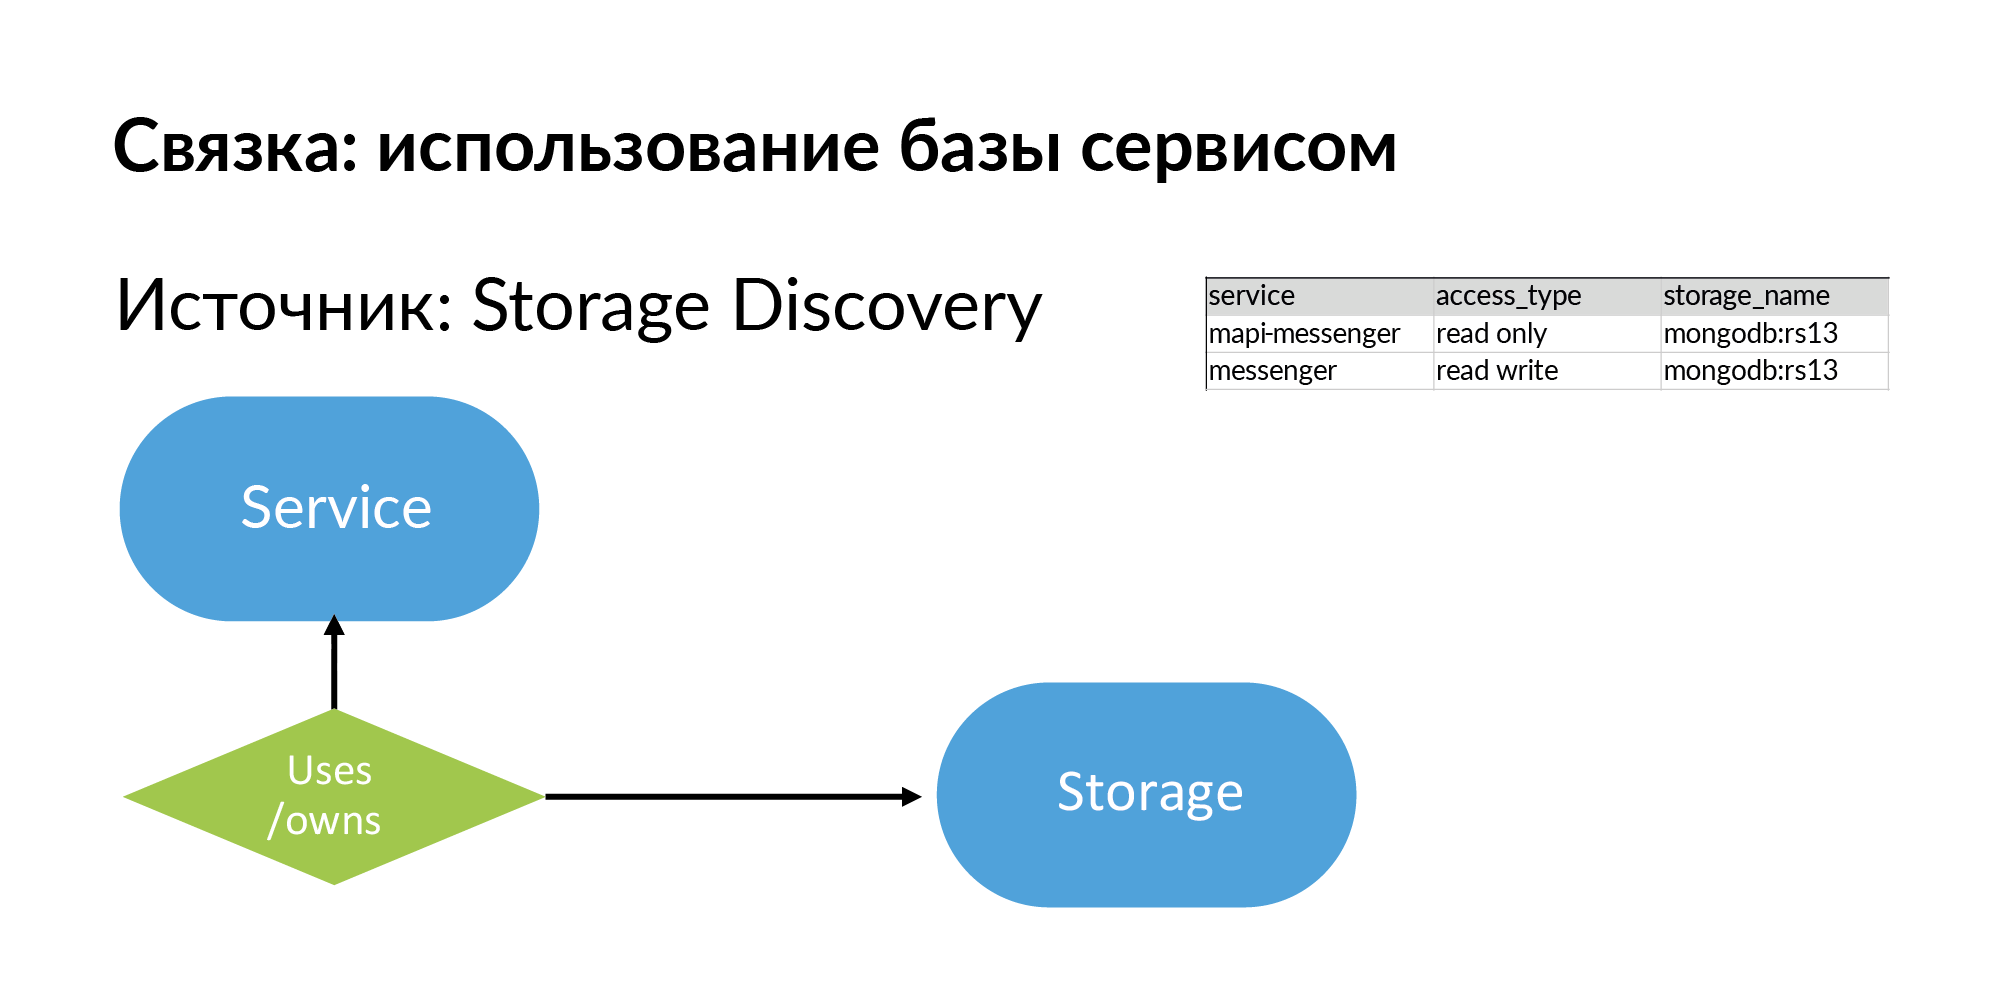
So, storages and information about what the service uses, well, or owns (these are different types) storage. Look, everything that I described is, in principle, quite simple, it can be filled even in Google Sheets.
What can be done with this? Let's imagine this is a graph. How to work with the graph? Add it to the graph base. For example, in Neo4j. These are already examples of real queries and examples of the results of these queries.
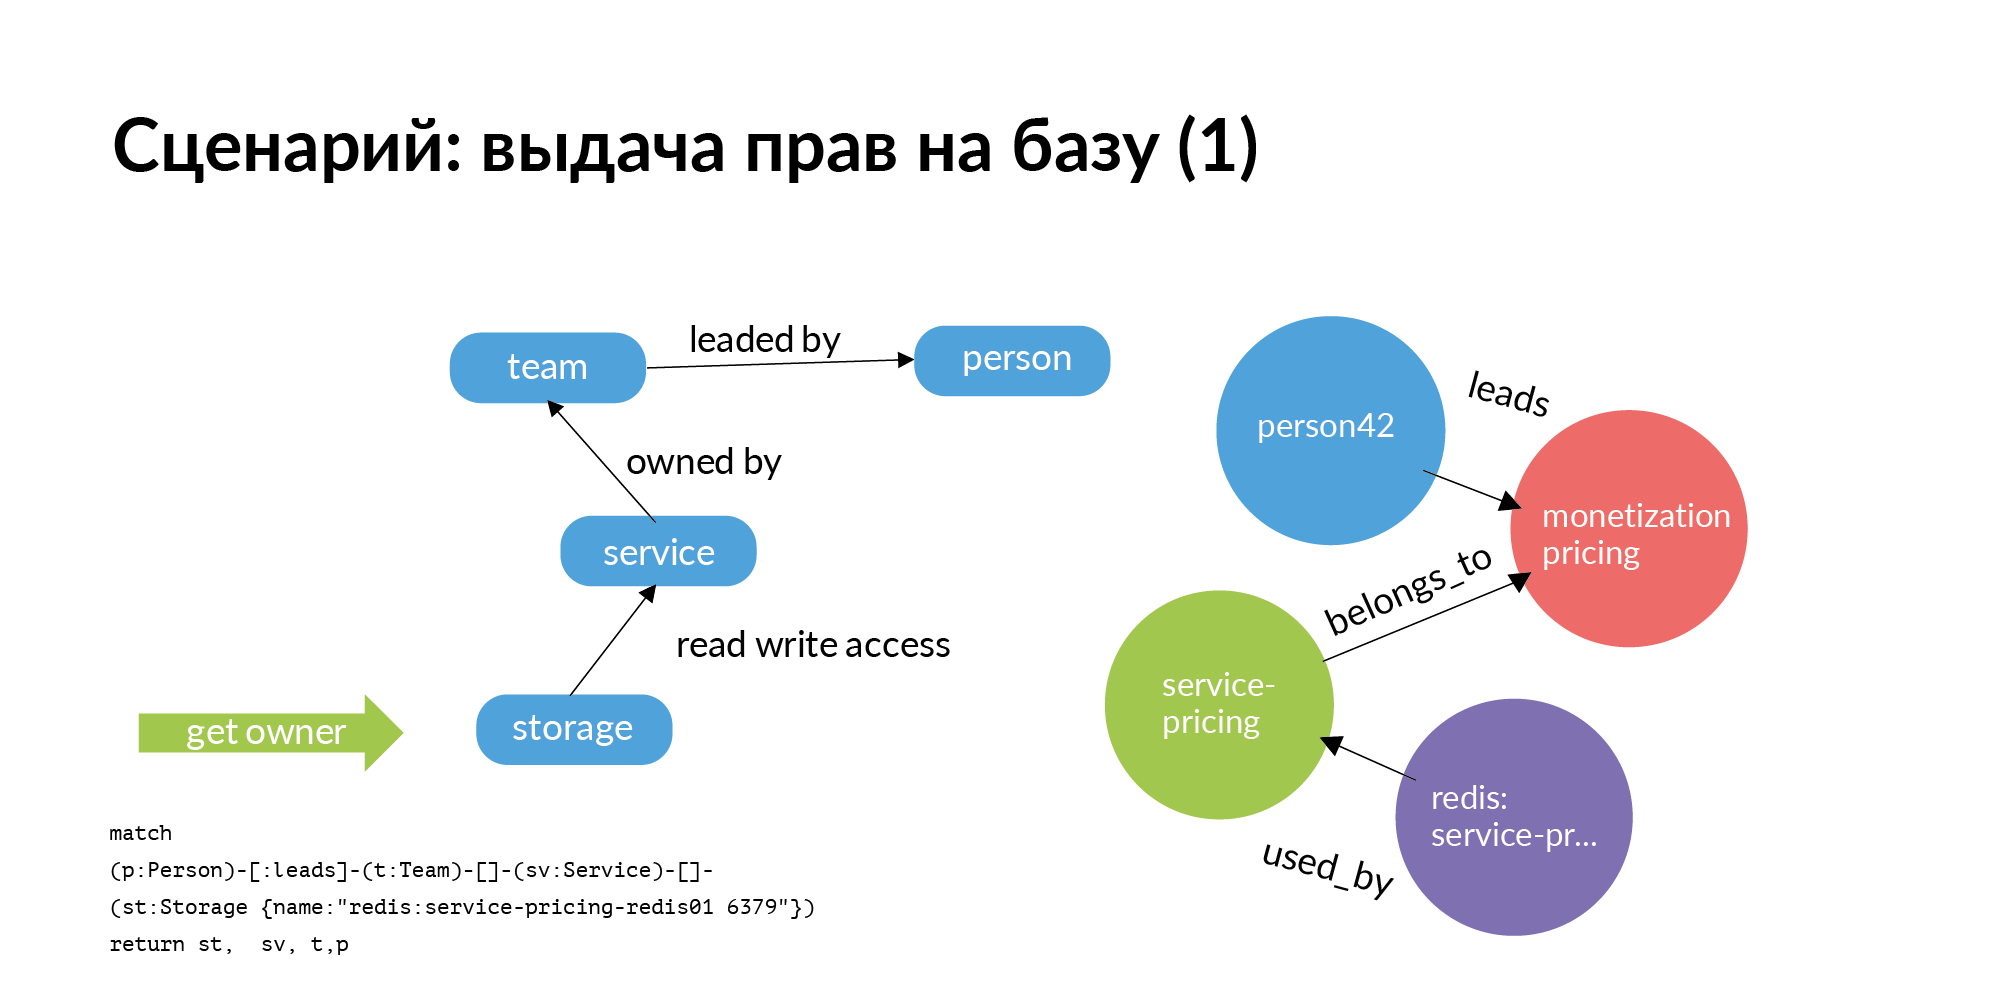
The first scenario. We need to issue rights to the base. The base should be strictly in service. This service should include only this service and only members of the team that owns the service. But we live in the real world. Quite often, other teams find it useful to go to the base of another service. Question: who should I ask for the grant of rights? The really big problem is for hundreds of databases to understand who is in charge. Despite the fact that who created it, quit long ago, or transferred to another position, or does not remember at all who works with it.
And here is the simplest graph query (Neo4j). You need access to storage. You go from storage to the service that owns it. Go to the team that owns the service. Further for the service, you will find out who this TechLead team has. In Avito, product teams have a technical manager and a product manager who cannot help with the bases. Only half of the request is actually displayed on the slide. Access to storage is not an atomic operation. To access storage, you need to access the servers on which it is installed. This is a rather interesting separate task.
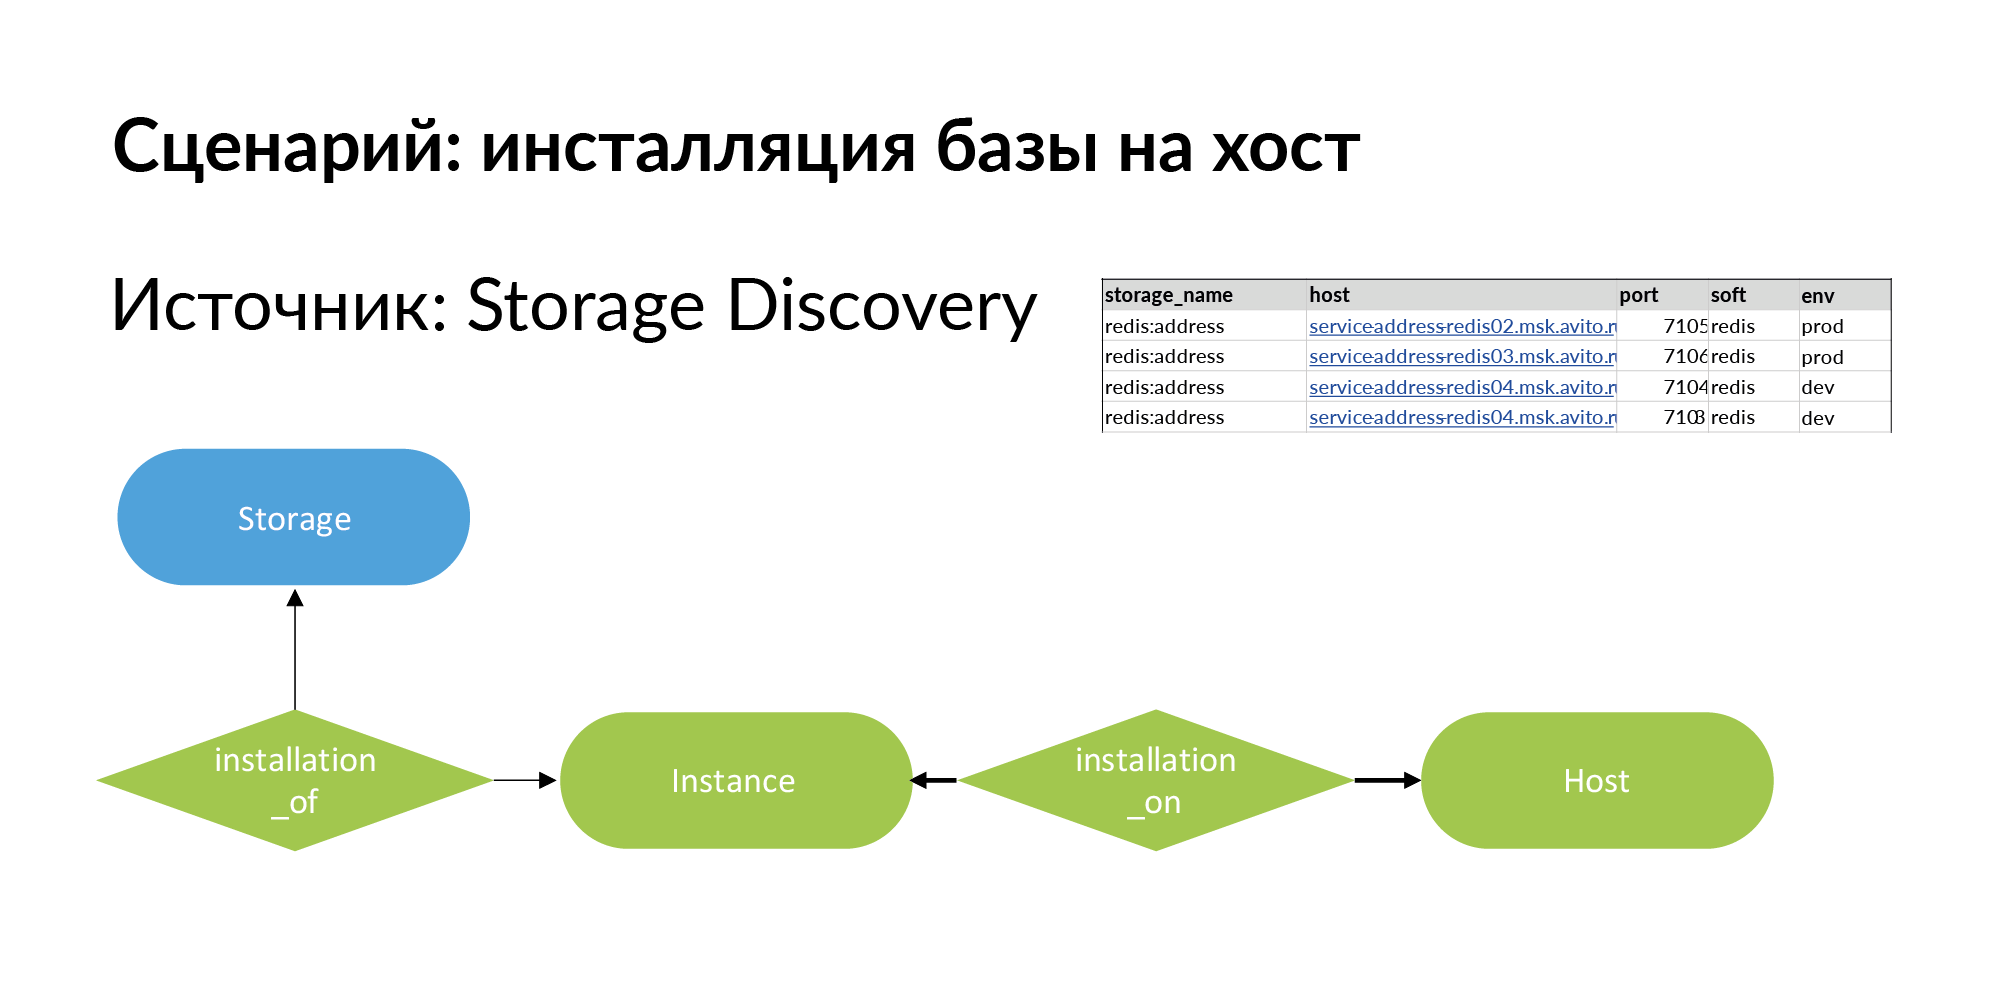
To solve it, we add a new entity. This is an installation. Here is a terminological problem. There is storage, for example Redis base (redis: address). There is host - it can be a physical machine, lxc-container, kubernetes. Installing storage on the host we call Instance.
It can have four installations on three hosts, as shown in the example above. Storage for production is wise to install on separate physical machines to increase performance. For a dev environment, all you have to do is install on a single host and assign different ports to Redis.

The first request for the issuance of rights to the base went to the head. The head confirmed that the rights can be granted.
Next comes the second part of the request. The second request from storage goes to instance and host. This request considers all installations for the corresponding environment. On the slide is an example for a production environment. Based on this, rights to connect to specific hosts and specific ports are already issued. This was an example of a grant request for an employee not on the team.
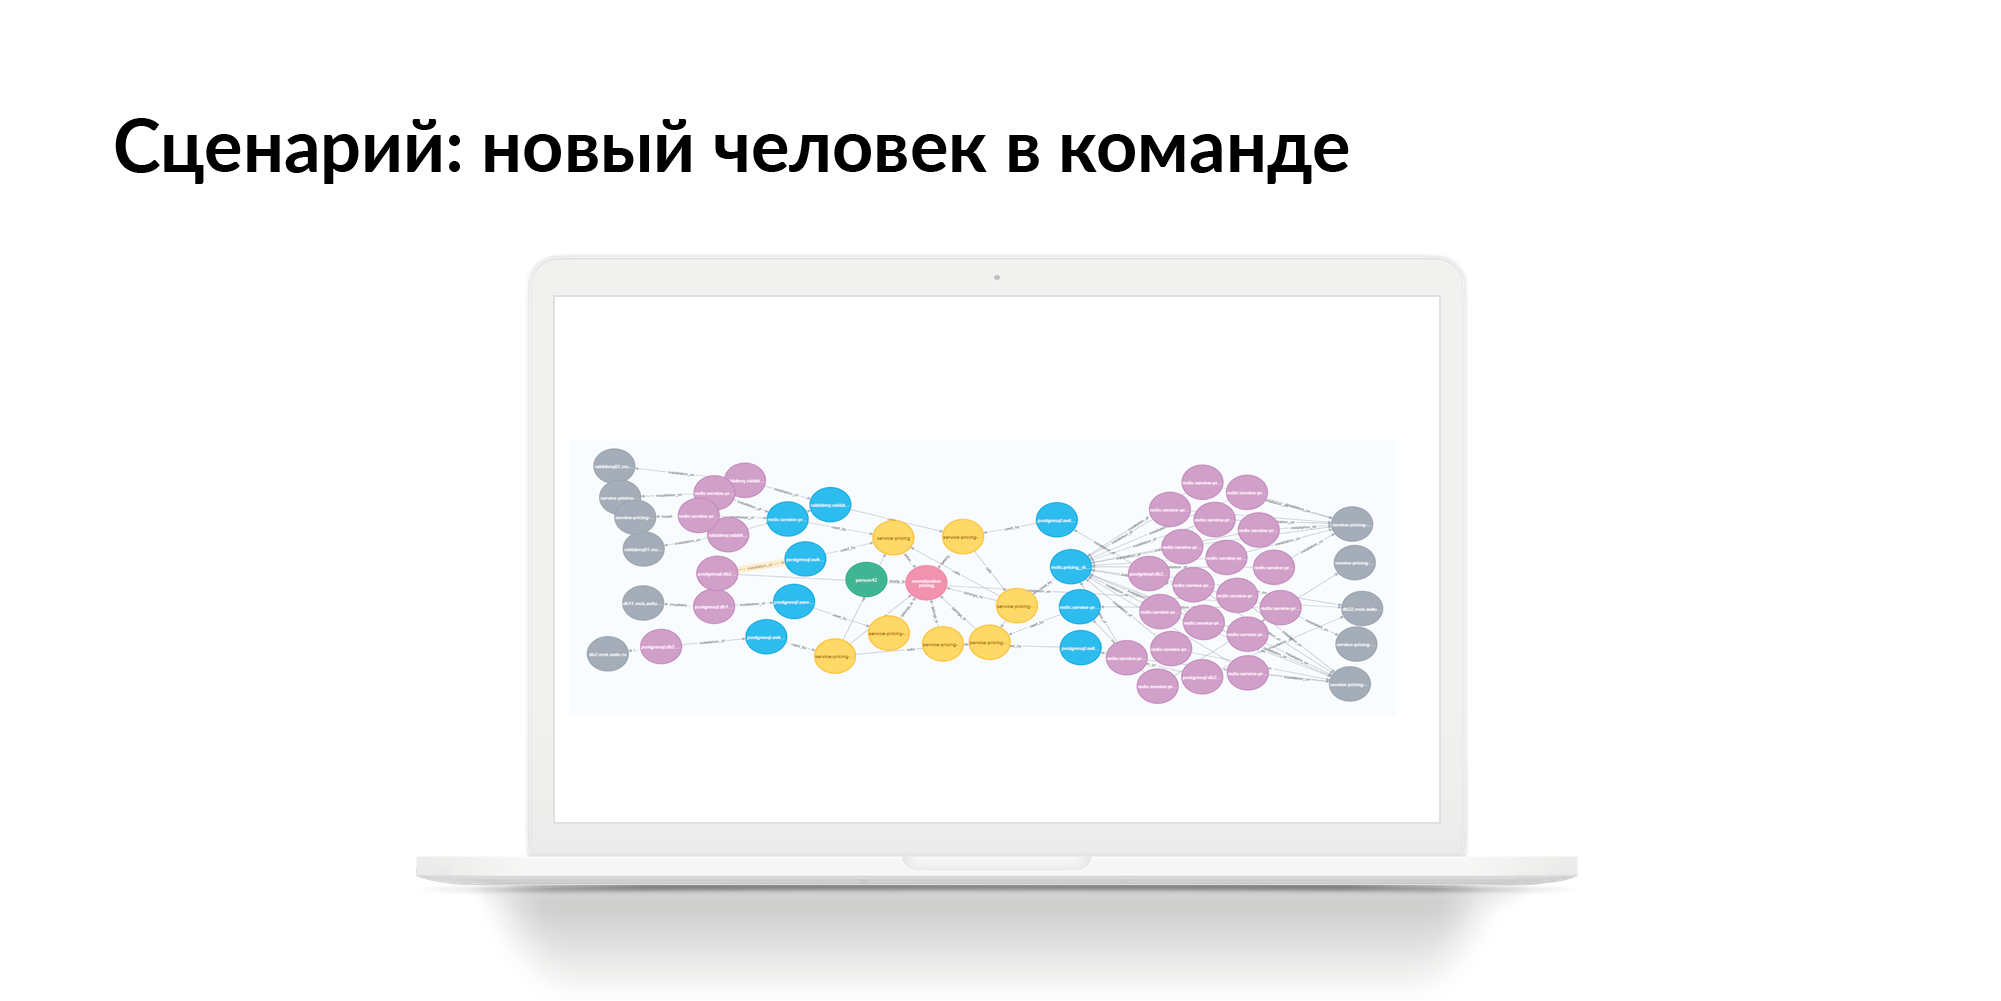
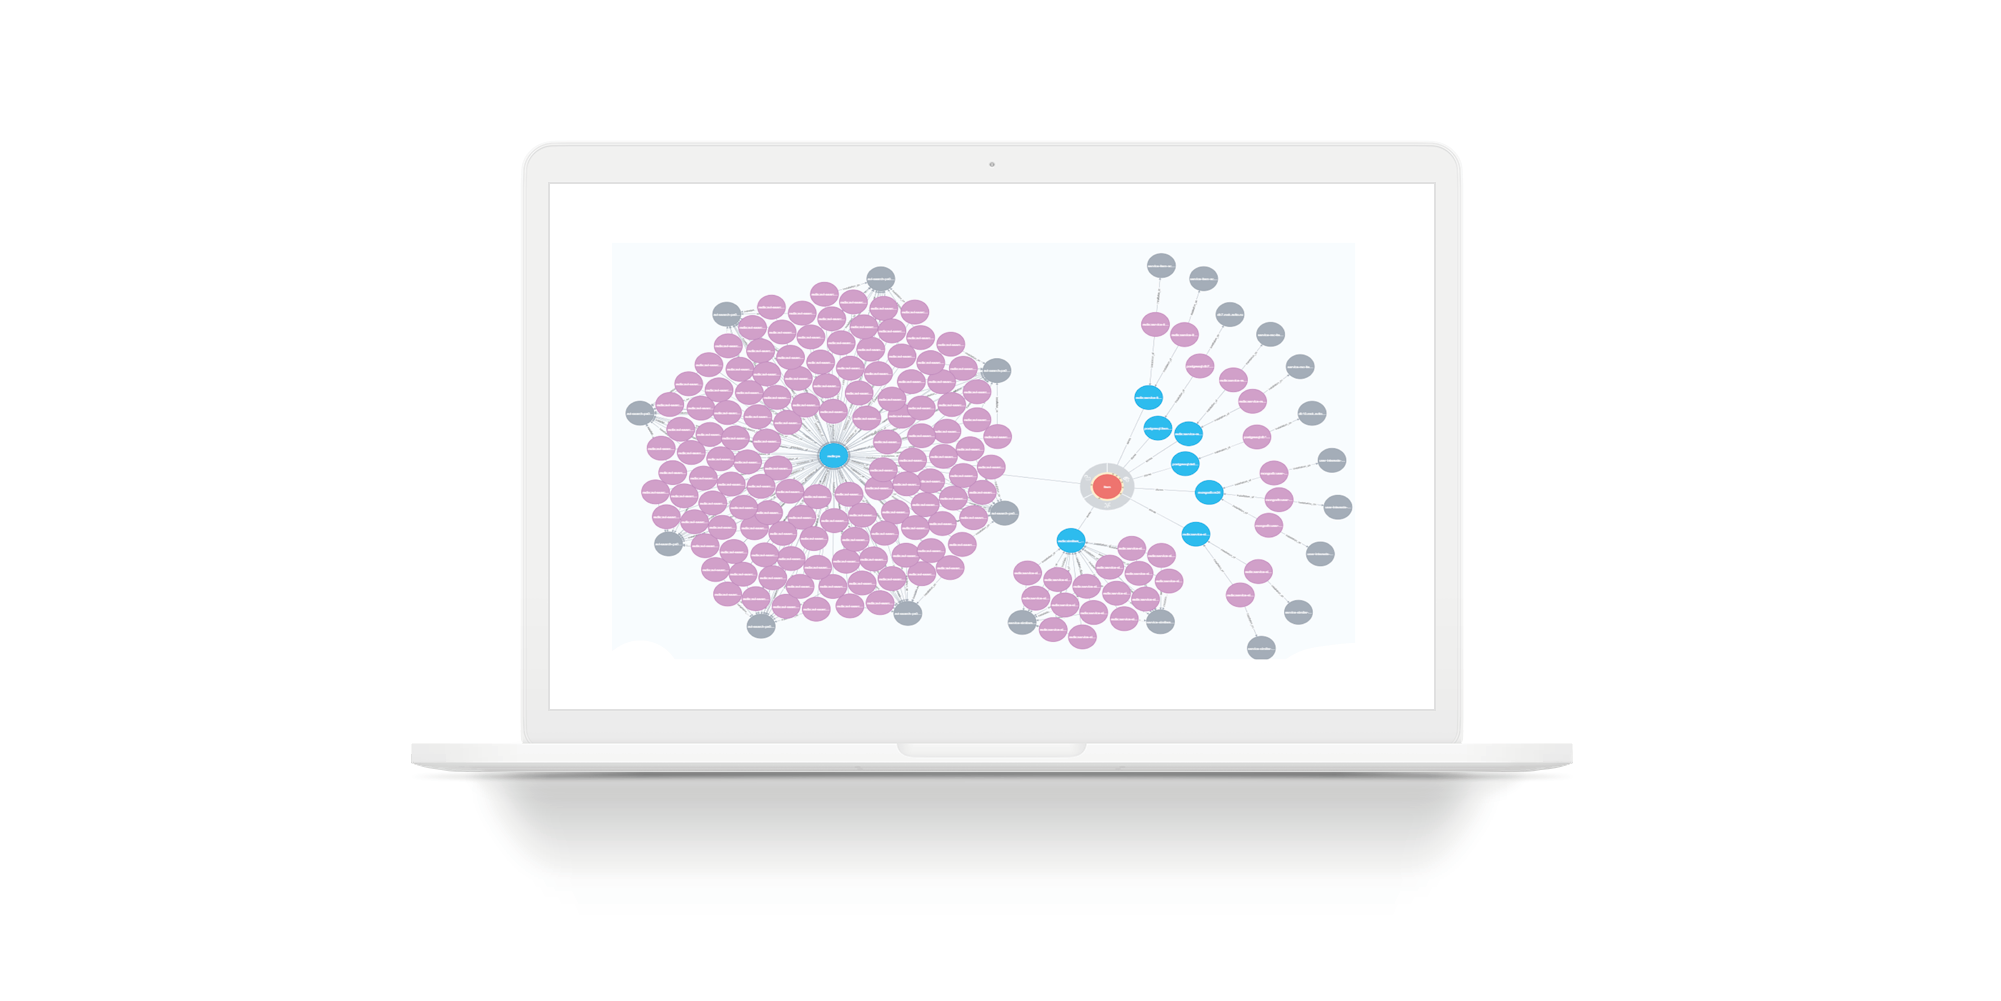
Consider an example when a team needs to take a new employee. He needs to be given access (for starters - read only) to all services, to all storage of this command. On the slide, the real team with an incomplete selection. Green circles are team leaders. Pink circles are teams. Yellow are services. A number of yellow services have blue storage. Gray ones are hosts. Violet is a storage installation on hosts. This is an example for a small unit. But there are many units whose services are not 7, but 27. For such units, the picture will be large. If you use Persistent Fabric, you can make requests in it and get answers in a list.
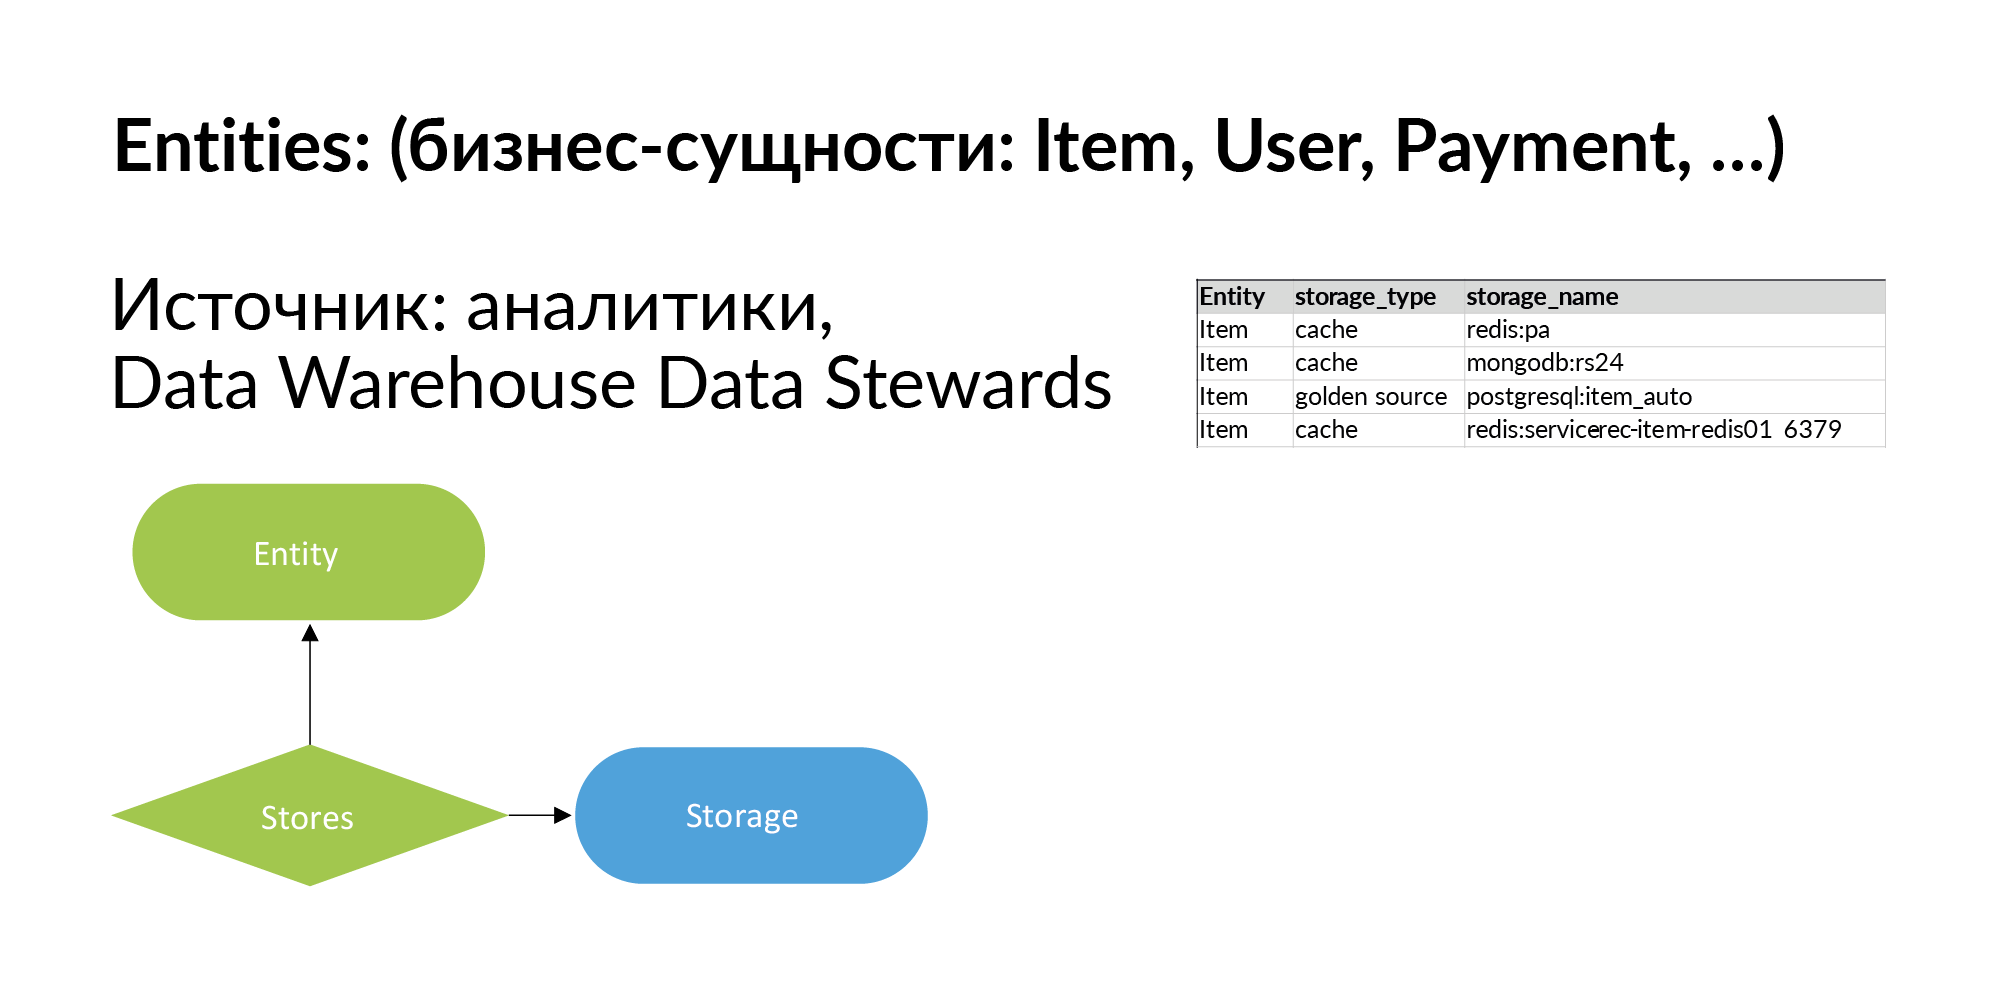
Let's continue filling our smart fabric and talk about business entities. Entities in Avito are announcements, users, payments, and so on. From my publications ( HP Vertica, designing a data warehouse, big data , Vertica + Anchor Modeling = start growing your mushroom ) about data warehouses, you know that there are hundreds of these entities in Avito. In fact, it is not necessary to log all of them. Where can I get the list of entities from? From the analytic repository. You can upload information about where they get this entity from. In the first stage, this is enough.
Further we develop this knowledge: for each entity we make a list of repositories where it is. We also indicate that storage stores the entity as a cache or storage stores the entity as Golden Source, that is, it is its primary source.

When you fill out this column, you will be able to make requests. You have some entity, and you need to understand: in what services does the entity live, where does it reflect, in which storage, on which hosts is it installed? For example, when processing personal data, you need to destroy log files. To do this, it is very important to understand on which physical machines the log files can remain.
The slide illustrates a simple query for an imaginary entity. The amount of storage is reduced so that the graph fits onto the slide. Red circles are entities. Blue circles are the bases where this entity is located. The rest is as on the previous slides: gray circles are hosts, purple circles are storage installations on hosts.
Accordingly, if you want to go through PCI DSS, you need to restrict access to certain entities. To do this, you need to restrict access to the gray circles. If you need real-time access, we close access to the purple circles. This is static information.
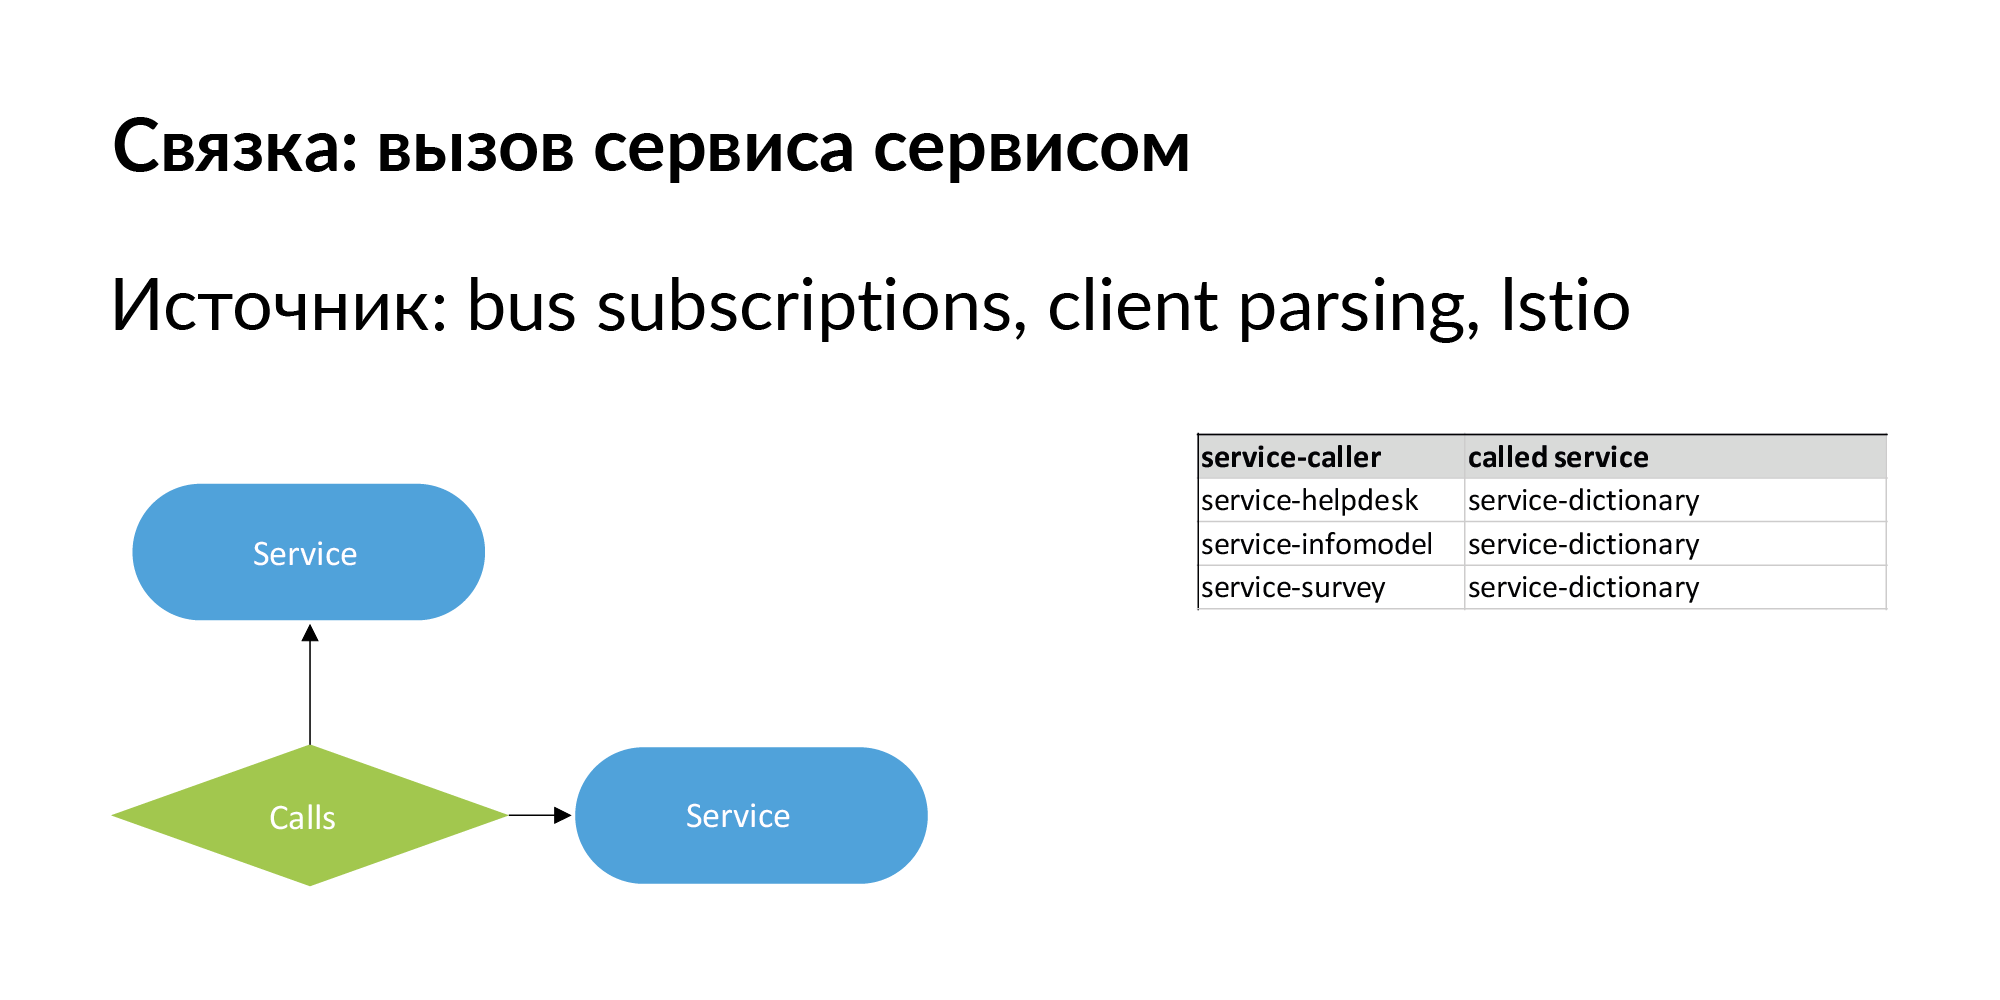
When we talk about microservice architecture, the most important thing is that it changes. It is important to have not just a hierarchical relationship between entities, but also sibling relationships. A bunch of services is an example of single-level connections, which we have pumped well and use. A bundle of the form “service calls service”. There is information about direct calls - the service calls the API of another service.
There should also be information about the connection of the form: service No. 1 sends events to the bus (queue), and service No. 2 is subscribed to this event. It is like an asynchronous slow connection passing through a bus. This relationship is also important in terms of data movement. Using such links, you can check the operation of services if the version of the service to which they are subscribed has changed.
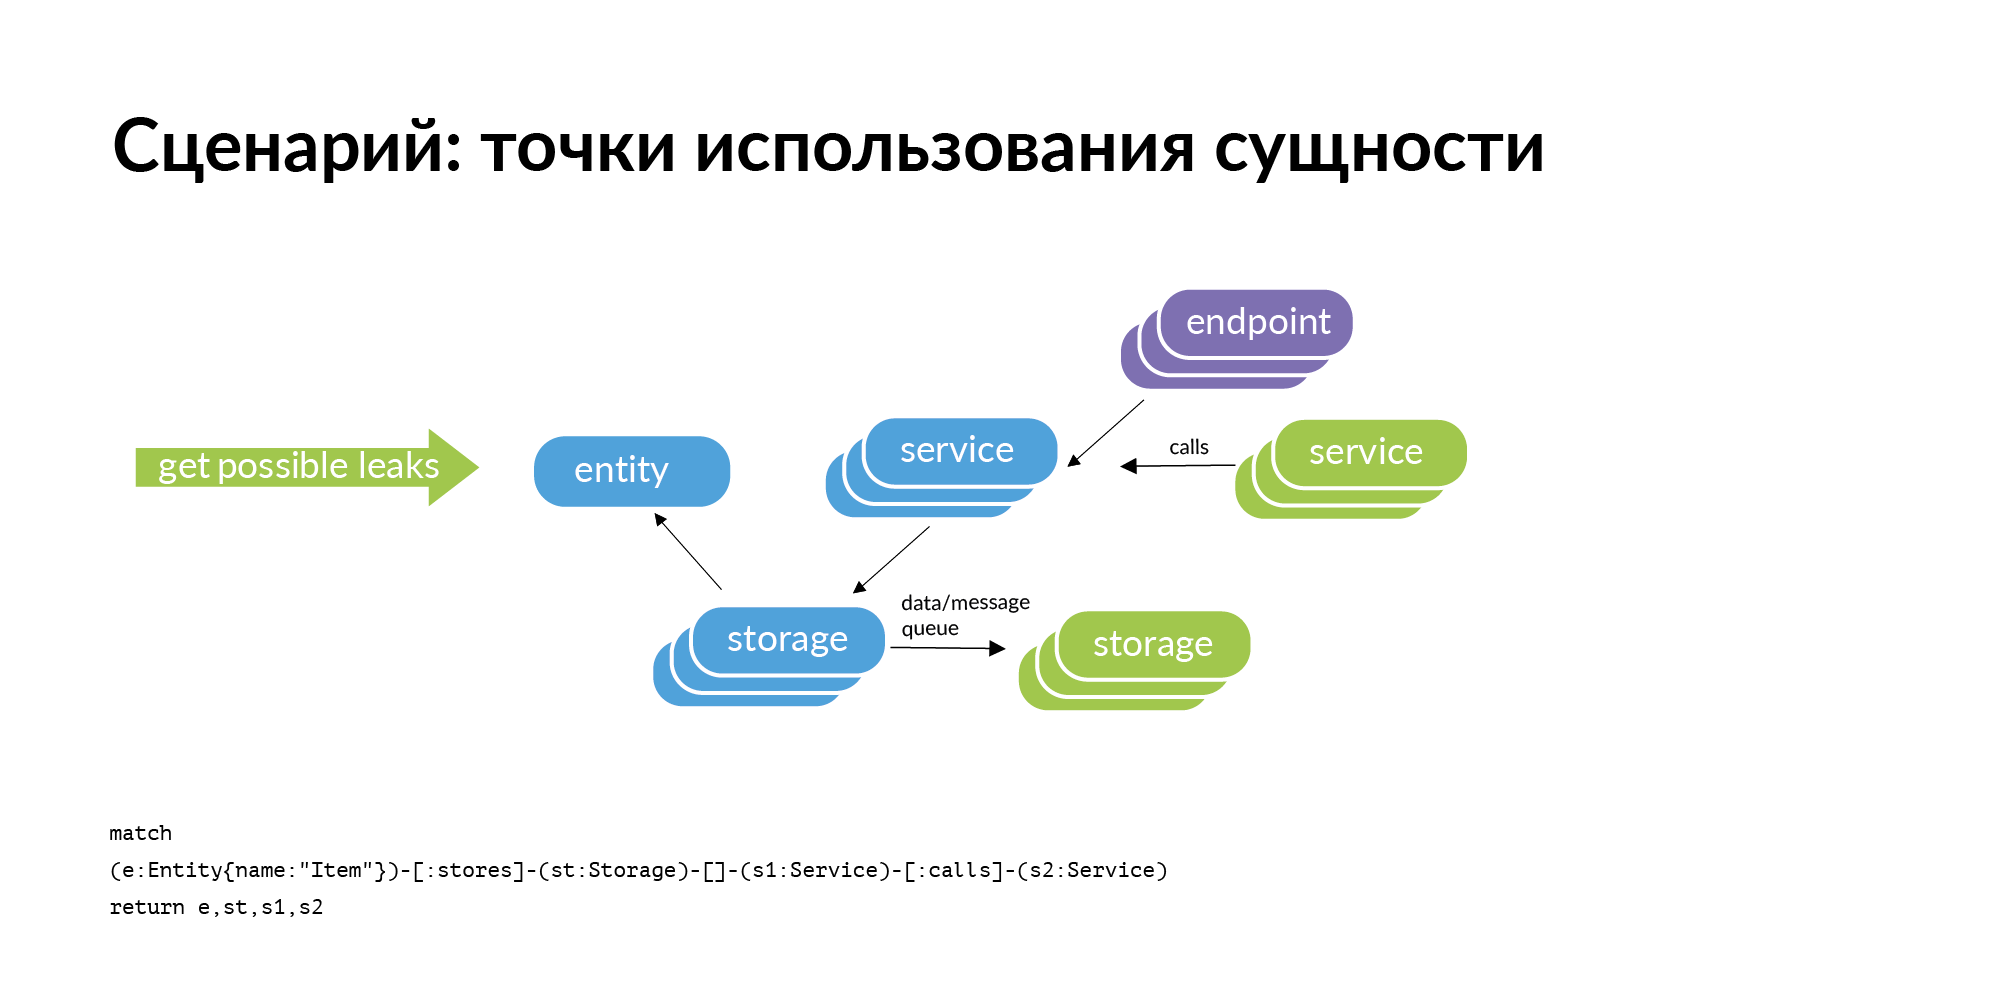
There is an entity and we know that it is stored in certain storage. If we consider the problem of finding points of using the entity, then the obvious query that arises with us is the perimeter check. Storage belong to some services. Where can this entity leak (be copied) from the perimeter? It can leak through service calls. The service contacted, received and retained the user. It can leak through tires. Tires can connect you to each other using RabbitMQ, Londiste. On the Londiste slide, we haven't loaded it yet. But the calls are already loaded.
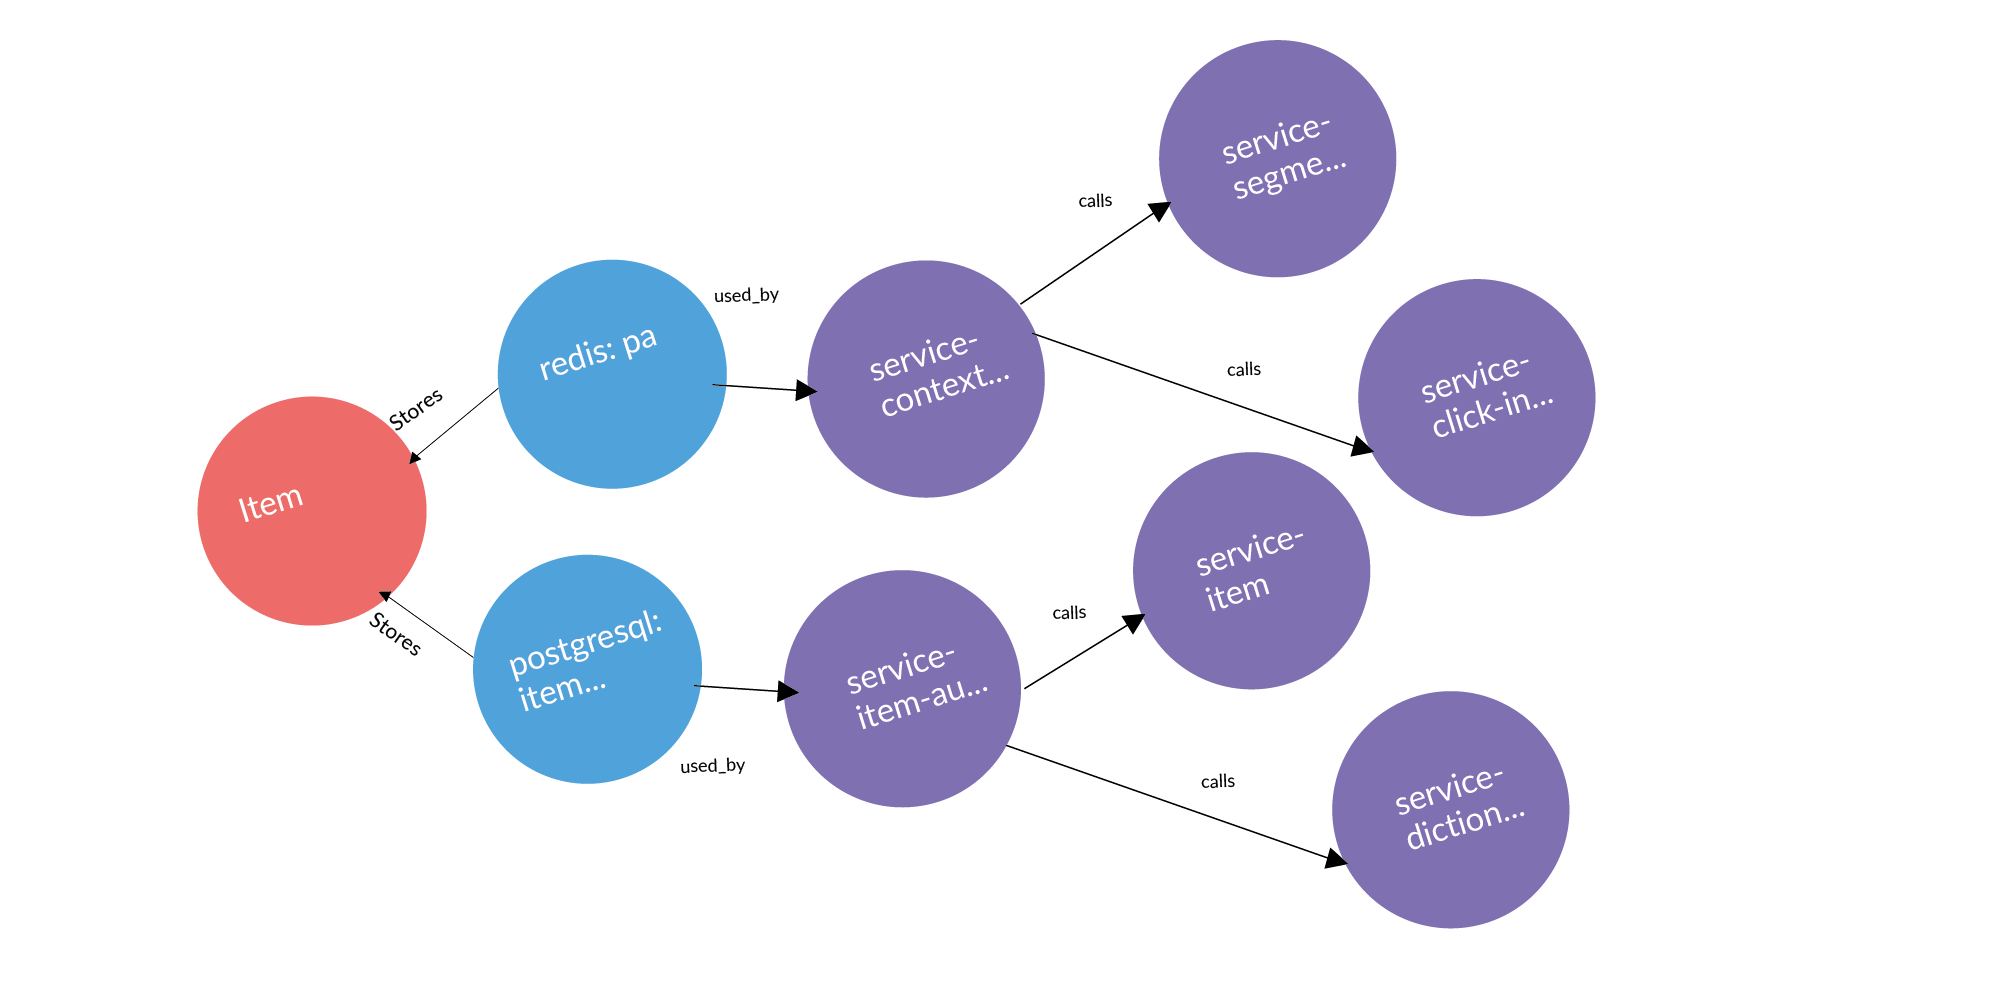
Here is an example of a real request: an ad, two databases where it is stored, two services that own these databases. After three columns are services that work with services that own this entity. These are potential leak points worth adding.
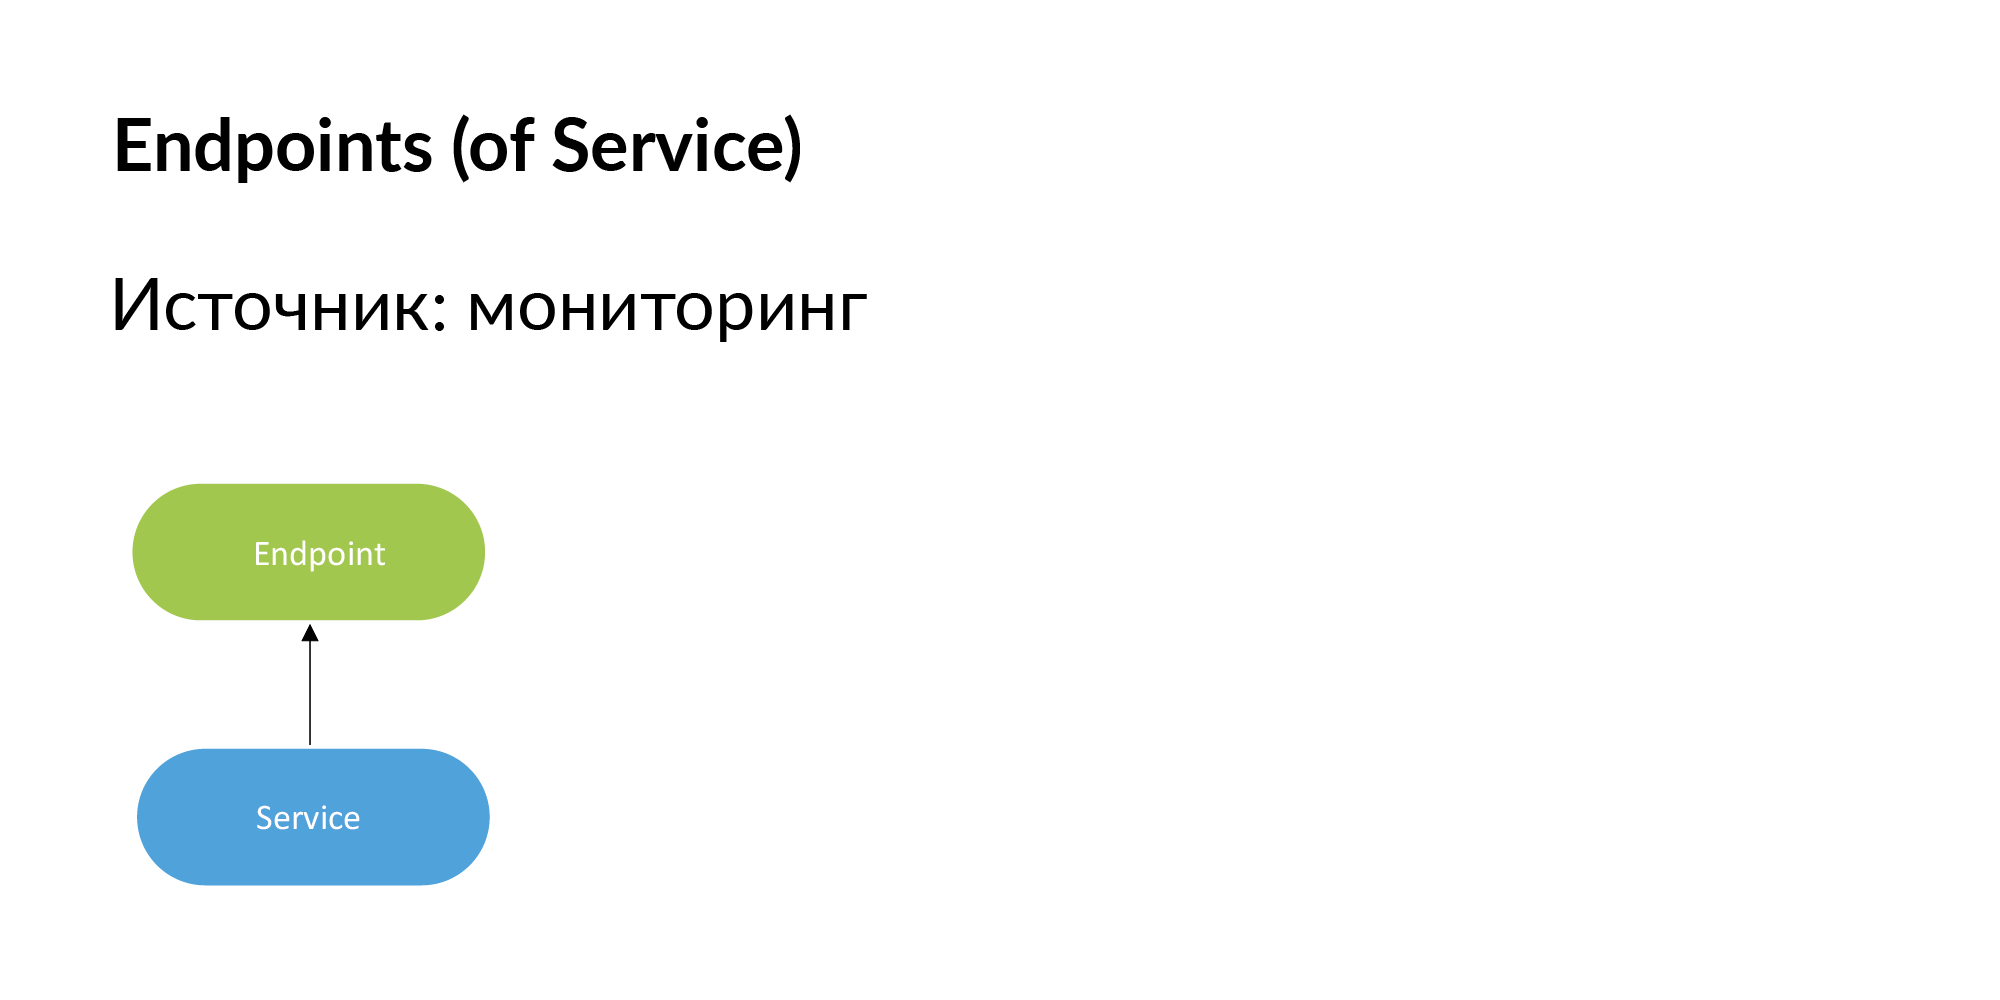
Endpoints. Vadim mentioned that you can use documentation to build a registry of endpoints services. You can also get this information from monitoring. If Endpoint is important, then the developers themselves will add it to monitoring. If Endpoint is not monitored, then we do not need it.
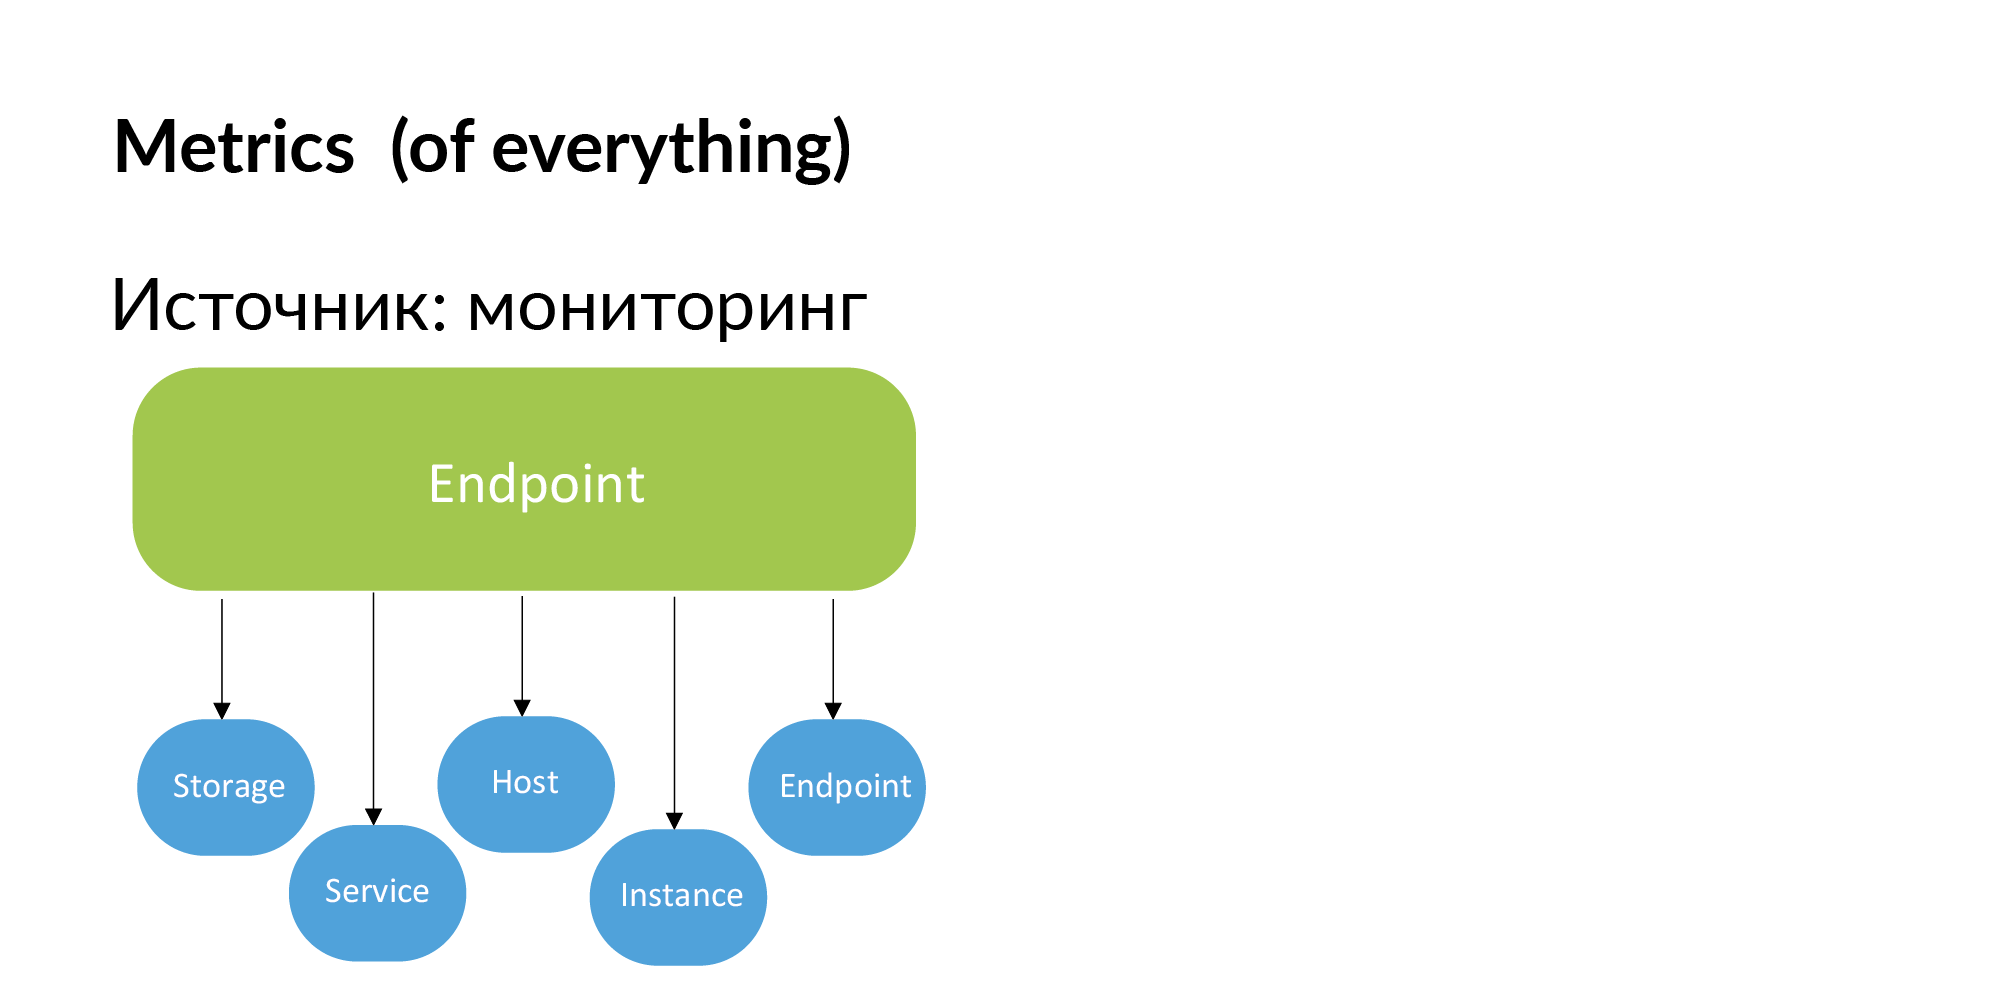
Accordingly, metrics can be obtained from monitoring. Binding metrics to storage, to services, to hosts, to instance (database shards) and endpoint.

When you encounter a failure, for example, endpoint returns an HTTP code of 500, then in order to track the root of the problem, you need to make a request for this endpoint. From endpoint go to service, go to services that this service calls, from services go to storage, from storage go to instance and hosts.
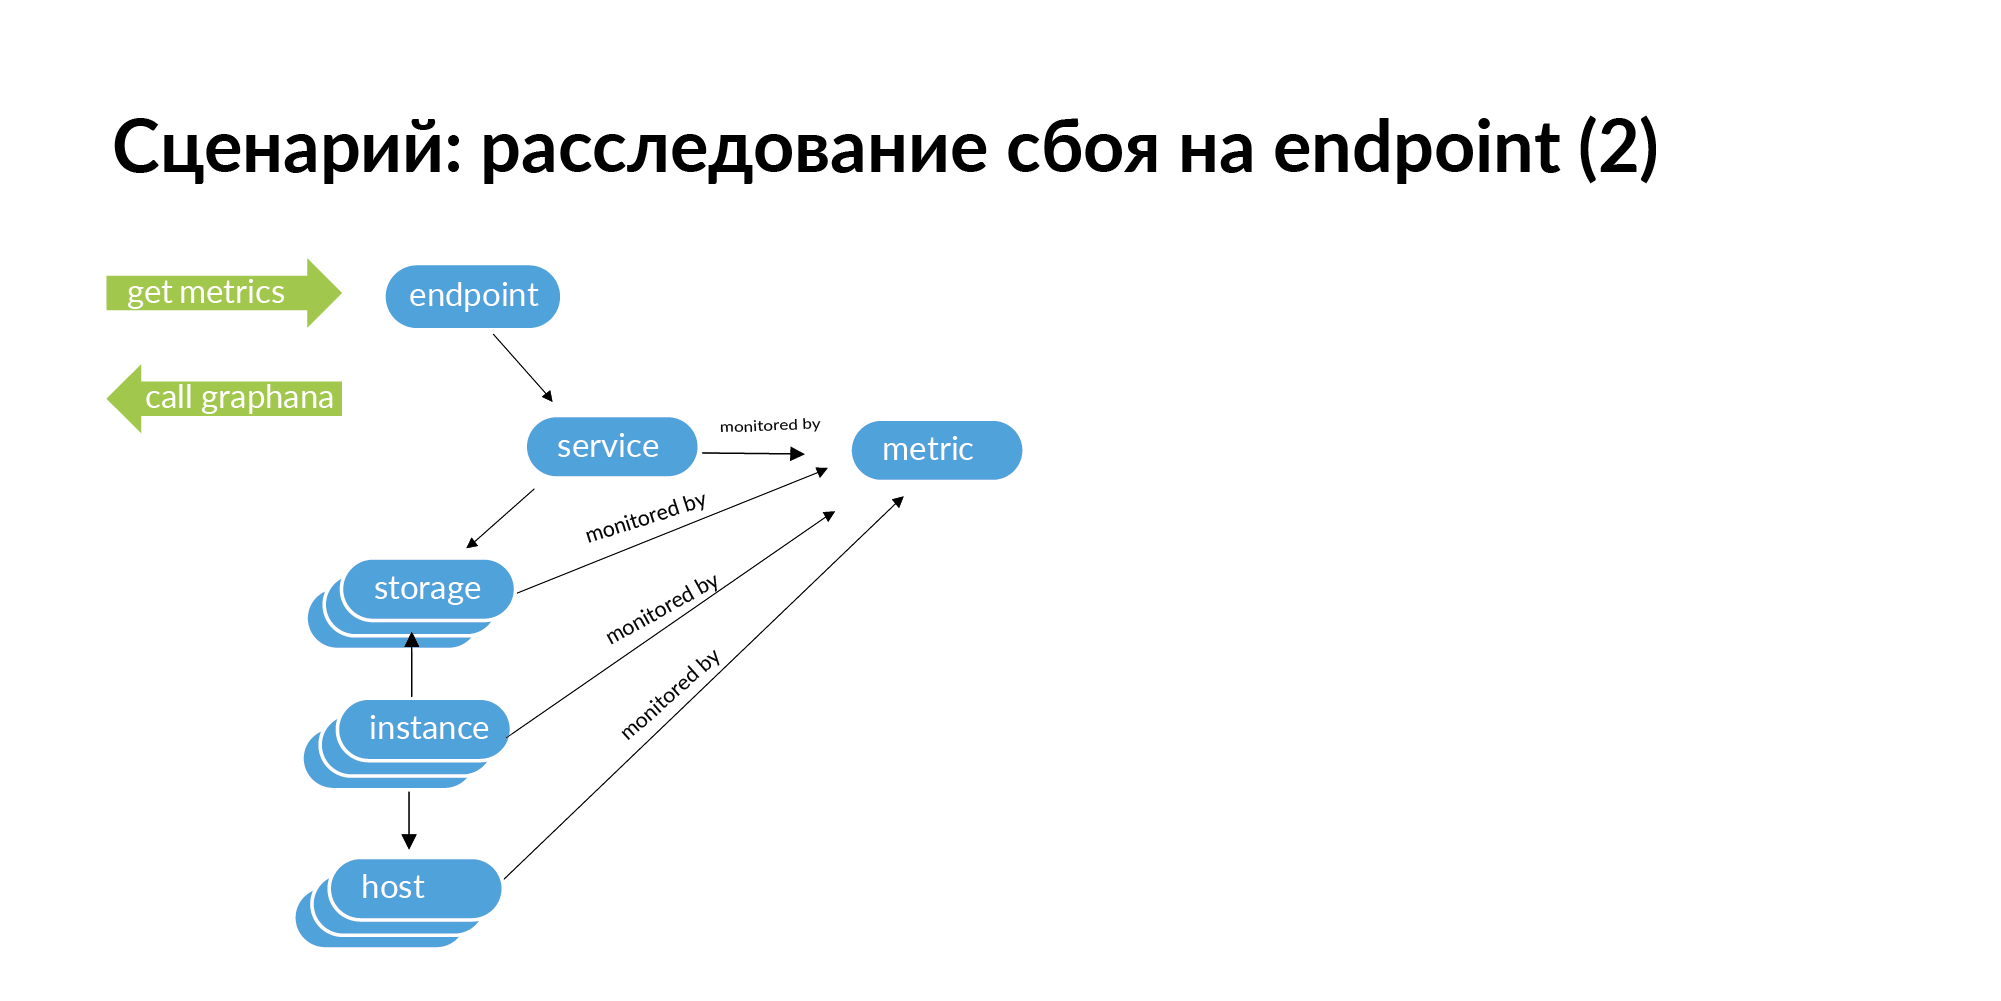
Further, if you go down this graph, on its basis you can get a list of identifiers for monitoring. You can look for this endpoint the whole chain down, which may cause a failure. In a microservice architecture, a failure at the endpoint can be caused by a network failure on some server on which one database shard is deployed. This can be seen in monitoring, but with a large service structure, it is very laborious to check all services in monitoring.

Testing. In order to adequately test a microservice, you need to check the service with other services that it needs to work. You need to raise in your test environment the services that it calls. And for the called services, raise all the bases. In our remembering fabric, we get a connected subgraph. In this column, not all connections are needed; some can be neglected. This subgraph can be isolated load tested as a fully enclosed system.
It would be great now to show the Avito entity graph, where isolated subgraphs of microservices that can be independently raised can be tested and rolled out in production. In fact, it turned out that the call subgraph of almost any microservice enters and leaves the monolith. This is an illustration of the fact that if you develop microservices and do not think about such consequences, as a result, the microservice architecture still will not work without a monolith and does not allow for isolated testing does not allow.
But such a graph representation allows you to find candidates for becoming isolated subgraphs. This subset of services is almost ready to work in isolation. It is only necessary to refactor a couple of calls. This allows you to prioritize the partition of the monolith in terms of reducing the connectivity of the architecture.
And finally - about how to support and fill it all. This is quite simple to do with a few rules.
- You can not force people to fill out all the dependencies of all services. Each source needs to fill out only its own small piece of information. The service layer is populated from the main source. Services missing from this source are filled out from hand tools. From the second source storage are filled. From the third - the server. From the fourth endpoint. Links from separate sources are filled out, that the service belongs to the team, that the person has become a technical expert, etc. Information should be filled quickly and easily.
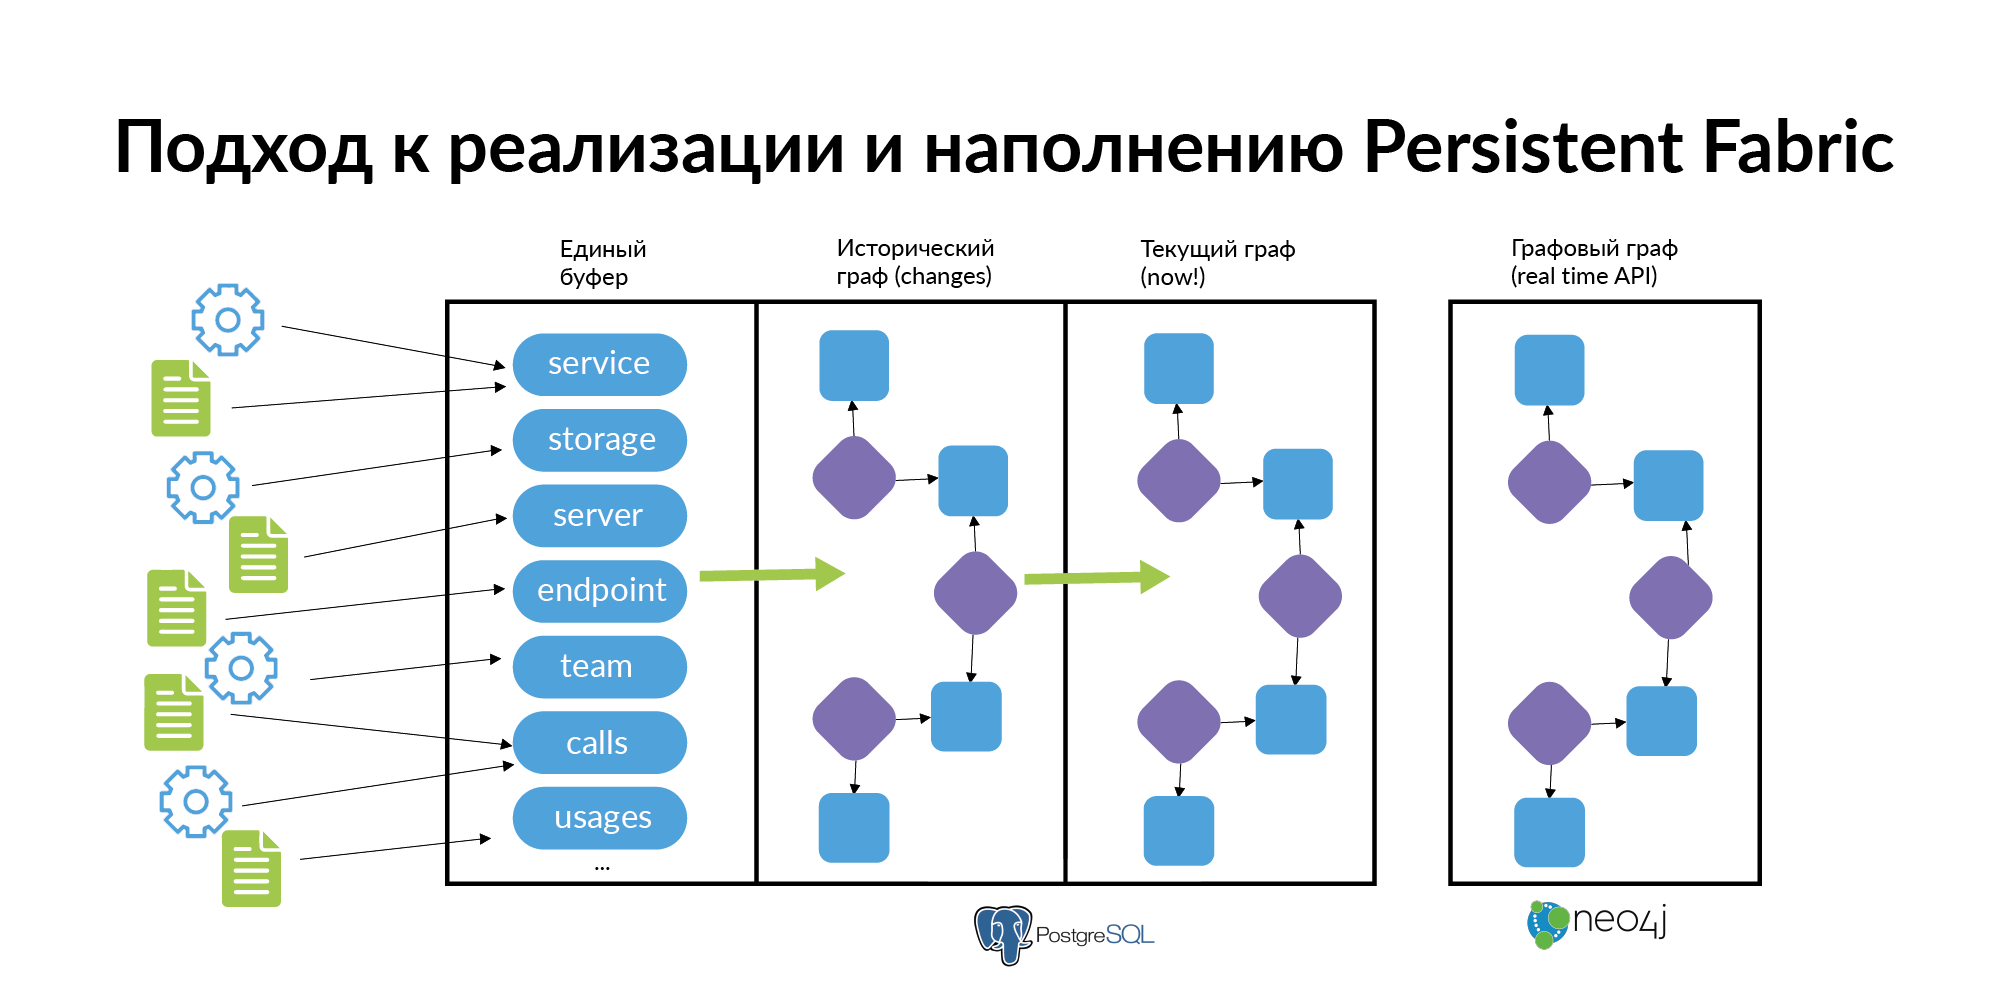
- Information about the graph in compliance with historicity should be uploaded to the database. Since the real microservice architecture is constantly “breathing” and changing. Services arise, die, new databases appear, connection appears, the old connection is canceled, people walk between teams. When investigating incidents, it is useful to know in which service the entity lives and in which service the entity lived before. (How to make a graph of historical connections, you can find in my post about Anchor Modeling ). Most people do not need historicity to work with data. They need an up-to-date “now” cut. Based on the historical graph, a graph showcase for the current moment should be built. Avito uses the Neo4j database, which can be used for visualization.
- The more employees use the graph, the more they get an incentive to keep track of its relevance. Each layer of this fabric can be filled with a separate team. For example, frontend developers fill in UI points, backend developers fill in services, DBA fill in storage, DevOps engineers fill in servers, analytics fill in entities.
In-progress tasks
In some areas, we are continuing to work.
We want to add more information about the data flow through the bus (Londiste, PGQ, RabbitMQ).
We are also trying to add graphs of user paths. The UI points communication graph is formed on information about how users walk between them. Now this is done at the client logging level. At this time, we are moving to combining this information and forwarding into a Persistent Fabric so that user experience can be translated into UI points, from there to Endpoint, and from there to services. From this information to understand what we users most often use and find out, for example, why a small service, not very loaded and not very important, so the user experience affects.
All Articles