Learn OpenGL. Lesson 7.1 - Debugging
 Graphic programming is not only a source of fun, but also frustration when something does not appear as intended, or nothing is displayed on the screen at all. Seeing that most of what we do is related to pixel manipulation, it can be difficult to figure out the cause of the error when something doesn't work as it should. Debugging this type of error is more difficult than debugging errors on the CPU. We don’t have a console where we can output the text, we can’t put a breakpoint in the shader and we can’t just take and check the status of the program on the GPU.
In this tutorial, we will introduce you to some of the debugging methods and techniques for your OpenGL program. Debugging in OpenGL is not so difficult, and learning some tricks will definitely pay off.
- Debugging
- Text rendering
glGetError ()
When you use OpenGL incorrectly (for example, when you set up a buffer and forget to bind it), OpenGL will notice and create one or more custom error flags behind the scenes. We can track these errors by calling the glGetError()
function, which simply checks the error flags set and returns the error value if errors occur.
GLenum glGetError();
This function returns an error flag or no error at all. Return Values List:
| Flag | Code | Description |
|---|---|---|
GL_NO_ERROR
| 0 | No error was generated after the last glGetError call |
GL_INVALID_ENUM
| 1280 | Set when an enumeration parameter is invalid |
GL_INVALID_VALUE
| 1281 | Set when the value is invalid |
GL_INVALID_OPERATION
| 1282 | Set when a command with the given parameters is invalid |
GL_STACK_OVERFLOW
| 1283 | It is established when the operation of pushing data onto the stack (push) causes a stack overflow. |
GL_STACK_UNDERFLOW
| 1284 | It is established when the operation of popping data from the stack (pop) occurs from the smallest point on the stack. |
GL_OUT_OF_MEMORY
| 1285 | Set when the memory allocation operation cannot allocate enough memory. |
GL_INVALID_FRAMEBUFFER_OPERATION
| 1286 | Set when reading / writing to / from a framebuffer that is not complete |
Inside the documentation for OpenGL functions, you can find error codes that are generated by functions that are incorrectly used. For example, if you look at the documentation for the glBindTexture()
function, you can find the error codes generated by this function in the Errors section.
When the error flag is set, no other error flags will be generated. Moreover, when glGetError
is called, the function erases all error flags (or only one on a distributed system, see below). This means that if you call glGetError
once after each frame and get an error, this does not mean that this is the only error and you still do not know where this error occurred.
Note that when OpenGL works in a distributed fashion, as is often the case on systems with X11, other errors can be generated while they have different codes. CallingglGetError
then simply flushes only one of the error code flags instead of all. Because of this, they recommend calling this function in a loop.
glBindTexture(GL_TEXTURE_2D, tex); std::cout << glGetError() << std::endl; // 0 ( ) glTexImage2D(GL_TEXTURE_3D, 0, GL_RGB, 512, 512, 0, GL_RGB, GL_UNSIGNED_BYTE, data); std::cout << glGetError() << std::endl; // 1280 ( ) glGenTextures(-5, textures); std::cout << glGetError() << std::endl; // 1281 ( std::cout << glGetError() << std::endl; // 0 ( )
A distinctive feature of glGetError
is that it makes it relatively easy to determine where any error may occur and to verify that OpenGL is used correctly. Let's say that you don’t draw anything, and you don’t know what the reason is: the frame buffer set incorrectly? Forgot to set the texture? By calling glGetError
everywhere, you can quickly figure out where the first error occurs.
By default, glGetError
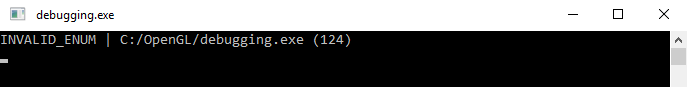
reports only the error number, which is not easy to understand until you memorize the code numbers. It often makes sense to write a small function to help print an error string along with the location from where the function is called.
GLenum glCheckError_(const char *file, int line) { GLenum errorCode; while ((errorCode = glGetError()) != GL_NO_ERROR) { std::string error; switch (errorCode) { case GL_INVALID_ENUM: error = "INVALID_ENUM"; break; case GL_INVALID_VALUE: error = "INVALID_VALUE"; break; case GL_INVALID_OPERATION: error = "INVALID_OPERATION"; break; case GL_STACK_OVERFLOW: error = "STACK_OVERFLOW"; break; case GL_STACK_UNDERFLOW: error = "STACK_UNDERFLOW"; break; case GL_OUT_OF_MEMORY: error = "OUT_OF_MEMORY"; break; case GL_INVALID_FRAMEBUFFER_OPERATION: error = "INVALID_FRAMEBUFFER_OPERATION"; break; } std::cout << error << " | " << file << " (" << line << ")" << std::endl; } return errorCode; } #define glCheckError() glCheckError_(__FILE__, __LINE__)
If you decide to make more calls to glCheckError
, it will be useful to know where the error occurred.
glBindBuffer(GL_VERTEX_ARRAY, vbo); glCheckError();
Conclusion:
One important thing remains: there is a long-standing bug in GLEW: glewInit()
always sets the GL_INVALID_ENUM
flag. To fix this, simply call glGetError
after glewInit
to clear the flag:
glewInit(); glGetError();
glGetError
does not help much, since the information returned is relatively simple, but it often helps to catch typos or catch the place where the error occurred. This is a simple but effective debugging tool.
Debug output
The tool is less well-known, but more useful than glCheckError
, the OpenGL extension "debug output" included in the OpenGL 4.3 Core Profile. With this extension, OpenGL will send an error message to the user with the details of the error. This extension not only provides more information, but also allows you to catch errors where they occur using the debugger.
Debugging output has been included in OpenGL since version 4.3, which means that you will find this functionality on any machine that supports OpenGL 4.3 and higher. If this version is not available, then you can check the extensionsARB_debug_output
andAMD_debug_output
. There is also unverified information that debugging output is not supported on OS X (the author of the original and the translator have not tested, please inform the author of the original or to me in private messages through the error correction mechanism, if you find confirmation or refutation of this fact; UPD: Jeka178RUS checked this fact: out of the box, the debug output does not work, he did not check through the extensions).
To start using debugging output, we need to request OpenGL debugging context during the initialization process. This process is different on different window systems, but here we will discuss only GLFW, but at the end of the article in the "Additional Materials" section you can find information about other window systems.
Debug output in GLFW
Requesting a debugging context in GLFW is surprisingly simple: you just need to give the GLFW a hint that we want a context with debugging support. We need to do this before calling glfwCreateWindow
:
glfwWindowHint(GLFW_OPENGL_DEBUG_CONTEXT, GL_TRUE);
As soon as we initialized GLFW, we should have a debugging context if we use OpenGL 4.3 or higher, otherwise we need to try our luck and hope that the system can still create a debugging context. In case of failure, we need to request debug output through the OpenGL extension mechanism.
The OpenGL debugging context can be slower than normal, so you should remove or comment out this line while working on optimizations or before release.
To check the result of initializing the debugging context, it is enough to execute the following code:
GLint flags; glGetIntegerv(GL_CONTEXT_FLAGS, &flags); if (flags & GL_CONTEXT_FLAG_DEBUG_BIT) { // } else { // }
How does debug output work? We pass a callback function to a message handler in OpenGL (similar to callbacks in GLFW) and in this function we can process OpenGL data as we like, in our case sending useful error messages to the console. The prototype of this function:
void APIENTRY glDebugOutput(GLenum source, GLenum type, GLuint id, GLenum severity, GLsizei length, const GLchar *message, void *userParam);
Note that on some operating systems the type of the last parameter may be const void*
.
Given the large data set that we have, we can create a useful error printing tool, as shown below:
void APIENTRY glDebugOutput(GLenum source, GLenum type, GLuint id, GLenum severity, GLsizei length, const GLchar *message, void *userParam) { // ignore non-significant error/warning codes if(id == 131169 || id == 131185 || id == 131218 || id == 131204) return; std::cout << "---------------" << std::endl; std::cout << "Debug message (" << id << "): " << message << std::endl; switch (source) { case GL_DEBUG_SOURCE_API: std::cout << "Source: API"; break; case GL_DEBUG_SOURCE_WINDOW_SYSTEM: std::cout << "Source: Window System"; break; case GL_DEBUG_SOURCE_SHADER_COMPILER: std::cout << "Source: Shader Compiler"; break; case GL_DEBUG_SOURCE_THIRD_PARTY: std::cout << "Source: Third Party"; break; case GL_DEBUG_SOURCE_APPLICATION: std::cout << "Source: Application"; break; case GL_DEBUG_SOURCE_OTHER: std::cout << "Source: Other"; break; } std::cout << std::endl; switch (type) { case GL_DEBUG_TYPE_ERROR: std::cout << "Type: Error"; break; case GL_DEBUG_TYPE_DEPRECATED_BEHAVIOR: std::cout << "Type: Deprecated Behaviour"; break; case GL_DEBUG_TYPE_UNDEFINED_BEHAVIOR: std::cout << "Type: Undefined Behaviour"; break; case GL_DEBUG_TYPE_PORTABILITY: std::cout << "Type: Portability"; break; case GL_DEBUG_TYPE_PERFORMANCE: std::cout << "Type: Performance"; break; case GL_DEBUG_TYPE_MARKER: std::cout << "Type: Marker"; break; case GL_DEBUG_TYPE_PUSH_GROUP: std::cout << "Type: Push Group"; break; case GL_DEBUG_TYPE_POP_GROUP: std::cout << "Type: Pop Group"; break; case GL_DEBUG_TYPE_OTHER: std::cout << "Type: Other"; break; } std::cout << std::endl; switch (severity) { case GL_DEBUG_SEVERITY_HIGH: std::cout << "Severity: high"; break; case GL_DEBUG_SEVERITY_MEDIUM: std::cout << "Severity: medium"; break; case GL_DEBUG_SEVERITY_LOW: std::cout << "Severity: low"; break; case GL_DEBUG_SEVERITY_NOTIFICATION: std::cout << "Severity: notification"; break; } std::cout << std::endl; std::cout << std::endl; }
When the extension detects an OpenGL error, it will call this function and we will be able to print a huge amount of error information. Note that we ignored some errors, since they are useless (for example, 131185 in the NVidia drivers indicates that the buffer was created successfully).
Now that we have the desired callback, it's time to initialize the debug output:
if (flags & GL_CONTEXT_FLAG_DEBUG_BIT) { glEnable(GL_DEBUG_OUTPUT); glEnable(GL_DEBUG_OUTPUT_SYNCHRONOUS); glDebugMessageCallback(glDebugOutput, nullptr); glDebugMessageControl(GL_DONT_CARE, GL_DONT_CARE, GL_DONT_CARE, 0, nullptr, GL_TRUE); }
So we tell OpenGL that we want to enable debug output. The call to glEnable(GL_DEBUG_SYNCRHONOUS)
tells OpenGL that we want an error message when it just happened.
Debug Output Filtering
With the glDebugMessageControl
function glDebugMessageControl
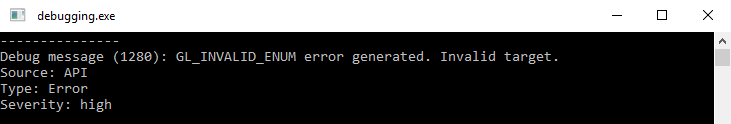
you can select the types of errors you want to receive. In our case, we get all kinds of errors. If we only wanted the OpenGL API errors, such as Error and the significance level High, we would write the following code:
glDebugMessageControl(GL_DEBUG_SOURCE_API, GL_DEBUG_TYPE_ERROR, GL_DEBUG_SEVERITY_HIGH, 0, nullptr, GL_TRUE);
With this configuration and debugging context, every incorrect OpenGL command will send a lot of useful information:
Find the source of the error through the call stack
Another trick with debugging output is that you can relatively easily establish the exact location of the error in your code. By setting a breakpoint in the DebugOutput
function on the desired type of error (or at the beginning of the function if you want to catch all the errors), the debugger will catch the error and you can navigate the call stack to find out where the error occurred:
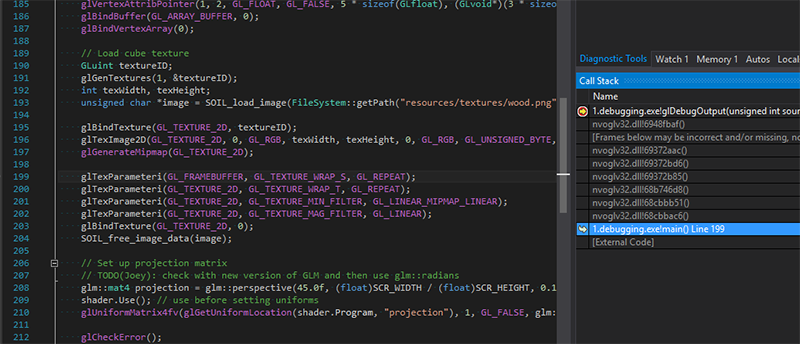
This requires some manual intervention, but if you know roughly what you are looking for, it is incredibly useful to quickly determine which call is causing the error.
Own mistakes
Along with reading errors, we can send them to the debug output system using glDebugMessageInsert
:
glDebugMessageInsert(GL_DEBUG_SOURCE_APPLICATION, GL_DEBUG_TYPE_ERROR, 0, GL_DEBUG_SEVERITY_MEDIUM, -1, "error message here");
This is very useful if you are connecting to another application or OpenGL code that uses a debugging context. Other developers will be able to quickly find out any reported error that occurs in your custom OpenGL code.
In general, debugging output (if available) is very useful for quickly catching errors and is definitely worth the effort spent on tuning, as it saves significant development time. You can find a copy of the source code here using glGetError
and debug output. There are errors, try to fix them.
Shader debug output
When it comes to GLSL, we don’t have access to functions like glGetError
or the ability to walk through the code in steps in the debugger. When you encounter a black screen or a completely incorrect display, it can be very difficult to understand what happens if the problem is in the shader. Yes, compilation errors report syntax errors, but catching semantic errors is that song.
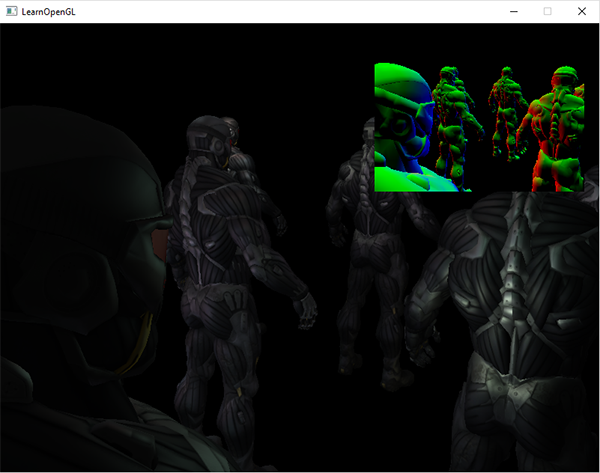
One of the commonly used methods for finding out what is wrong with a shader is to send all the relevant variables in the shader program directly to the output channel of the fragment shader. By outputting shader variables directly to the output channel with color, we can find out interesting information by checking the picture at the output. For example, we need to find out if the normals are correct for the model. We can send them (transformed or not) from the vertex to the fragment shader, where we derive the normals something like this:
(note per: why there is no syntax highlighting GLSL?)
#version 330 core out vec4 FragColor; in vec3 Normal; [...] void main() { [...] FragColor.rgb = Normal; FragColor.a = 1.0f; }
By outputting a non-color variable to the output channel with color as it is now, we can quickly check the value of the variable. If, for example, the result is a black screen, then it is clear that the normals are incorrectly transferred to the shaders, and when they are displayed, it is relatively easy to check them for correctness:
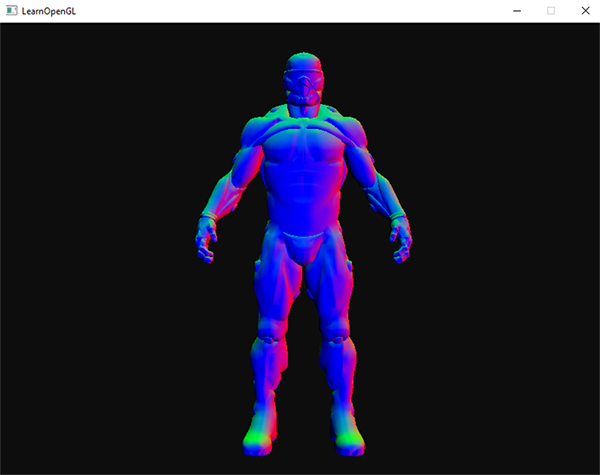
From the visual results, we can see that the normals are correct, since the right side of the suit is predominantly red (which means that the normals roughly show in the direction of the x-axis) and also the front side of the suit is colored in the direction of the positive z axis (blue).
This approach can be extended to any variable that you want to test. Every time you get stuck and assume that the error is in the shaders, try to draw some variables or intermediate results and find out in which part of the algorithm there is an error.
OpenGL GLSL reference compiler
Each video driver has its own quirks. For example, NVIDIA drivers slightly soften the requirements of the specification, and AMD drivers better meet the specifications (which is better, it seems to me). The problem is that shaders working on one machine may not make money on another because of differences in the drivers.
For several years of experience, you could learn all the differences between different GPUs, but if you want to be sure that your shaders will work everywhere, then you can verify your code with the official specification using the GLSL reference compiler . You can download the so-called GLSL lang validator here ( source ).
With this program you can test your shaders by passing them as the 1st argument to the program. Remember that the program determines the type of shader by extension:
-
.vert
: vertex shader -
.frag
: fragment shader -
.geom
: geometric shader -
.tesc
: tessellation controlling shader -
.tese
: tessellation computing shader -
.comp
: compute shader
Running the program is easy:
glslangValidator shader.vert
Note that if there are no errors, the program will not output anything. On a broken vertex shader, the output will look like:

The program will not show the differences between the GLSL compilers from AMD, NVidia or Intel, and cannot even report all the bugs in the shader, but it at least checks the shaders for compliance with the standards.
Frame buffer output
Another method for your toolkit is to display the contents of the frame buffer in a specific part of the screen. Most likely, you often use framebuffers, and since all the magic happens behind the scenes, it can be difficult to determine what is happening. Outputting the contents of a frame buffer is a useful technique to verify things are correct.
Note that the contents of the frame buffer, as explained here, work with textures, not with objects in the drawing buffers
Using a simple shader that draws a single texture, we can write a small function that quickly draws any texture in the upper right corner of the screen:
// vertex shader #version 330 core layout (location = 0) in vec2 position; layout (location = 1) in vec2 texCoords; out vec2 TexCoords; void main() { gl_Position = vec4(position, 0.0f, 1.0f); TexCoords = texCoords; }
//fragment shader #version 330 core out vec4 FragColor; in vec2 TexCoords; uniform sampler2D fboAttachment; void main() { FragColor = texture(fboAttachment, TexCoords); }
//main.cpp void DisplayFramebufferTexture(GLuint textureID) { if(!notInitialized) { // initialize shader and vao w/ NDC vertex coordinates at top-right of the screen [...] } glActiveTexture(GL_TEXTURE0); glUseProgram(shaderDisplayFBOOutput); glBindTexture(GL_TEXTURE_2D, textureID); glBindVertexArray(vaoDebugTexturedRect); glDrawArrays(GL_TRIANGLES, 0, 6); glBindVertexArray(0); glUseProgram(0); } int main() { [...] while (!glfwWindowShouldClose(window)) { [...] DisplayFramebufferTexture(fboAttachment0); glfwSwapBuffers(window); } }
This will give you a small window in the corner of the screen for debugging the output of the frame buffer. It is useful, for example, when you try to check the correctness of normals:
You can also expand this function so that it renders more than 1 texture. This is a quick way to get continuous feedback from anything in frame buffers.
External Debugger Programs
When all else fails, there is one more trick: to use third-party programs. They are built into the OpenGL driver and can intercept all OpenGL calls to give you a lot of interesting data about your application. These applications can profile the use of OpenGL functions, look for bottlenecks, and monitor frame buffers, textures, and memory. While working on (large) code, these tools can become invaluable.
I have listed several popular tools. Try each one and choose the one that suits you best.
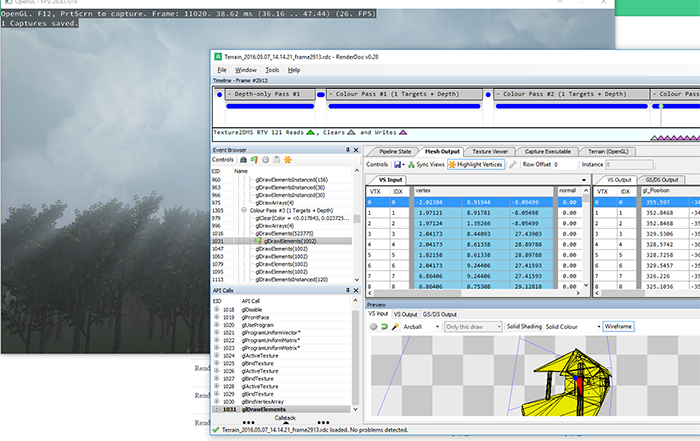
Renderderoc
RenderDoc is a good (fully open ) separate debugging tool. To start the capture, select the executable file and the working directory. Your application works as usual, and when you want to watch a single frame, you allow RenderDoc to capture several frames of your application. Among the captured frames, you can view the status of the pipeline, all OpenGL commands, buffer storage, and textures used.
Codexl
CodeXL - GPU debugging tool, works as a standalone application and plugin for Visual Studio. CodeXL Provides a lot of information and is great for profiling graphic applications. CodeXL also runs on graphics cards from NVidia and Intel, but without OpenCL debugging support.
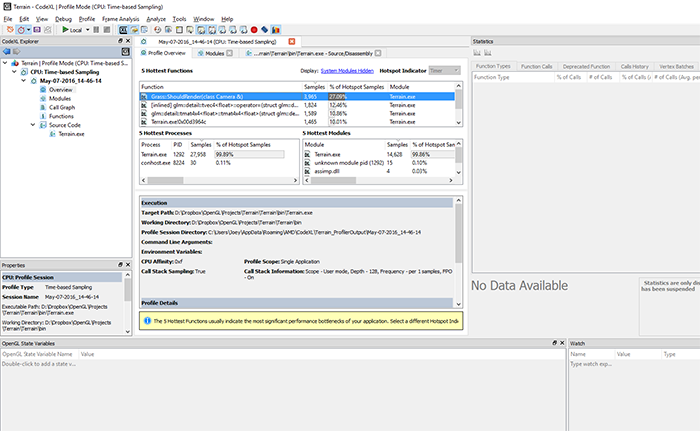
I didn’t use CodeXL much, because RenderDoc seemed easier to me, but I included CodeXL on this list because it looks like a pretty reliable tool and is mainly developed by one of the largest manufacturers of GPUs.
NVIDIA Nsight
Nsight is a popular NUIDIA GPU debugging tool. It is not only a plug-in for Visual Studio and Eclipse, but also a separate application . The Nsight plugin is a very useful thing for graphic developers as it collects a lot of real-time statistics regarding GPU usage and frame-by-frame state of the GPU.
The moment you launch your application through Visual Studio or Eclipse using the debug commands or Nsight profiling, it will start inside the application itself. A good thing in Nsight: rendering a GUI system (GUI, graphical user interface) on top of a running application, which can be used to collect all kinds of information about your application in real time or frame-by-frame analysis.
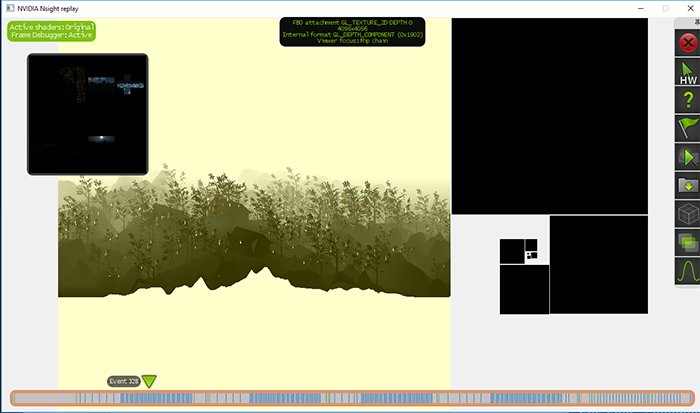
Nsight is a very useful tool, which, in my opinion, is superior to the above tools, but has one serious drawback: it works only on NVIDIA graphics cards. If you are using NVIDIA-based graphics cards and using Visual Studio, Nsight is definitely worth a try.
, ( , VOGL APItrace ), , . , , () ( , ).
Additional materials
- ? — Reto Koradi.
- — Vallentin Source.
PS : We have a telegram conf for coordination of transfers. If you have a serious desire to help with the translation, then you are welcome!
All Articles