Acquaintance with the PVS-Studio static analyzer when developing C ++ programs in Linux
 PVS-Studio supports analysis of projects in C, C ++, C # and Java. You can use the analyzer under Windows, Linux, and macOS systems. This post will focus on analyzing code written in C and C ++ in a Linux environment.
Installation
There are several ways to install PVS-Studio under Linux, depending on the type of distribution. The most convenient and preferred way is to use the repository: this allows you to automatically update the analyzer when new versions are released. The second option is to use the installation package, which can be downloaded here .
The commands that you must complete to install depend on the Linux distribution you are using. For example, for Debian based systems, installing from the repository looks like this:
wget -q -O - https://files.viva64.com/etc/pubkey.txt | sudo apt-key add - sudo wget -O /etc/apt/sources.list.d/viva64.list \ https://files.viva64.com/etc/viva64.list sudo apt update sudo apt install pvs-studio
To install PVS-Studio from the installation package, you can use the gdebi utility:
sudo gdebi pvs-studio-VERSION.deb
The installation process is described in more detail in the " Installing and Updating PVS-Studio on Linux " section of the documentation. You can also find information on non-Debian based systems there.
After installation, you need to enter the license data. To do this, use the command
pvs-studio-analyzer credentials NAME KEY [-o LIC-FILE]
Where NAME and KEY are the name for which the license is registered and the license key. The optional –o parameter allows you to specify the path by which the license file will be generated. By default, it is stored in the ~ / .config / PVS-Studio / directory.
You can get the trial key on the page " Download and try PVS-Studio ".
Project Verification
After installing the analyzer, you can start checking projects. There are two main ways to do this:
- Compilation monitoring;
- Starting during the assembly process directly from the assembly system.
Let's consider the first method first. To start monitoring under Linux, you will need the strace utility. The analyzer uses it to collect information about which processes were launched during the assembly of the project.
The launch is performed by the following command:
pvs-studio-analyzer trace -- make
This example uses build with make, but any other command you use to start the build can be in place of the make call. Command line parameters can be passed to it in the usual way.
After assembly, strace will create a file that the analyzer will use to verify the source code. You can run the analysis with the command
pvs-studio-analyzer analyze -o /path/to/project.log
The output will be an encoded file with the results, which you can convert to one of the supported formats. We will consider working with reports in the next section.
In addition to using strace, analysis can also be run based on the compile_commands.json file (JSON Compilation Database). Many build systems allow you to export compiler invocation commands, or you can use the BEAR utility for this. In this case, you can run the analysis with the command
pvs-studio-analyzer analyze –f /path/to/compile_commands.json
It should be noted that the analyzer recognizes the compiler used by the name of its executable file. If during the check you get the error “No compilation units found”, try specifying the name of your compiler through the –compiler or –c parameter:
pvs-studio-analyzer analyze -c MyCompiler
This may be needed when cross-compiling and using compilers with non-standard executable file names.
In addition to launches in monitoring mode, you can integrate the analyzer into your assembly system or IDE. You can find examples of projects with already configured integration on GitHub in the PVS_Studio repository:
- pvs-studio-cmake-examples
- pvs-studio-qmake-examples
- pvs-studio-makefile-examples
- pvs-studio-waf-examples
- pvs-studio-eclipse-examples
For more detailed instructions on running analysis under Linux, see the documentation .
Work with reports
After checking the project, the analyzer creates a coded report. In order to convert it to one of the supported formats, use the plog-converter utility, which is installed together with PVS-Studio.
The utility supports the following formats:
- xml - a convenient format for additional processing of analysis results, supported by the plugin for SonarQube;
- csv is a text format for presenting tabular data;
- errorfile - output format of gcc and clang;
- tasklist - error format that can be opened in QtCreator;
- html - html report with a brief description of the analysis results;
- fullhtml - html report with sorting analysis results by various parameters and navigation through the source code.
The fullhtml format is most convenient for viewing the report, as it allows you to go to the source code line in which the warning occurred. The following command allows you to convert the analyzer report to this format:
plog-converter -a GA:1,2 -t fullhtml /path/project.log -o /path/report_dir
After the command is executed, the directory / path / report_dir will be created, in which the report files will lie.
Note the -a switch. It allows you to specify which warnings should be included in the report. This is convenient if you need to filter the output of the analyzer. The above team will create a report that will contain only warnings from the general analysis group of the first and second confidence levels ( High and Medium ).
Report Example:
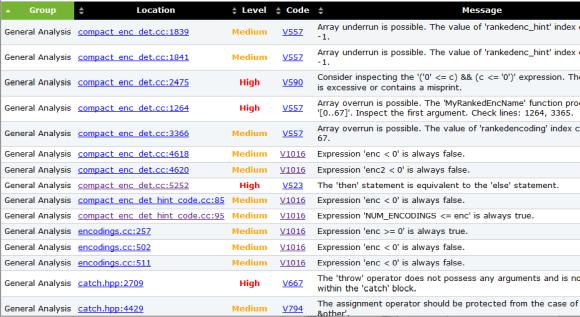
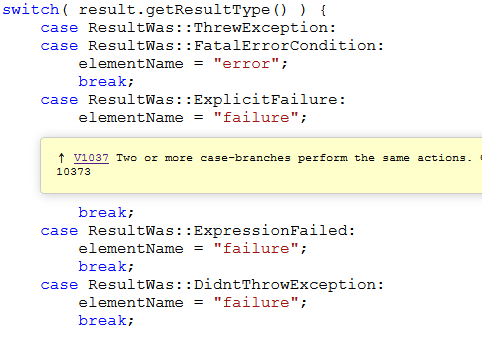
By clicking in the Location cell of the message, you can go to the corresponding line of code:
Clicking on the diagnostic number in the Code column will open the documentation describing this diagnostic.
Analyzer response suppression
When checking the code with a static analyzer, false positives or simply unwanted messages (noise) are possible. PVS-Studio provides mechanisms to suppress such warnings. To individually suppress alarms, you can use one of the methods described in the documentation section " Suppressing false alerts ".
Also, when analyzing old code, it may be necessary to massively suppress all messages. As a rule, this is necessary in order to check only the code that is added to the existing code base. For this, the suppress parameter of the pvs-studio-analyzer utility is used .
You can suppress messages in a report in bulk using the following command:
pvs-studio-analyzer suppress /path/to/report.log
Information about suppressed messages is stored in the suppress_base.json file, which lies next to the project. Such messages are excluded from the report during subsequent inspections.
This mechanism is described in more detail in the documentation here .
Conclusion
This was a brief introduction to using the PVS-Studio analyzer for Linux. I hope it was useful and answered the most frequently asked questions. You can read more about the topic of the article in the documentation here .

If you want to share this article with an English-speaking audience, then please use the link to the translation: Yuri Minaev. Getting Started with the PVS-Studio Static Analyzer for C ++ Development under Linux .
All Articles