How to prepare data for SAP Process Mining by Celonis
Using data from an IT service management system (ITSM) as an example.
In a previous article on SAP Process Mining or how to understand our business processes, we talked about Process Mining and its application in a corporate environment. Today we want to talk more about the data model and the process of its preparation. We will look at the components, how they are interconnected, what data format to request from data owners, and what the approach to generating an event table for SAP Process Mining by Celonis might be.
The data structure in the SAP Process Mining by Celonis tool is quite simple:

Figure 1. Data model in Proces Mining: an event table and a reference to process instances
An event table is a standard table (physical storage, as opposed to logical tables) in the in-memory platform of SAP HANA. Directories can be presented as standard tables (physical storage), and calculation tables (Calculation Views). With rare exceptions, it may be necessary to add some small reference in the form of CSV or XLSX to the existing data model. This feature exists directly in the graphical interface.
Below we will take a closer look at each of these two components of the data model.
An “event table” (aka “event log”) contains at least three required columns:
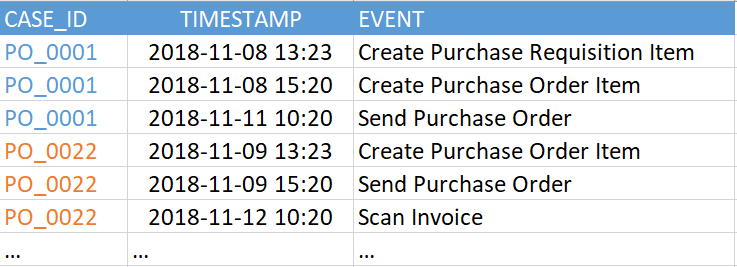
Figure 2. Example event table
The current version of SAP Process Mining by Celonis supports up to 1000 unique events in a single data model. That is, the number of unique values in the “EVENT” column in the example above (in your event table it may be called differently) should be no more than 1000. And the events themselves (that is, the rows in this table) can be quite a lot. We have seen examples of hundreds of millions of events in one data model.
The time stamp can be represented either by a single column, and then it is your task to determine what it means - the beginning or end of a step, or two columns, as in Figure 3, when the beginning and end of a step are explicitly indicated. The fundamental difference between the two-column version is that the system will be able to automatically recognize steps executed in parallel with each other. This is evident when comparing the start and end times of the various steps.

Figure 3. Example event table with two timestamps
All other columns in this table are optional. The process graph can be successfully restored using the three required columns, but it will be difficult to get rid of the feeling that something is missing. Therefore, it is highly recommended that you do not limit yourself to just the minimum set of speakers.
Additional columns - this is any information that interests you, which changes during the process or is associated with a specific event. For example, the name of the employee who made the event, the working group, the current priority of the application. The emphasis on time dependence is not accidental. It is recommended that you leave only mutable data in the event table. All other static information is best placed in separate directories. In other words, the event log should be normalized, if possible. This is done not so much to reduce the amount of data, but to facilitate further work with PQL expressions at the stage of building analytical reports.
Let everything be in place
What happens if you add a column with reference information to the “events table”? In general, nothing terrible will happen, at least at first. And for quick testing of any idea, this option is quite suitable. There can be only two negative consequences: unnecessary reproduction of copies of data and additional difficulties in some analytical formulas. These difficulties could have been avoided if all the additional data had been submitted to the directory. In general, it’s best to do it right away.
A bit about licensing
The event table is associated with the licensing of SAP Process Mining by Celonis. One data model = 1 license = 1 event log. With a certain reservation, we can say that 1 event log = 1 business process. The caveat will be as follows: situations may arise when several processes fit into one event log, and vice versa - several event logs are intentionally created for one process. In addition, the term “business process” can be interpreted from a data point of view quite broadly. Therefore, for licensing purposes, for the obvious criterion, the number of event logs was selected. It is on this criterion that one should rely.
Directories
Directories are optional, adding them to the data model is optional. They contain any additional information that may be useful for the analysis of the process. But, unlike the table of events, the information in the directories is static, it does not depend on the time the event occurred.
One particular case should be mentioned here. When it comes to the data of a user performing steps in a business process, the question arises: is this information reference? On the one hand, yes - this is static data. It would be nice to leave in the event table only a certain “USER_ID”, according to which the name, position and department of the user, membership in the working group, etc. will be associated with the activity. But on the other hand, let's imagine that we analyze a business process on a 2-3-year time span. During this time, the user could change several posts and switched between departments or working groups. It turns out that this is information that is already changing over time. And in this case, it should be left in the event table, which in turn will lead to the fact that in addition to "USER_ID" in the event log there will appear such columns as "work group", "position", "department" and even "full name" (last name it could also change during this time). In general, the question of whether to normalize user information or not remains at the discretion of the customer.
Directories can be added to an existing data model at any time.
To do this is quite simple:
After completing these steps, you can immediately use new analytics, both in new reports and in existing ones. The enrichment of the data model does not harm the current work of analysts in any way: all created reports continue to work, you do not need to redo them or somehow change them.
For relatively small directories, there is one more possibility: not a completely industrial version, of course, but it can also be useful. It's about loading CSV, XLSX, DBF files through a graphical interface directly into the data model. The procedure remains exactly the same as described above, but instead of the database tables, a file prepared in advance is used, which is loaded with the Import Data button.
CA Table: Process Instance Reference
The previous conversation about reference books began with the fact that they are optional. They can be omitted altogether from the data model and limited only to the table of events. This is almost true.
One mandatory reference does exist. This should be a table marked with the status “CA Table”. CAs are chains of events. And, you guessed it, the key in this directory will be “CASE_ID” - the unique identifier of the process instance. Such a reference describes the static properties of individual process instances. An example from ITSM: the author of the appeal, a business service, the closing date, or the employee who successfully resolved the incident, a sign of mass character, etc.
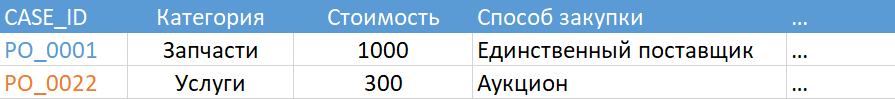
Figure 7. Example CA Table
And yet I did not deceive you much. If for some reason you decide not to add the required directory to the data model, the system will generate it itself. The result of its work can be seen in the Status tab: if your event table is called, say, “ITSM_EVENTS”, then the table “ITSM_EVENTS_CASES” will be generated in conjunction with it, as in Figure 8.
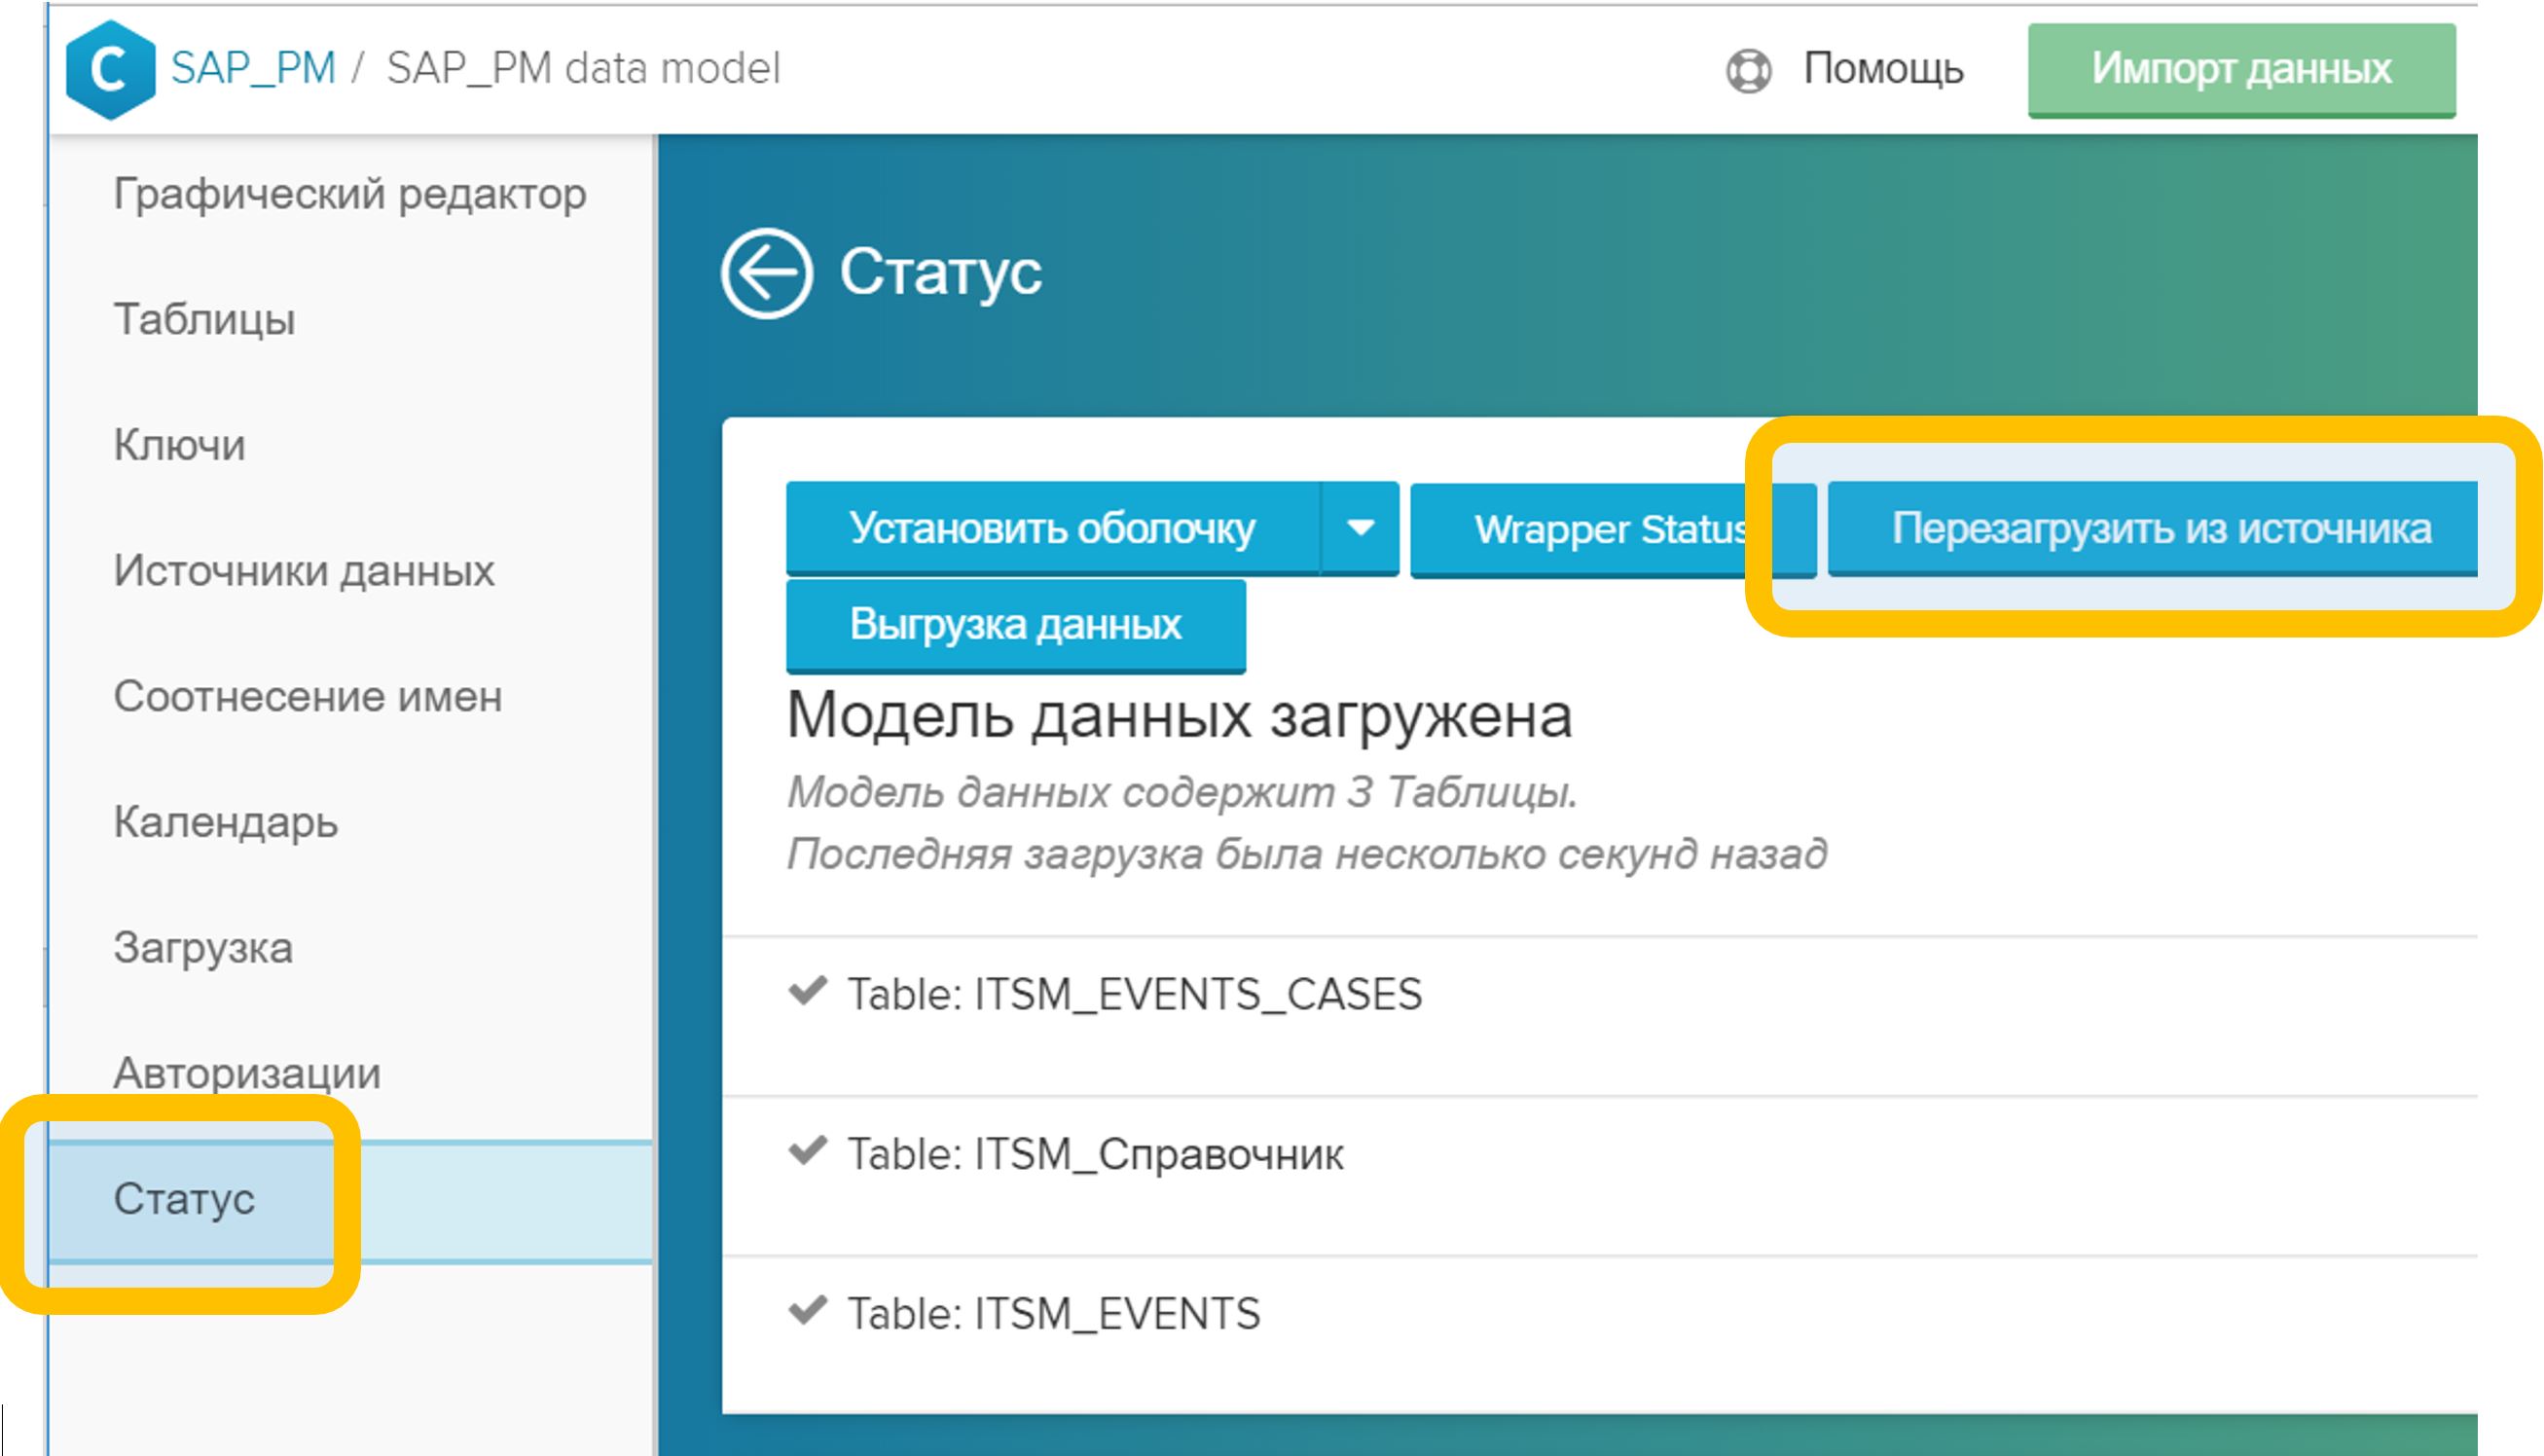
Figure 8. Automatically generated event chain (CA) table
An automatically generated CA table will be a very simple description of process instances: key, number of events, process duration (as if you grouped an event table by a process ID, calculated the number of rows and the difference between the time of the first and last steps). Therefore, it makes sense to create your own, more interesting version of the CA table. It can be added to the data model at any time. In this case, as soon as you add your CA Table to the model, the directory generated by the system (in our case it is “ITSM_EVENTS_CASES”) will automatically be deleted from the data model.
Why is the “CA Table” interesting? It is she who is displayed in the graphical interface as a process detail. If the analyst, while working with the data model, found something interesting in the process and wanted to go down to individual specific examples, then he will use the “View CA” report, that is, detailing. By opening such a report, you will find out in it the process reference (combined with the event table, of course). Therefore, add to the “CA Table” everything that the analyst can use to understand the properties of the process and the conditions of its course.
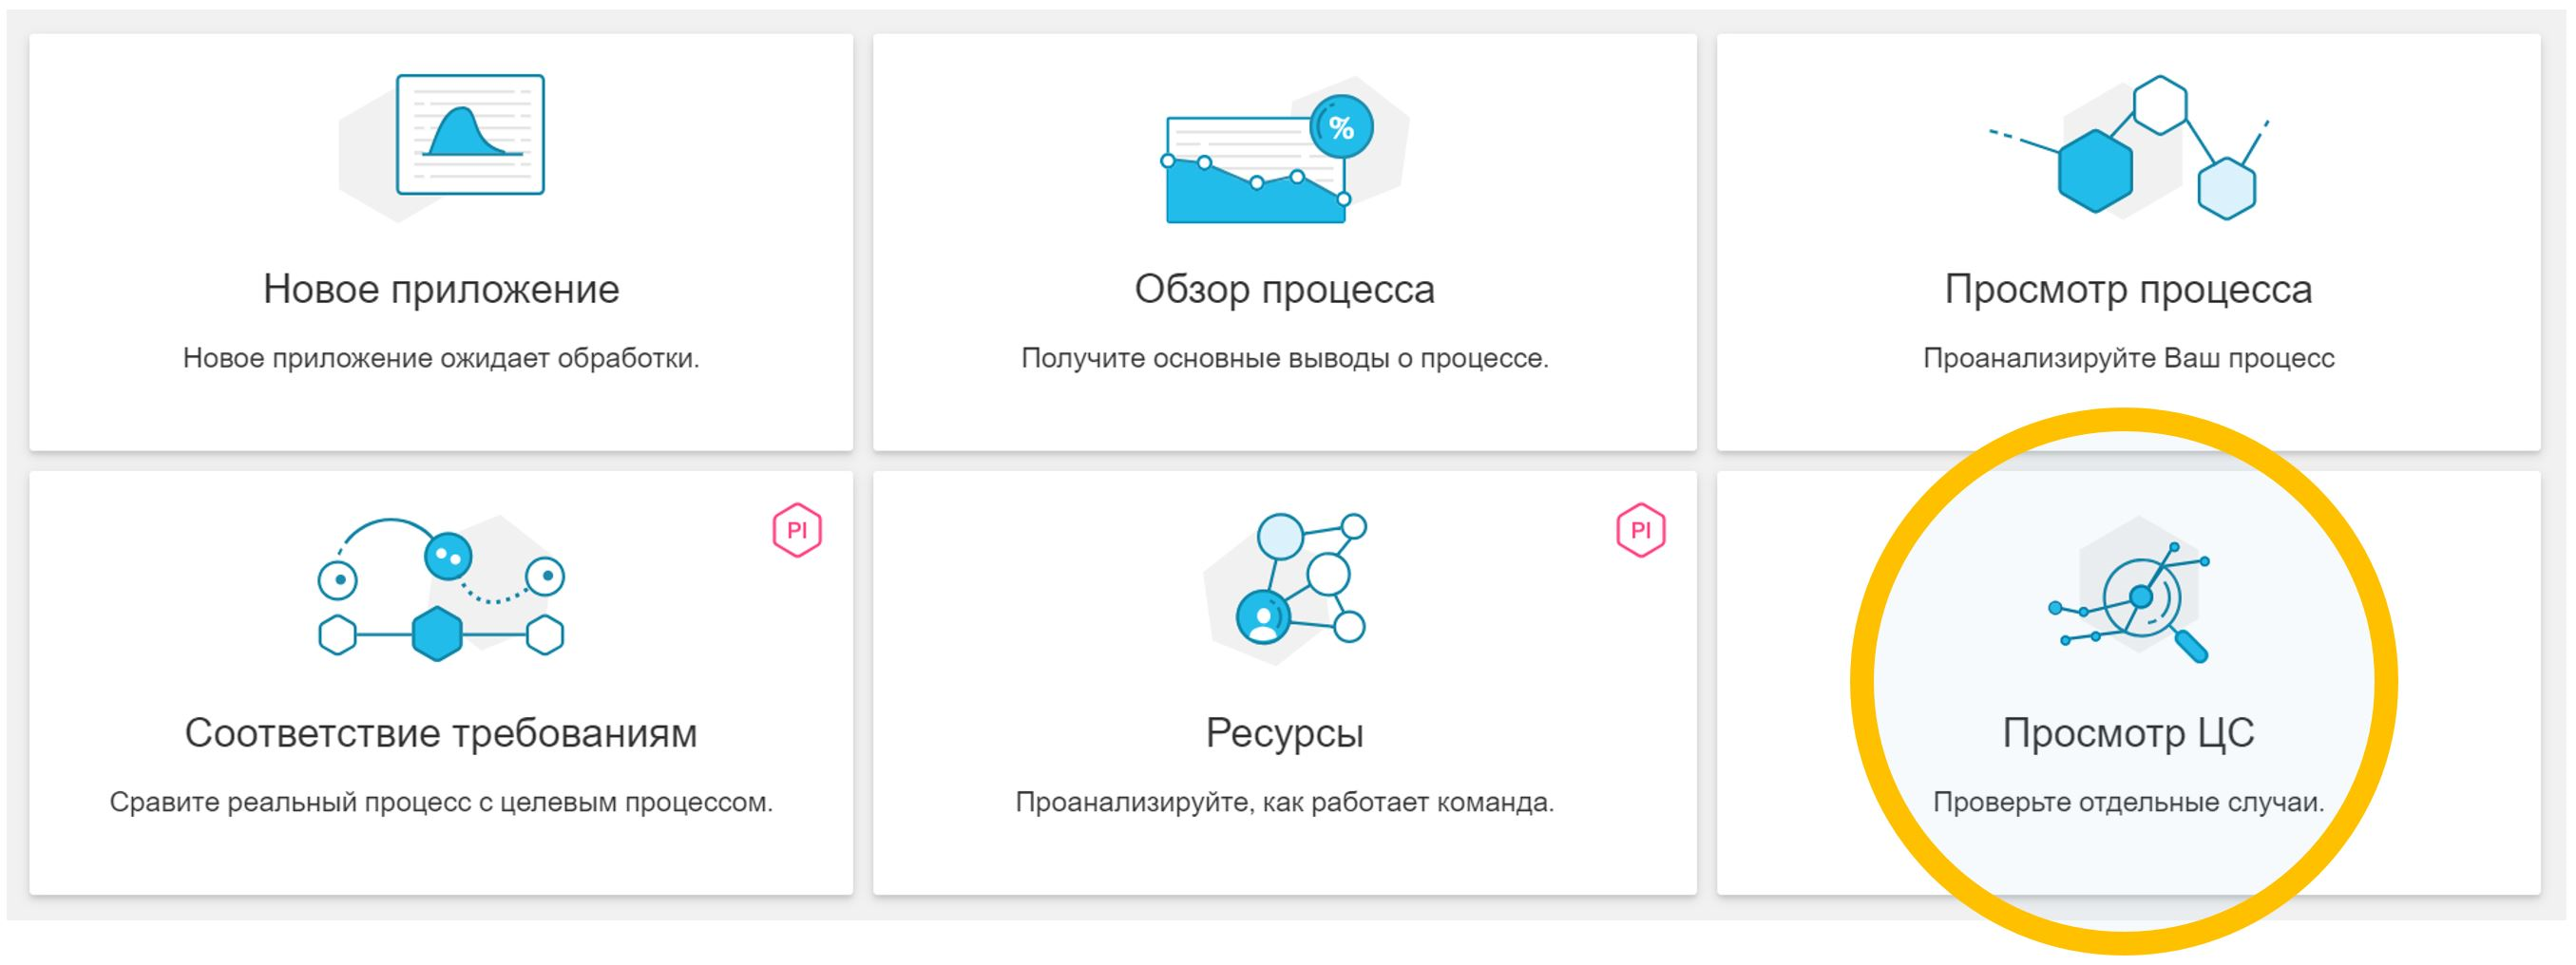
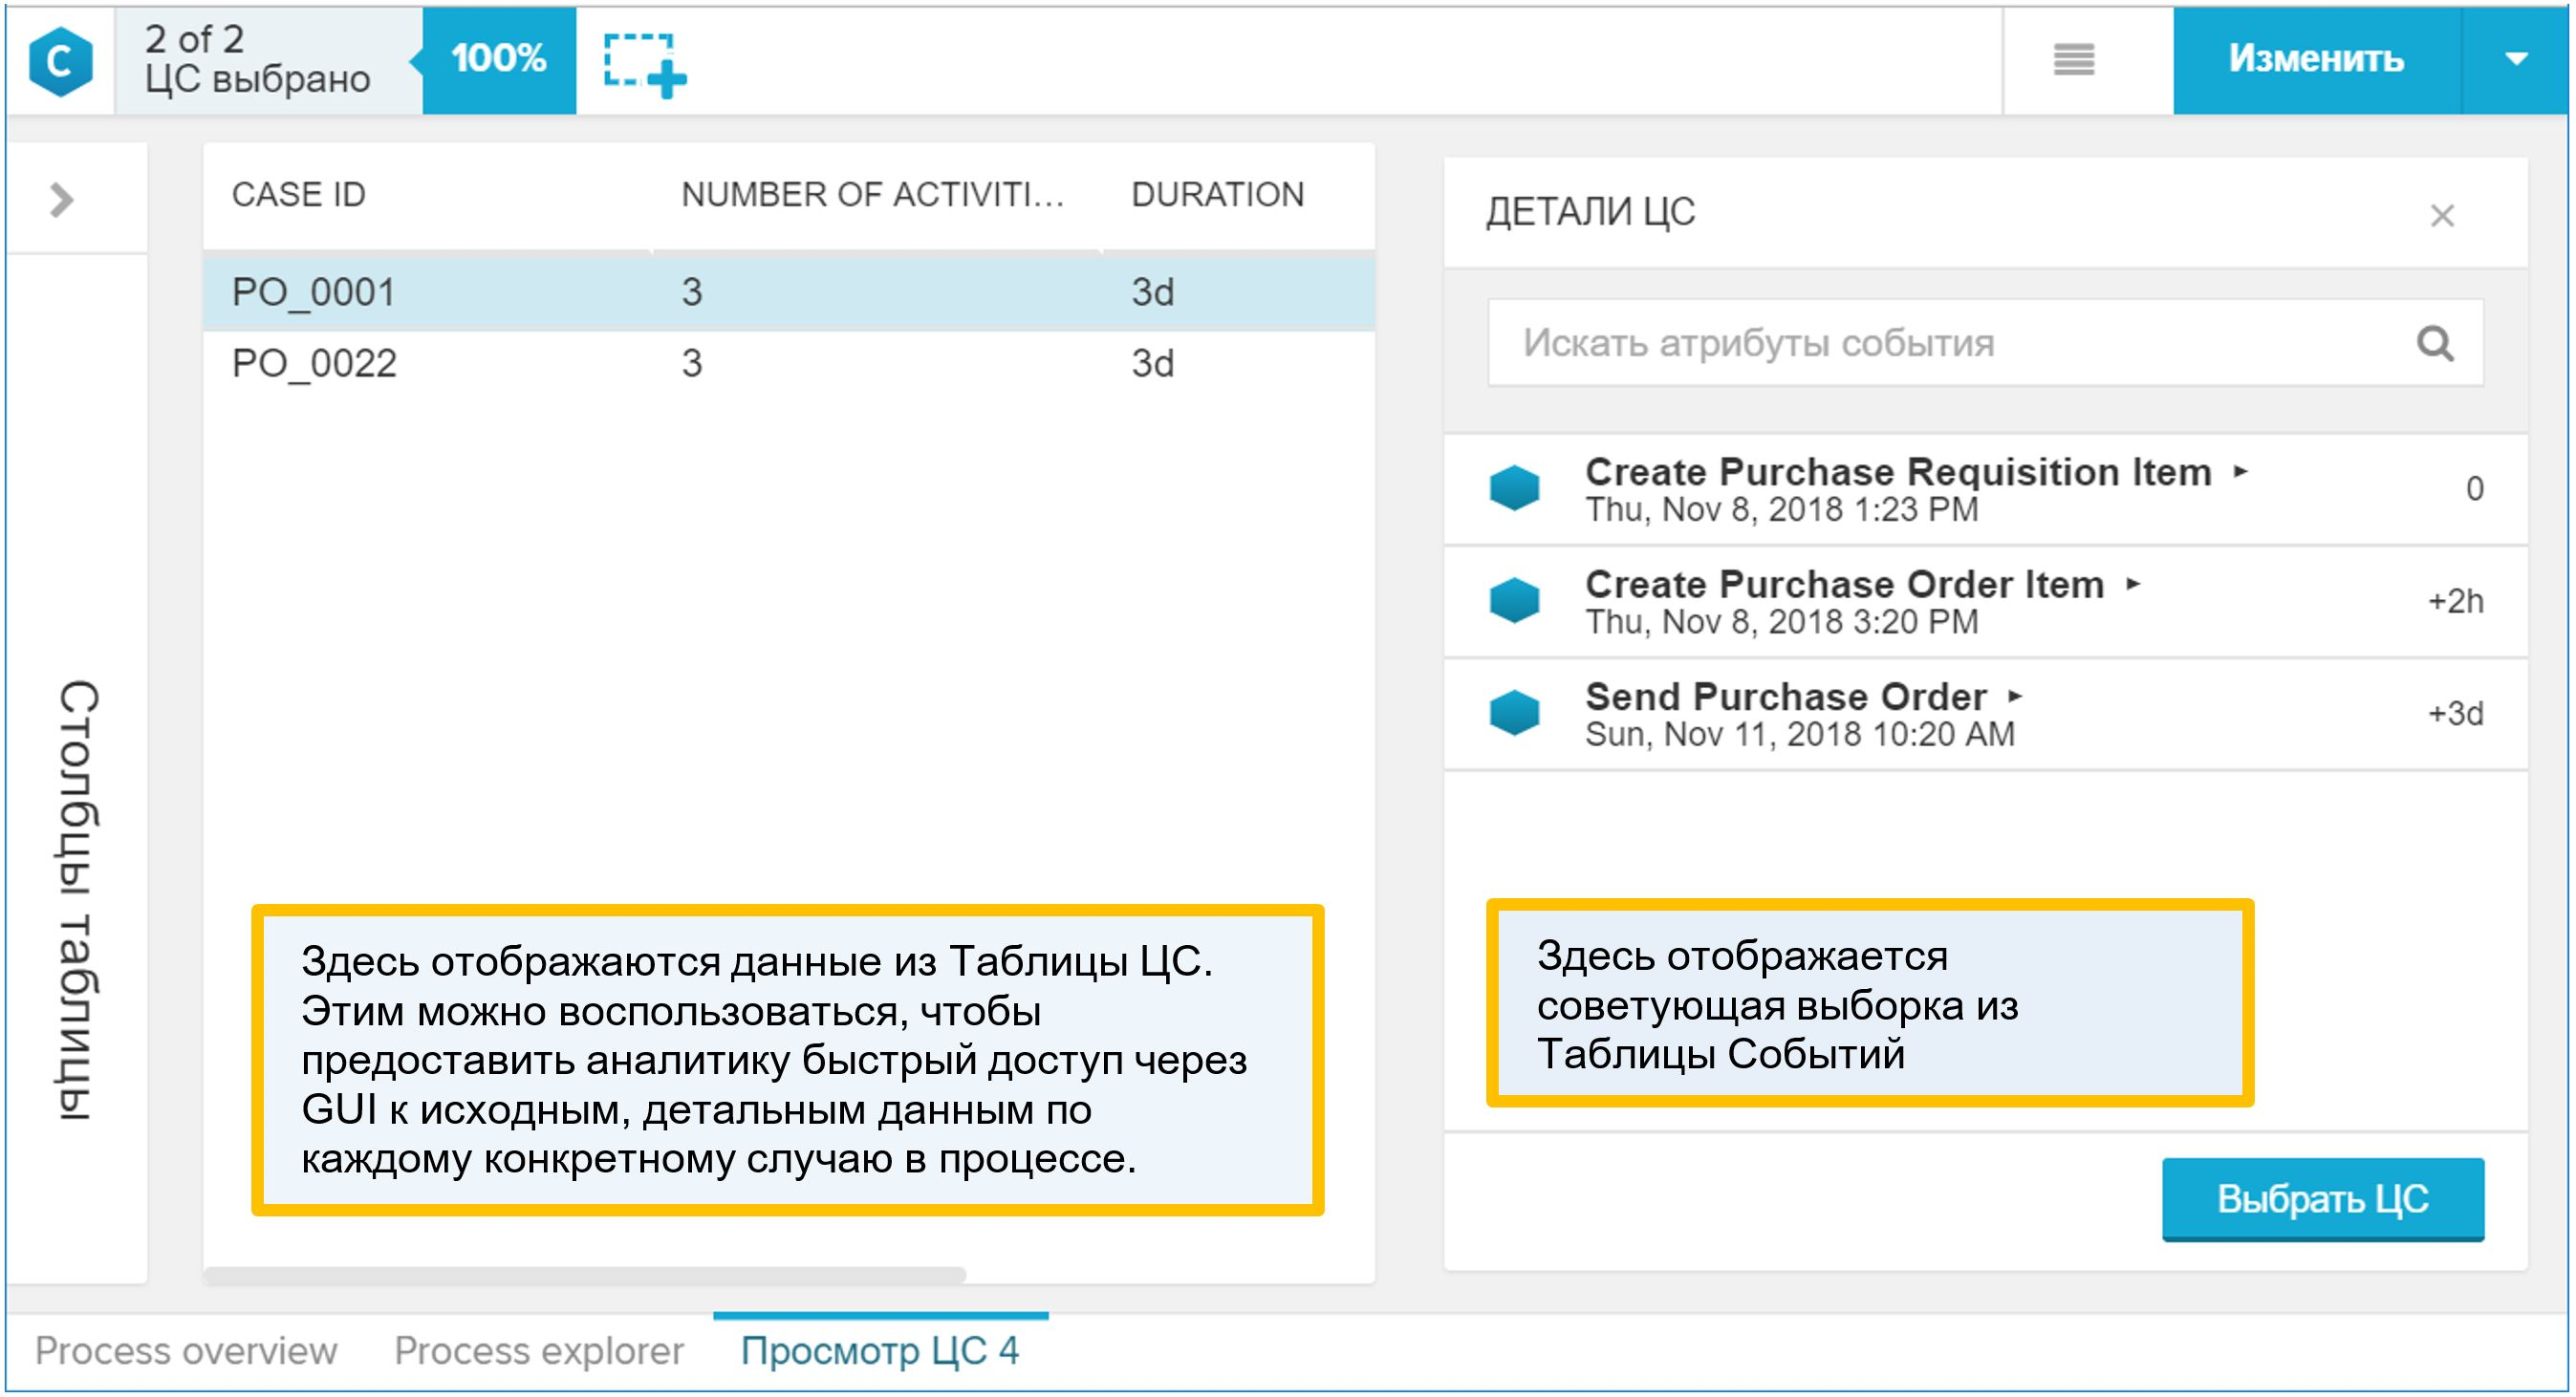
Figure 9. Synthetic example report “View CA”
How to add your process reference to the data model:
Important note: the “CASE_ID” column (in each case, it may be called in some other way) in the CA table, which contains the process identifier and is used to associate with the event table, should contain only unique values. This is quite logical. And if for some reason this is not so, then when loading the data model in step (5), the corresponding error will be generated (about the impossibility of performing the “JOIN” operation on the event table and the CA table).
In practice, we come across very different data sources for Process Mining. Their composition is determined by the selected business process and the standards adopted by the customer.
One of the most common cases is data from the IT service management system (ITSM, IT Service Management), so we decided to parse this example first. In fact, there is no tight binding specifically to ITSM in this approach. It can be applied in other business processes, where the data source is a change history or audit log.
What to ask from IT?
If you are not an IT employee or the specialist who serves the ITSM basis, then be prepared for the fact that you will be asked to formulate an exact answer to the question “what do you unload?” Or “what do you want from us?”.
And this is not always known - what exactly is needed. Analysis of a business process is a study, a search for patterns and the hunt for "insights." If we knew in advance what kind of “insight” we are looking for, then this would not be “insight” anymore. In fact, I would like to get "everything": attributes, relationships, changes. But, as practice shows, it has never been possible to get a good accurate answer to a too general question.
There are two possible answers to the question “what do you unload”.
The option is wrong: ask the basis to unload all changes in the application statuses plus a set of obvious attributes (say, priority, artist, workgroup, etc.). Firstly, you get a limited set of analysts: you already know what you will measure in the process (this is where the set of attributes came from), so Process Mining will turn into a tool for calculating the process KPI (very convenient, I must say, a tool; but still I want to more).
Secondly, each individual IT department differently interprets the request to add additional request attributes to the upload. For example, take priority: it can change while working on a call. The appeal is registered with one priority, then the specialist of the working group changes it, and it closes with a different status. And now the question is: in the unloading requested by you, what moment does the priority correspond to? Initially, it seems that the priority value should correspond to the column “Date and time of the event”. But in reality it often turns out that the indicated date and time correspond only to the application status itself, and all other columns are the values at the time of unloading or at the time of closing the application. And you will not know about this at once.
It seems to me that there is a better option. You can request data in the form of the following table:
In fact, this is nothing more than a history of changes in any attributes. In the interfaces of ITSM-systems you can see such a table on the tabs with the name “History” or “Journal”.
The advantages of this approach are obvious:
The disadvantages of the second option are also clear. And they, it seems to me, can be solved (as opposed to the problem of incomplete data):
I would not like to say that this is the only correct way to get data from the ITSM system for Process Mining tasks. But at the current time, I am inclined to believe that this is the most convenient format for this task. There are probably plenty more interesting approaches, and I will be very happy to discuss alternative ideas if you share them with me.
So, at the exit, we have a history of changes in the attributes of requests, incidents, calls, tasks and other ITSM objects. From such a table, it is possible to generate both key components of the Process Mining data model: an event table and a CA table.
To generate events based on the change history, do the following:
Suppose the change table is as follows:
First, look at the list of all the attributes present. This can be done in the “Open Data Preview” menu or with a simple SQL query like this:
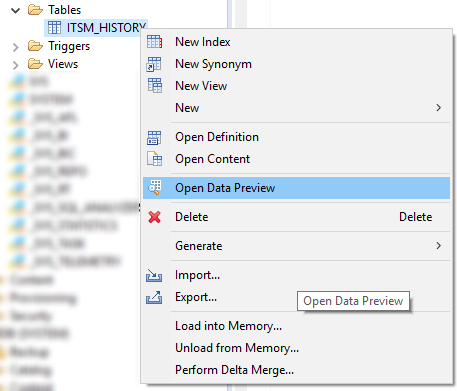
Figure 11. Context menu with the Open Data Preview command in SAP HANA Studio
Then we determine the composition of the attributes, the change of which is for us an event in the process. Here is a list of obvious candidates for such a list:
The main events here, of course, are the transitions between the statuses of the appeal / incident \ application \ task. The value of the “Status” attribute (VALUE_NEW) itself will be the name of the process step for us. Accordingly, creating an event table as a first approximation might look like this:
Changing the rest of the attributes is our additional steps that make researching the process even more interesting. Their composition is determined by the request of a business analyst and can change as the practice of Process Mining in the company develops.
Expanding the list of attributes in the WHERE "ATTRIBUTE" IN filter (.....) You increase the variety of steps that is displayed on the process graph. It is worth noting that a wide variety of steps is not always a blessing. Sometimes too detailed detailing only makes it difficult to understand the process. I think that after the first iteration you will determine which steps are needed and which should be excluded from the data model (and the freedom to make such decisions and quickly adapt to them is another argument in favor of transferring the work of transforming data to the side of the Process Mining team) .
The filter "VALUE_OLD" IS NOT NULL, most likely you will replace it with something more suitable for your conditions and for the selected attributes. I will try to explain the meaning of this filter. In some popular implementations of ITSM systems, at the time of registration (opening) of an appeal, information about the initialization of all attributes of the object is entered into the journal. That is, all the fields are marked with some default values. At this moment, VALUE_NEW will contain the same initializing value, and VALUE_OLD will not contain anything - after all, there was no history until this moment. We absolutely do not need these records in the process. They should be removed with a filter appropriate to your specific conditions. Such a filter may be:
The same history of changes that served us as a source of events is also useful for creating a directory of process instances (CA Tables). Algorithm similar:
1. Define a list of attributes that:
a. Do not change during the work on the application, for example, the author of the appeal and his department, the user's rating based on the results of work, the flag of violation of the deadline.
b. They can change, but we are only interested in the values at certain points: at the time of registration, closing, when hiring, transferring from the 2nd line to the 1st, etc.
c. They can change, but we are only interested in aggregated values (maximum, minimum, quantity, etc.)
2. Create a diagonal table with the desired set of columns. Each attribute of interest to us will generate its own set of rows (according to the number of process instances), in which only one column will have a value, and all the rest will be empty (NULL).
3. We collapse the diagonal table into the final directory using grouping by process identifier.
Examples of attributes that it makes sense to put in the CA table (in practice, this list can be much longer):
One and the same attribute can be either a source of an event in a process or a property of a process instance. For example, the attribute "Priority". On the one hand, we are interested in its value at the time of registration of the appeal, and on the other, all the facts of changes in this attribute can be submitted to the process graph as independent steps.
Another example is Deadline. This is an obvious reference property of the process, but you can make a virtual step in the process graph from it: such an operation as the “Deadline” does not exist in the process, but if we add the corresponding record to the Event Table, we will create it artificially and we can visualize the location relative to execution time of other steps right on the process graph. This is convenient for quick analysis.
In general, when we create process properties based on the history of attribute changes, the source of useful information for us can be:
This list, of course, can be continued with other ideas for using attributes and all that is connected with them.
Now that we have already decided on the list of properties of interest, let's look at one of the possible scenarios for generating the CA table. First, create the table itself with the set of columns that we defined above for ourselves:
We will also need a temporary table “ITSM_CASES_STAGING”, which will allow us to sort out a flat list of attributes for the required property columns in the directory of process instances:
This will be a diagonal table - in each row only two fields have a value: "CASE_ID", i.e. process identifier, and one single field with a process property. The remaining fields in the row will be empty (NULL). At the final stage, we easily collapse the diagonals into rows by simple aggregation and thus obtain the table of CAs we need.
An example for a treatment category:
Suppose that the author is the first non-system user in the history of the appeal that registers appeals (in your particular case, the criterion may be more accurate):
If we consider that the processor, which put down the last status “Solution proposed” (and the solution could be offered repeatedly, but only the last one is fixed), successfully solved the problem, then this property of the process instance can be formulated as follows:
User rating (his satisfaction with the decision):
The time of registration (creation) is simply the earliest record in the history of circulation:
Reaction time is an important characteristic of the quality of services. To calculate it, you need to know when the flag “Was taken to work” was first raised:
The deadline is used to calculate KPIs for timely responses to appeals or resolving incidents. In the process, the deadline may repeatedly change. To calculate KPIs, we need to know the latest version of this attribute. If we want to explicitly track how the deadline has changed, that is, to display such cases on the process graph, we should also use this attribute to generate an entry in the event table. This is an example of an attribute that simultaneously serves as both a process property and an event source.
All the above examples are the same. By analogy with them, the CA table can be expanded with any attributes that interest you. Moreover, this can be done already after the start of the project, the system allows you to expand the data model during its operation.
When our temporary diagonal table is filled with the properties of the process instances, it remains only to do the aggregation and get the final table of the CA:
After that, we no longer need the data in the temporary table. The table itself can be left to continue repeating the above process on a regular basis to update the data model in Process Mining:
You will probably start your introduction to the Process Mining discipline with a pilot project. In this case, direct access to the data source cannot be obtained, both IT employees and information security officers will resist this. This means that as part of the pilot project, we will have to work with exporting data from corporate systems to CSV files and then importing them into SAP HANA to build a data model.
In an industrial installation, there will be no exports to CSV. Instead, SAP HANA integration tools will be used, in particular: Smart Data Integration (SDI), Smart Data Access (SDA) or SAP Landscape Transformation Replication Server (SLT). But for testing and familiarization with the technology, exporting to text CSV files is an organizationally simpler method. Therefore, it will be useful to share with you some tips for preparing data in CSV for quick and successful import into the database.
Recommended format requirements for the file itself when exporting:
If we take into account points (4) + (5) + (6), then it makes sense to use the following construction in the selection:
Further, when the CSV files are ready, they will need to be copied to the HANA server in a folder that is declared safe for importing files (for example, / usr / sap / HDB / import). Importing data into HANA from a local CSV file is a fairly quick procedure provided that the file is “clean”:
To check the CSV files before importing them and find the problem areas if they exist (and with a probability of 99% they will), you can use the following commands:
1. Check the BOM character at the beginning of the file:
file data.csv
If the result of the command is like this: “UTF-8 Unicode (with BOM) text”, this means that the encoding is UTF8-BOM and you need to remove the BOM character from the file. You can remove it as follows:
sed -i '1s / ^ \ xEF \ xBB \ xBF //' data.csv
2. The number of columns should be the same for each line of the file:
cat data.csv | awk -F »;" '{print NF}' | sort | uniq
or like this:
for i in $ (ls * .csv); do echo $ i; cat $ i | awk -F ';' '{print NF}' | sort | uniq -c; echo; done;
Change ';' in parameter F to what is the field separator in your case.
As a result of the execution of these commands, you will get the distribution of rows by the number of columns in each row. Ideally, you should get something like this:
EKKO.csv
79536 200
Here the file contains 79536 lines, and all of them contain 200 columns. There are no rows with a different number of columns. It should be so.
And here is an example of an incorrect result:
LFA1.csv
73636 180
7 181
Here we see that most rows contain 180 columns (and, probably, this is the number of columns that is correct), but there are rows with the 181st column. That is, one of the fields contains a separator sign in its value. We were lucky and there are only 7 such lines - they can easily be looked at manually and somehow corrected. You can see the lines in which the number of columns is not equal to 180, like this:
cat data.csv | awk -F ";" '{if (NF! = 180) {print $ 0}}'
A note on using the above commands. These commands will not pay attention to quotation marks. If the separator sign is contained in the field enclosed in quotation marks (and that means everything is fine here from the point of view of import into the database), then checking with this method will show a false problem (extra columns) - this should also be taken into account when analyzing the results.
3. If the quotation marks are unpaired and cannot solve this problem in any way, then you can delete all quotation marks from the file:
sed -i 's / "// g' data.csv
The danger of this approach is that if the field values contain a separator character, then the number of columns in the row will change. Therefore, the separator characters must be removed from the field values at the export stage (delete or replace with some other character).
4. Empty fields
Faced with a situation where the successful import of data was prevented by empty field values in this form:
; ""
Where “;” is the field separator character in this case. That is, the field is two double quotation marks (plain empty string). If you suddenly cannot import the data, and you suspect that the problem may be empty fields, then try replacing “” with NULL
sed -i 's /; ”” /; NULL / g' data.csv
(substitute “;” for your separator option)
5. It can be useful to look for “dirty” number formats in the data:
; "0" (the number contains a space)
; “100.10-” (the sign “-“ after the number)
The Bugatti 3/4 "300 crane - an inch dimension is indicated by a double quotation mark - and this automatically leads to the problem of unpaired quotation marks when exporting.
Unfortunately, this is not an exhaustive list of possible problems with inconvenient data formats for import into the database. It would be great to know your options from practice: what curious mistakes have you come across? How you detected and eliminated them. Share in the comments.
In general, the data model for Process Mining is very simple: an event table plus, optionally, additional references. But as it usually happens, it starts to seem simple only when at least one complete cycle of tasks has been completed - then the whole process is visible in its entirety, and the work plan is clear. I hope this article helps you figure out how to prepare the data for your first Process Mining project. In general, the preparation process looks like this:
And, in fact, this is where the preparation of the data model begins and the most interesting part begins - Process Mining. If you have any questions during the implementation of the Process Mining project, feel free to write in the comments, I will be happy to help. Good luck!
Fedor Pavlov, SAP CIS platform expert
In a previous article on SAP Process Mining or how to understand our business processes, we talked about Process Mining and its application in a corporate environment. Today we want to talk more about the data model and the process of its preparation. We will look at the components, how they are interconnected, what data format to request from data owners, and what the approach to generating an event table for SAP Process Mining by Celonis might be.
Data Model in SAP PROCESS MINING by CELONIS
The data structure in the SAP Process Mining by Celonis tool is quite simple:
- "Event table." This is a required part of the data model. Such a table can be only one in each individual data model. A process graph is automatically generated on it. See figure 1.
- Directories are any other tables that expand the “event table” with additional analytical information. Unlike her in the reference information does not change over time. More precisely, it should not change in the time interval that we analyze. For example, it can be a table with a description of the properties of contracts, procurement items, applications for something, employees, regulations, contractors and other objects that are somehow involved in the process. In this case, the directory will describe all kinds of static properties of these objects (amounts, types, names, names, sizes, departments, addresses and other all kinds of attributes). Directories are optional. You can run the data model without them. Simply analyzing such a process will be less interesting.
Figure 1. Data model in Proces Mining: an event table and a reference to process instances
An event table is a standard table (physical storage, as opposed to logical tables) in the in-memory platform of SAP HANA. Directories can be presented as standard tables (physical storage), and calculation tables (Calculation Views). With rare exceptions, it may be necessary to add some small reference in the form of CSV or XLSX to the existing data model. This feature exists directly in the graphical interface.
Below we will take a closer look at each of these two components of the data model.
An “event table” (aka “event log”) contains at least three required columns:
- A process identifier is a unique key for each process instance (for example, reference, incident, or task number). In the example in Figure 2, this is the “CASE_ID” column.
- Activity. This is the name of the step in the process - some kind of event that we are interested in. It is from the activities that the process graph will be composed (column “EVENT”).
- Timestamp of the event (column "TIMESTAMP").
Figure 2. Example event table
The current version of SAP Process Mining by Celonis supports up to 1000 unique events in a single data model. That is, the number of unique values in the “EVENT” column in the example above (in your event table it may be called differently) should be no more than 1000. And the events themselves (that is, the rows in this table) can be quite a lot. We have seen examples of hundreds of millions of events in one data model.
The time stamp can be represented either by a single column, and then it is your task to determine what it means - the beginning or end of a step, or two columns, as in Figure 3, when the beginning and end of a step are explicitly indicated. The fundamental difference between the two-column version is that the system will be able to automatically recognize steps executed in parallel with each other. This is evident when comparing the start and end times of the various steps.
Figure 3. Example event table with two timestamps
All other columns in this table are optional. The process graph can be successfully restored using the three required columns, but it will be difficult to get rid of the feeling that something is missing. Therefore, it is highly recommended that you do not limit yourself to just the minimum set of speakers.
Additional columns - this is any information that interests you, which changes during the process or is associated with a specific event. For example, the name of the employee who made the event, the working group, the current priority of the application. The emphasis on time dependence is not accidental. It is recommended that you leave only mutable data in the event table. All other static information is best placed in separate directories. In other words, the event log should be normalized, if possible. This is done not so much to reduce the amount of data, but to facilitate further work with PQL expressions at the stage of building analytical reports.
Let everything be in place
What happens if you add a column with reference information to the “events table”? In general, nothing terrible will happen, at least at first. And for quick testing of any idea, this option is quite suitable. There can be only two negative consequences: unnecessary reproduction of copies of data and additional difficulties in some analytical formulas. These difficulties could have been avoided if all the additional data had been submitted to the directory. In general, it’s best to do it right away.
A bit about licensing
The event table is associated with the licensing of SAP Process Mining by Celonis. One data model = 1 license = 1 event log. With a certain reservation, we can say that 1 event log = 1 business process. The caveat will be as follows: situations may arise when several processes fit into one event log, and vice versa - several event logs are intentionally created for one process. In addition, the term “business process” can be interpreted from a data point of view quite broadly. Therefore, for licensing purposes, for the obvious criterion, the number of event logs was selected. It is on this criterion that one should rely.
Directories
Directories are optional, adding them to the data model is optional. They contain any additional information that may be useful for the analysis of the process. But, unlike the table of events, the information in the directories is static, it does not depend on the time the event occurred.
One particular case should be mentioned here. When it comes to the data of a user performing steps in a business process, the question arises: is this information reference? On the one hand, yes - this is static data. It would be nice to leave in the event table only a certain “USER_ID”, according to which the name, position and department of the user, membership in the working group, etc. will be associated with the activity. But on the other hand, let's imagine that we analyze a business process on a 2-3-year time span. During this time, the user could change several posts and switched between departments or working groups. It turns out that this is information that is already changing over time. And in this case, it should be left in the event table, which in turn will lead to the fact that in addition to "USER_ID" in the event log there will appear such columns as "work group", "position", "department" and even "full name" (last name it could also change during this time). In general, the question of whether to normalize user information or not remains at the discretion of the customer.
Directories can be added to an existing data model at any time.
To do this is quite simple:
- A table is created in SAP HANA.
- The table is added to the general data model using the "Import Data" button.
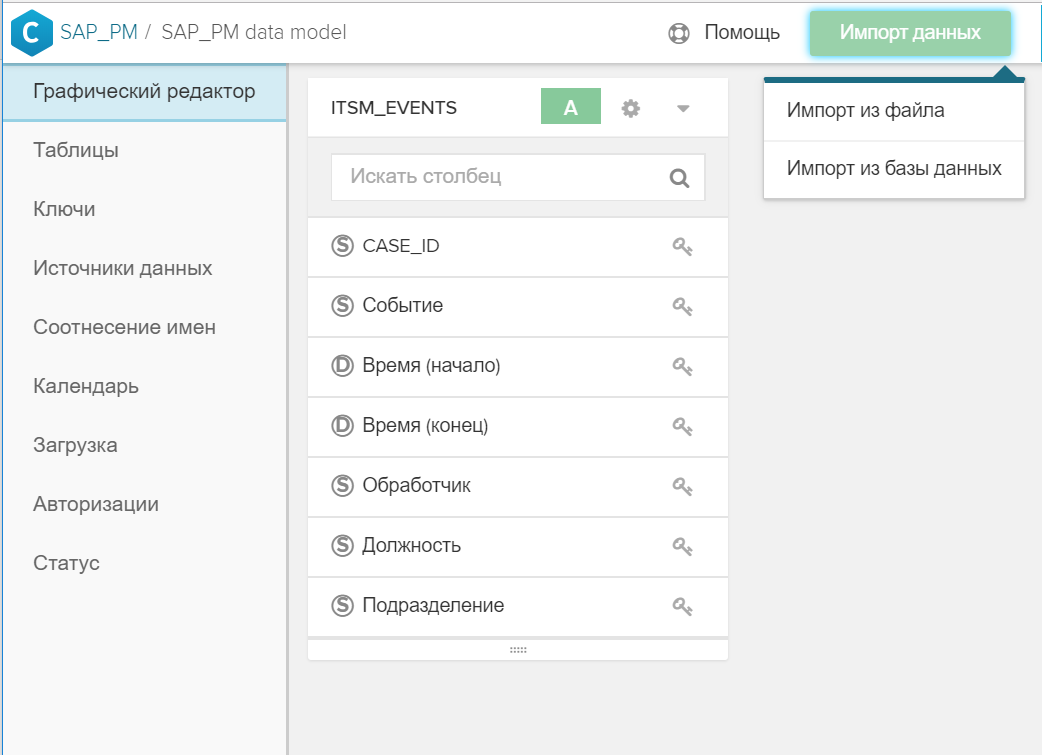
Figure 4. Import a table or file into an existing data model - The key (or keys) is indicated in the graphical interface, by which the new directory is associated with the event table and / or with other directories. To do this, just click on the icon
 in one table and then on the corresponding in another table.
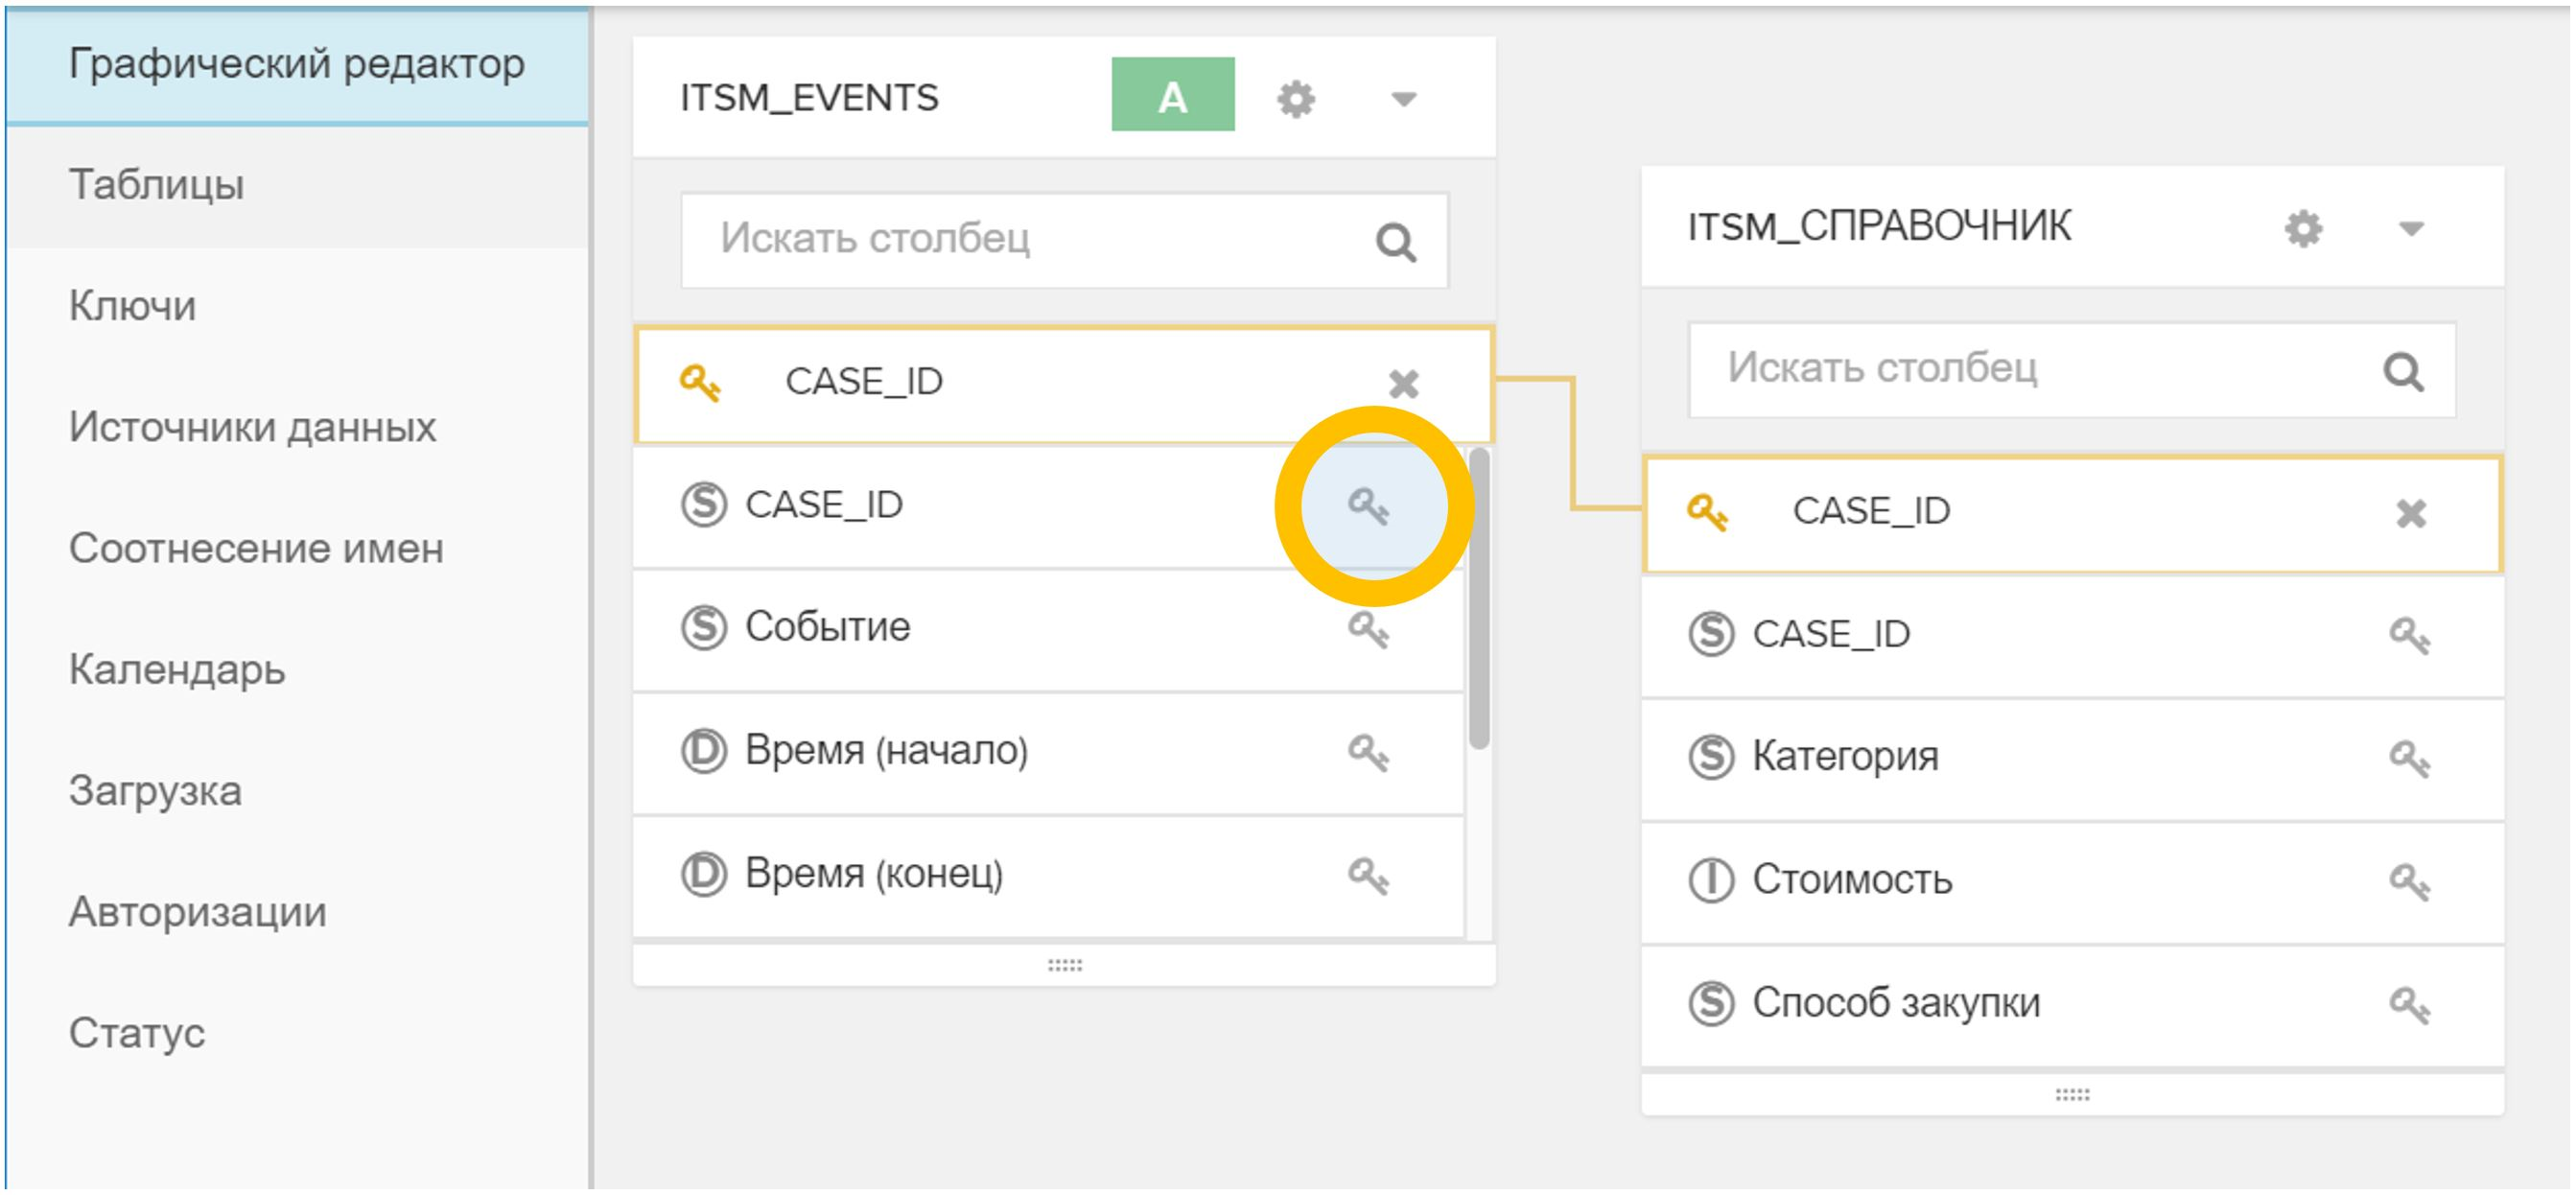
Figure 5. Linking tables in a data model by an arbitrary field (in this case, CASE_ID) - In the "Status" menu, click the "Reload from source" button. This process usually takes a few seconds.
Figure 6. Reload data model from source
After completing these steps, you can immediately use new analytics, both in new reports and in existing ones. The enrichment of the data model does not harm the current work of analysts in any way: all created reports continue to work, you do not need to redo them or somehow change them.
For relatively small directories, there is one more possibility: not a completely industrial version, of course, but it can also be useful. It's about loading CSV, XLSX, DBF files through a graphical interface directly into the data model. The procedure remains exactly the same as described above, but instead of the database tables, a file prepared in advance is used, which is loaded with the Import Data button.
CA Table: Process Instance Reference
The previous conversation about reference books began with the fact that they are optional. They can be omitted altogether from the data model and limited only to the table of events. This is almost true.
One mandatory reference does exist. This should be a table marked with the status “CA Table”. CAs are chains of events. And, you guessed it, the key in this directory will be “CASE_ID” - the unique identifier of the process instance. Such a reference describes the static properties of individual process instances. An example from ITSM: the author of the appeal, a business service, the closing date, or the employee who successfully resolved the incident, a sign of mass character, etc.
Figure 7. Example CA Table
And yet I did not deceive you much. If for some reason you decide not to add the required directory to the data model, the system will generate it itself. The result of its work can be seen in the Status tab: if your event table is called, say, “ITSM_EVENTS”, then the table “ITSM_EVENTS_CASES” will be generated in conjunction with it, as in Figure 8.
Figure 8. Automatically generated event chain (CA) table
An automatically generated CA table will be a very simple description of process instances: key, number of events, process duration (as if you grouped an event table by a process ID, calculated the number of rows and the difference between the time of the first and last steps). Therefore, it makes sense to create your own, more interesting version of the CA table. It can be added to the data model at any time. In this case, as soon as you add your CA Table to the model, the directory generated by the system (in our case it is “ITSM_EVENTS_CASES”) will automatically be deleted from the data model.
Why is the “CA Table” interesting? It is she who is displayed in the graphical interface as a process detail. If the analyst, while working with the data model, found something interesting in the process and wanted to go down to individual specific examples, then he will use the “View CA” report, that is, detailing. By opening such a report, you will find out in it the process reference (combined with the event table, of course). Therefore, add to the “CA Table” everything that the analyst can use to understand the properties of the process and the conditions of its course.
Figure 9. Synthetic example report “View CA”
How to add your process reference to the data model:
- A table is created in SAP HANA.
- The table is added to the general data model using the "Import Data" button.
- In the graphical interface, in the properties of the table, you need to set the role "Table with CA" to it.
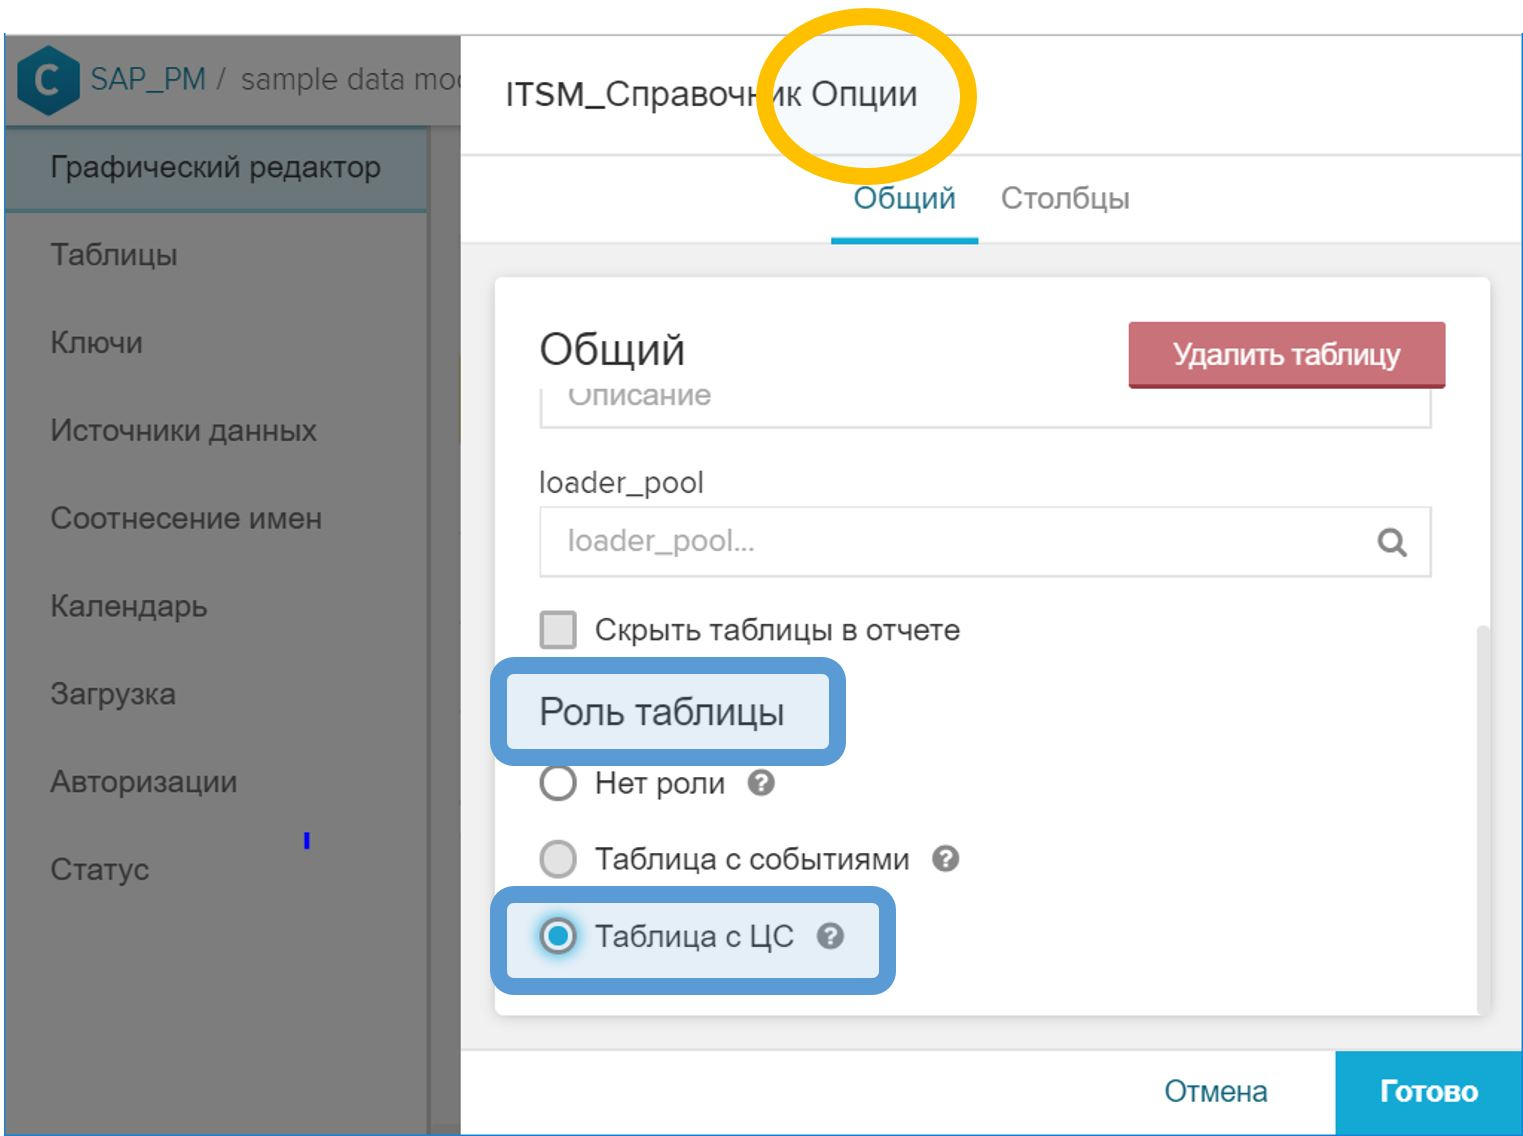
Figure 10. The role of “Table with CA” to indicate the directory of process instances - In the GUI, associate the CA table with the event table by process ID. This step is performed in exactly the same way as in the case of a regular directory - with the button with the key symbol ( ) opposite the corresponding field.
- In the "Status" menu, click the "Reload from source" button.
Important note: the “CASE_ID” column (in each case, it may be called in some other way) in the CA table, which contains the process identifier and is used to associate with the event table, should contain only unique values. This is quite logical. And if for some reason this is not so, then when loading the data model in step (5), the corresponding error will be generated (about the impossibility of performing the “JOIN” operation on the event table and the CA table).
Creating a data model from change history
In practice, we come across very different data sources for Process Mining. Their composition is determined by the selected business process and the standards adopted by the customer.
One of the most common cases is data from the IT service management system (ITSM, IT Service Management), so we decided to parse this example first. In fact, there is no tight binding specifically to ITSM in this approach. It can be applied in other business processes, where the data source is a change history or audit log.
What to ask from IT?
If you are not an IT employee or the specialist who serves the ITSM basis, then be prepared for the fact that you will be asked to formulate an exact answer to the question “what do you unload?” Or “what do you want from us?”.
And this is not always known - what exactly is needed. Analysis of a business process is a study, a search for patterns and the hunt for "insights." If we knew in advance what kind of “insight” we are looking for, then this would not be “insight” anymore. In fact, I would like to get "everything": attributes, relationships, changes. But, as practice shows, it has never been possible to get a good accurate answer to a too general question.
There are two possible answers to the question “what do you unload”.
The option is wrong: ask the basis to unload all changes in the application statuses plus a set of obvious attributes (say, priority, artist, workgroup, etc.). Firstly, you get a limited set of analysts: you already know what you will measure in the process (this is where the set of attributes came from), so Process Mining will turn into a tool for calculating the process KPI (very convenient, I must say, a tool; but still I want to more).
Secondly, each individual IT department differently interprets the request to add additional request attributes to the upload. For example, take priority: it can change while working on a call. The appeal is registered with one priority, then the specialist of the working group changes it, and it closes with a different status. And now the question is: in the unloading requested by you, what moment does the priority correspond to? Initially, it seems that the priority value should correspond to the column “Date and time of the event”. But in reality it often turns out that the indicated date and time correspond only to the application status itself, and all other columns are the values at the time of unloading or at the time of closing the application. And you will not know about this at once.
It seems to me that there is a better option. You can request data in the form of the following table:
- The number of the appeal, incident, task (SD *, IM *, RT *, ...) is the identifier of the object in the ITSM system (NVARCHAR)
- Timestamp (TIMESTAMP)
- Attribute Name (NVARCHAR)
- Old Value (NVARCHAR)
- New Value (NVARCHAR)
- Who has changed (NVARCHAR)
In fact, this is nothing more than a history of changes in any attributes. In the interfaces of ITSM-systems you can see such a table on the tabs with the name “History” or “Journal”.
The advantages of this approach are obvious:
- Simple and clear upload format. He is familiar to IT professionals in the graphical interface of the system itself. Should not cause questions from the basis.
- We get a list of all possible attributes with all possible values. Yes, there will be many of them, most likely several hundred. But filtering out the unnecessary and uninteresting is very simple, but each time requesting additional unloadings is not always simple and always long (especially when you do not know what attributes are present in the system at all).
- This is a reliable data model. It is difficult to spoil it, unless you make false information intentionally.
- We know exactly what each attribute had at each moment in time. This is important because we test ourselves and make sure the model is correct. And during the analysis, we can add intermediate steps to the model (“zoom in”) and determine the correct attribute values at all additional points in time.
The disadvantages of the second option are also clear. And they, it seems to me, can be solved (as opposed to the problem of incomplete data):
- The SQL script for data preparation becomes somewhat more complicated - compared to the option when the IT basis team does the partial data preparation for you (see the first version of the query above), without suspecting it. Yes, he (the script) is more complicated, but he is alone. I think it would be a bad idea to share data preparation between the ITSM team and the Process Mining team. Ideally, the entire transformation should be transferred to the Process Mining team so that they understand what exactly is happening with the data, and to minimize interference with the data on the source side. A simple data exchange format helps achieve this goal.
- The volume of unloading is large. The order may be this: 10-30 GB / year for a large company. But loading such a volume into HANA is not a problem at all and is not even considered a task. In addition, we talk about “uploading” only during the pilot project, while ETL / ELT integration between the data source and HANA (for example, HANA Smart Data Integration) will be used in industrial operation, and this item will cease to matter.
I would not like to say that this is the only correct way to get data from the ITSM system for Process Mining tasks. But at the current time, I am inclined to believe that this is the most convenient format for this task. There are probably plenty more interesting approaches, and I will be very happy to discuss alternative ideas if you share them with me.
Event Table Generation
So, at the exit, we have a history of changes in the attributes of requests, incidents, calls, tasks and other ITSM objects. From such a table, it is possible to generate both key components of the Process Mining data model: an event table and a CA table.
To generate events based on the change history, do the following:
- From the change history, collect all the unique values of the (conditionally) “attribute name” column.
- Determine the change in which attributes you would like to see on the process graph. What is an “event” for us?
- Create an appropriate Calculation View or write an SQL script that filters the selected rows from the change history and generates an event table.
Suppose the change table is as follows:
CREATE COLUMN TABLE "SAP_PM"."ITSM_HISTORY" ( "CASE_ID" NVARCHAR(256), "ATTRIBUTE" NVARCHAR(256), "VALUE_OLD" NVARCHAR(1024), "VALUE_NEW" NVARCHAR(1024), "TS" TIMESTAMP, "USER" NVARCHAR(256) );
First, look at the list of all the attributes present. This can be done in the “Open Data Preview” menu or with a simple SQL query like this:
SELECT DISTINCT "ATTRIBUTE" FROM "SAP_PM"."ITSM_HISTORY";
Figure 11. Context menu with the Open Data Preview command in SAP HANA Studio
Then we determine the composition of the attributes, the change of which is for us an event in the process. Here is a list of obvious candidates for such a list:
- Status
- Was taken to work
- Category has been changed
- Deadline violated
- Reaction time violated
- Request has been returned for revision.
- 1st line error
- Working group
- A priority
The main events here, of course, are the transitions between the statuses of the appeal / incident \ application \ task. The value of the “Status” attribute (VALUE_NEW) itself will be the name of the process step for us. Accordingly, creating an event table as a first approximation might look like this:
CREATE COLUMN TABLE "SAP_PM"."ITSM_EVENTS" ( "CASE_ID" NVARCHAR(256) ,"EVENT" NVARCHAR(1024) ,"TS" TIMESTAMP ,"USER" NVARCHAR(256) ,"VALUE_OLD" NVARCHAR(1024) ,"VALUE_NEW" NVARCHAR(1024) ); INSERT INTO "SAP_PM"."ITSM_EVENTS" SELECT "CASE_ID" ,"VALUE_NEW" AS "EVENT" ,"TS" ,"USER" ,"VALUE_OLD" ,"VALUE_NEW" FROM "SAP_PM"."ITSM_HISTORY" WHERE "ATTRIBUTE" = '' ;
Changing the rest of the attributes is our additional steps that make researching the process even more interesting. Their composition is determined by the request of a business analyst and can change as the practice of Process Mining in the company develops.
INSERT INTO "SAP_PM"."ITSM_EVENTS" SELECT "CASE_ID" ,"ATTRIBUTE" AS "EVENT" ,"TS" ,"USER" ,"VALUE_OLD" ,"VALUE_NEW" FROM "SAP_PM"."ITSM_HISTORY" WHERE "VALUE_OLD" IS NOT NULL AND "ATTRIBUTE" IN ( ' ' ,' ' ,' ' ,' ' ,' ' ,' 1- ' ,' ' ,'') );
Expanding the list of attributes in the WHERE "ATTRIBUTE" IN filter (.....) You increase the variety of steps that is displayed on the process graph. It is worth noting that a wide variety of steps is not always a blessing. Sometimes too detailed detailing only makes it difficult to understand the process. I think that after the first iteration you will determine which steps are needed and which should be excluded from the data model (and the freedom to make such decisions and quickly adapt to them is another argument in favor of transferring the work of transforming data to the side of the Process Mining team) .
The filter "VALUE_OLD" IS NOT NULL, most likely you will replace it with something more suitable for your conditions and for the selected attributes. I will try to explain the meaning of this filter. In some popular implementations of ITSM systems, at the time of registration (opening) of an appeal, information about the initialization of all attributes of the object is entered into the journal. That is, all the fields are marked with some default values. At this moment, VALUE_NEW will contain the same initializing value, and VALUE_OLD will not contain anything - after all, there was no history until this moment. We absolutely do not need these records in the process. They should be removed with a filter appropriate to your specific conditions. Such a filter may be:
- "VALUE_OLD" IS NOT NULL
- "VALUE_NEW" = 'yes'
- You can focus on the time stamp (take only those events that occurred after the registration of the object).
- You can focus on the "USER" field if the system account is initializing.
- Any other conditions you have come up with.
CA Table Generation
The same history of changes that served us as a source of events is also useful for creating a directory of process instances (CA Tables). Algorithm similar:
1. Define a list of attributes that:
a. Do not change during the work on the application, for example, the author of the appeal and his department, the user's rating based on the results of work, the flag of violation of the deadline.
b. They can change, but we are only interested in the values at certain points: at the time of registration, closing, when hiring, transferring from the 2nd line to the 1st, etc.
c. They can change, but we are only interested in aggregated values (maximum, minimum, quantity, etc.)
2. Create a diagonal table with the desired set of columns. Each attribute of interest to us will generate its own set of rows (according to the number of process instances), in which only one column will have a value, and all the rest will be empty (NULL).
3. We collapse the diagonal table into the final directory using grouping by process identifier.
Examples of attributes that it makes sense to put in the CA table (in practice, this list can be much longer):
- Service
- IT system
- Author
- Author Organization
- User rating of solution quality
- Number of returns to work
- When was taken to work
- Created by
- Who closed
- Solved by Line 1
- Invalid classification / routing
- Deadline
- Deadline violation
One and the same attribute can be either a source of an event in a process or a property of a process instance. For example, the attribute "Priority". On the one hand, we are interested in its value at the time of registration of the appeal, and on the other, all the facts of changes in this attribute can be submitted to the process graph as independent steps.
Another example is Deadline. This is an obvious reference property of the process, but you can make a virtual step in the process graph from it: such an operation as the “Deadline” does not exist in the process, but if we add the corresponding record to the Event Table, we will create it artificially and we can visualize the location relative to execution time of other steps right on the process graph. This is convenient for quick analysis.
In general, when we create process properties based on the history of attribute changes, the source of useful information for us can be:
- The value of the attribute itself (example: "User rating")
- User who changed it
- Change time
- The time when the attribute took on a certain value (example: the attribute “Deadline violated” - it’s not the value of the attribute that interests it, but the time when it changes to the equivalent of the flag raised - for example, “yes” or 1)
- The fact that the attribute is present in the story (example: “Mass incident” with the value 'yes')
This list, of course, can be continued with other ideas for using attributes and all that is connected with them.
Now that we have already decided on the list of properties of interest, let's look at one of the possible scenarios for generating the CA table. First, create the table itself with the set of columns that we defined above for ourselves:
CREATE COLUMN TABLE "SAP_PM"."ITSM_CASES" ( "CASE_ID" NVARCHAR(256) NOT NULL ,"CATEGORY" NVARCHAR(256) DEFAULT NULL ,"AUTHOR" NVARCHAR(256) DEFAULT NULL ,"RESOLVER" NVARCHAR(256) DEFAULT NULL ,"RAITING" INTEGER DEFAULT NULL ,"OPEN_TIME" TIMESTAMP DEFAULT NULL ,"START_TIME" TIMESTAMP DEFAULT NULL ,"DEADLINE" TIMESTAMP DEFAULT NULL );
We will also need a temporary table “ITSM_CASES_STAGING”, which will allow us to sort out a flat list of attributes for the required property columns in the directory of process instances:
CREATE COLUMN TABLE "SAP_PM"."ITSM_CASES_STAGING" LIKE "SAP_PM"."ITSM_CASES" WITH NO DATA;
This will be a diagonal table - in each row only two fields have a value: "CASE_ID", i.e. process identifier, and one single field with a process property. The remaining fields in the row will be empty (NULL). At the final stage, we easily collapse the diagonals into rows by simple aggregation and thus obtain the table of CAs we need.
An example for a treatment category:
INSERT INTO "SAP_PM"."ITSM_CASES_STAGING" ("CASE_ID", "CATEGORY") SELECT "CASE_ID", LAST_VALUE("VALUE_NEW" ORDER BY "TS") FROM "SAP_PM"."ITSM_HISTORY" WHERE "ATTRIBUTE" = '' GROUP BY "CASE_ID" ;
Suppose that the author is the first non-system user in the history of the appeal that registers appeals (in your particular case, the criterion may be more accurate):
INSERT INTO "SAP_PM"."ITSM_CASES_STAGING" ("CASE_ID", "AUTHOR") SELECT "CASE_ID", FIRST_VALUE("USER" ORDER BY "TS") FROM "SAP_PM"."ITSM_HISTORY" WHERE "USER" != 'SYSTEM' GROUP BY "CASE_ID" ;
If we consider that the processor, which put down the last status “Solution proposed” (and the solution could be offered repeatedly, but only the last one is fixed), successfully solved the problem, then this property of the process instance can be formulated as follows:
INSERT INTO "SAP_PM"."ITSM_CASES_STAGING" ("CASE_ID", "RESOLVER") SELECT "CASE_ID", LAST_VALUE("USER" ORDER BY "TS") FROM "SAP_PM"."ITSM_HISTORY" WHERE "ATTRIBUTE" = '' AND "VALUE_NEW" = ' ' GROUP BY "CASE_ID" ;
User rating (his satisfaction with the decision):
INSERT INTO "SAP_PM"."ITSM_CASES_STAGING" ("CASE_ID", "RAITING") SELECT "CASE_ID", TO_INTEGER(LAST_VALUE("VALUE_NEW" ORDER BY "TS")) FROM "SAP_PM"."ITSM_HISTORY" WHERE "ATTRIBUTE" = ' ' AND "VALUE_NEW" IS NOT NULL GROUP BY "CASE_ID" ;
The time of registration (creation) is simply the earliest record in the history of circulation:
INSERT INTO "SAP_PM"."ITSM_CASES_STAGING" ("CASE_ID", "OPEN_TIME") SELECT "CASE_ID", MIN("TS") FROM "SAP_PM"."ITSM_HISTORY" GROUP BY "CASE_ID" ;
Reaction time is an important characteristic of the quality of services. To calculate it, you need to know when the flag “Was taken to work” was first raised:
INSERT INTO "SAP_PM"."ITSM_CASES_STAGING" ("CASE_ID", "START_TIME") SELECT "CASE_ID", MIN("TS") FROM "SAP_PM"."ITSM_HISTORY" WHERE "ATTRIBUTE" = ' ' AND 'VALUE_NEW' = '' GROUP BY "CASE_ID" ;
The deadline is used to calculate KPIs for timely responses to appeals or resolving incidents. In the process, the deadline may repeatedly change. To calculate KPIs, we need to know the latest version of this attribute. If we want to explicitly track how the deadline has changed, that is, to display such cases on the process graph, we should also use this attribute to generate an entry in the event table. This is an example of an attribute that simultaneously serves as both a process property and an event source.
INSERT INTO "SAP_PM"."ITSM_CASES_STAGING" ("CASE_ID", "DEADLINE") SELECT "CASE_ID", MAX(TO_DATE("VALUE_NEW")) FROM "SAP_PM"."ITSM_HISTORY" WHERE "ATTRIBUTE" = ' ' AND 'VALUE_NEW' IS NOT NULL GROUP BY "CASE_ID" ;
All the above examples are the same. By analogy with them, the CA table can be expanded with any attributes that interest you. Moreover, this can be done already after the start of the project, the system allows you to expand the data model during its operation.
When our temporary diagonal table is filled with the properties of the process instances, it remains only to do the aggregation and get the final table of the CA:
INSERT INTO "SAP_PM"."ITSM_CASES" SELECT "CASE_ID" ,MAX("CATEGORY") ,MAX("AUTHOR") ,MAX("RESOLVER") ,MAX("RAITING") ,MAX("OPEN_TIME") ,MAX("START_TIME") ,MAX("DEADLINE") FROM "SAP_PM"."ITSM_CASES_STAGING" GROUP BY "CASE_ID" ;
After that, we no longer need the data in the temporary table. The table itself can be left to continue repeating the above process on a regular basis to update the data model in Process Mining:
DELETE FROM "SAP_PM"."ITSM_CASES_STAGING";
Tips for preparing and cleaning CSV files for a pilot project
You will probably start your introduction to the Process Mining discipline with a pilot project. In this case, direct access to the data source cannot be obtained, both IT employees and information security officers will resist this. This means that as part of the pilot project, we will have to work with exporting data from corporate systems to CSV files and then importing them into SAP HANA to build a data model.
In an industrial installation, there will be no exports to CSV. Instead, SAP HANA integration tools will be used, in particular: Smart Data Integration (SDI), Smart Data Access (SDA) or SAP Landscape Transformation Replication Server (SLT). But for testing and familiarization with the technology, exporting to text CSV files is an organizationally simpler method. Therefore, it will be useful to share with you some tips for preparing data in CSV for quick and successful import into the database.
Recommended format requirements for the file itself when exporting:
- File Format: CSV
- Encoding: UTF8
- Field Separator: any character that is convenient for you. For example, “|” or “^” or “~”. The logic of the choice is simple - we must try to avoid the situation when the “split” is contained in the data itself.
- It is necessary to remove the separator from the value of the fields. Yes, you might say that for this, in fact, there are quotation marks. But, as experience shows, with quotes, too many problems arise. In general, let's just remove (or replace) the separator character from the field values. Your pilot project will not suffer much from such inaccuracy, but time for data preparation is noticeably saved.
- Quotation marks: remove all quotation marks from the field value. Quotation marks are often found in company names — say, Kalinka LLC. But there are such options: LLC MPZ Kalinka. And now this is a great difficulty. The quotation marks in the field values must either be accompanied by the “\” symbol, or removed, replaced with something else. It’s most reliable to just remove it. The field value will not suffer much from this.
- Carriage transfers: remove all CHAR (10) and CHAR (13) characters from the field values. Otherwise, import from CSV will be impossible.
If we take into account points (4) + (5) + (6), then it makes sense to use the following construction in the selection:
REPLACE(REPLACE(REPLACE(REPLACE("COLUMN", '|', ';'), '"', ''), CHAR(13), ' '), CHAR(10), ' ') as "COLUMN"
Further, when the CSV files are ready, they will need to be copied to the HANA server in a folder that is declared safe for importing files (for example, / usr / sap / HDB / import). Importing data into HANA from a local CSV file is a fairly quick procedure provided that the file is “clean”:
- each row of the future table is in one and only one line of the file;
- the number of columns in all rows is the same;
- quotation marks are either paired or missing at all;
- quotation marks in the field values either accompany the "escape" -symbol "\", or are absent altogether;
- UTF-8 encoding (and not UTF8-BOM, as happens when exporting to Windows systems).
To check the CSV files before importing them and find the problem areas if they exist (and with a probability of 99% they will), you can use the following commands:
1. Check the BOM character at the beginning of the file:
file data.csv
If the result of the command is like this: “UTF-8 Unicode (with BOM) text”, this means that the encoding is UTF8-BOM and you need to remove the BOM character from the file. You can remove it as follows:
sed -i '1s / ^ \ xEF \ xBB \ xBF //' data.csv
2. The number of columns should be the same for each line of the file:
cat data.csv | awk -F »;" '{print NF}' | sort | uniq
or like this:
for i in $ (ls * .csv); do echo $ i; cat $ i | awk -F ';' '{print NF}' | sort | uniq -c; echo; done;
Change ';' in parameter F to what is the field separator in your case.
As a result of the execution of these commands, you will get the distribution of rows by the number of columns in each row. Ideally, you should get something like this:
EKKO.csv
79536 200
Here the file contains 79536 lines, and all of them contain 200 columns. There are no rows with a different number of columns. It should be so.
And here is an example of an incorrect result:
LFA1.csv
73636 180
7 181
Here we see that most rows contain 180 columns (and, probably, this is the number of columns that is correct), but there are rows with the 181st column. That is, one of the fields contains a separator sign in its value. We were lucky and there are only 7 such lines - they can easily be looked at manually and somehow corrected. You can see the lines in which the number of columns is not equal to 180, like this:
cat data.csv | awk -F ";" '{if (NF! = 180) {print $ 0}}'
A note on using the above commands. These commands will not pay attention to quotation marks. If the separator sign is contained in the field enclosed in quotation marks (and that means everything is fine here from the point of view of import into the database), then checking with this method will show a false problem (extra columns) - this should also be taken into account when analyzing the results.
3. If the quotation marks are unpaired and cannot solve this problem in any way, then you can delete all quotation marks from the file:
sed -i 's / "// g' data.csv
The danger of this approach is that if the field values contain a separator character, then the number of columns in the row will change. Therefore, the separator characters must be removed from the field values at the export stage (delete or replace with some other character).
4. Empty fields
Faced with a situation where the successful import of data was prevented by empty field values in this form:
; ""
Where “;” is the field separator character in this case. That is, the field is two double quotation marks (plain empty string). If you suddenly cannot import the data, and you suspect that the problem may be empty fields, then try replacing “” with NULL
sed -i 's /; ”” /; NULL / g' data.csv
(substitute “;” for your separator option)
5. It can be useful to look for “dirty” number formats in the data:
; "0" (the number contains a space)
; “100.10-” (the sign “-“ after the number)
The Bugatti 3/4 "300 crane - an inch dimension is indicated by a double quotation mark - and this automatically leads to the problem of unpaired quotation marks when exporting.
Unfortunately, this is not an exhaustive list of possible problems with inconvenient data formats for import into the database. It would be great to know your options from practice: what curious mistakes have you come across? How you detected and eliminated them. Share in the comments.
Conclusion
In general, the data model for Process Mining is very simple: an event table plus, optionally, additional references. But as it usually happens, it starts to seem simple only when at least one complete cycle of tasks has been completed - then the whole process is visible in its entirety, and the work plan is clear. I hope this article helps you figure out how to prepare the data for your first Process Mining project. In general, the preparation process looks like this:
- Requesting a change history from the data owner
- Checking and cleaning the upload (preparation of CSV files)
- Import to SAP HANA
- Event table building
- Building a CA table (process reference)
And, in fact, this is where the preparation of the data model begins and the most interesting part begins - Process Mining. If you have any questions during the implementation of the Process Mining project, feel free to write in the comments, I will be happy to help. Good luck!
Fedor Pavlov, SAP CIS platform expert
All Articles