See almost invisible, also in color: a technique for visualizing objects through a diffuser
One of Superman's most famous abilities is super vision, which allowed him to view atoms, see in the dark and at great distances, and also see through objects. This ability is extremely rarely demonstrated on screens, but it is. In our reality, it is also possible to see through almost completely opaque objects by applying some scientific tricks. However, the images received were always black and white, until recently. Today we will get acquainted with a study in which scientists from Duke University (USA) were able to take a color picture of objects hidden behind an opaque wall using a single light exposure. What is this super technology, how does it work and in what areas can it be applied? The report of the research group will tell us about this. Go.
Study basis
Despite all the possible "buns" of the technology for visualizing objects in scattering media, there are a number of problems with the implementation of this technology. The main one is the fact that the paths of photons passing through the scatterer vary greatly, which leads to random speckle patterns * on the other side.
In recent years, several visualization techniques have been developed to circumvent the effects of the diffuser and extract information about the object from the speckle pattern. The problem with these techniques is their limitations - you need to have certain knowledge about the object, have access to a scattering medium or object, etc.
Speckle * is a random interference pattern formed by the mutual interference of coherent waves that have random phase shifts and / or a random set of intensity. Most often it looks like a set of bright spots (dots) on a dark background.
At the same time, there is a much more advanced, according to scientists, method - visualization with a memory effect (ME). This method allows you to visualize an object without prior knowledge regarding its own or scattering medium. Everyone has disadvantages, as we know, and the ME method is no exception. To obtain high-contrast speckle patterns and, accordingly, more accurate images, the lighting should be narrow-band, i.e. less than 1 nm.
Outsmarting the limitations of the ME method is also possible, but, again, these tricks involve accessing an optical source or object to the diffuser, or directly measuring the PSF * .
PSF * is a point spread function that describes the image that the formation system receives when observing a point light source or a point object.Researchers call these methods working, but not perfect, since PSF measurement is not always possible due to, for example, the dynamics of the diffuser or its inaccessibility to the imaging procedure. In other words, there is work to do.
Researchers propose a different approach in their work. They demonstrate to us a method for implementing multispectral visualization of objects through a scattering medium using a single speckle measurement with a monochrome camera. Unlike other techniques, this one does not require prior knowledge of the PSF system or source spectrum.
The new method allows you to create high-quality images of the target object in five well-separated spectral channels between 450 nm and 750 nm, which was confirmed by calculations. In practice, so far it has been possible to achieve visualization of three well separated spectral channels between 450 nm and 650 nm and six adjacent spectral channels between 515 and 575 nm.
The principle of the new method

Image No. 1: lamp - spatial light modulator - diffuser (with iris) - coding aperture - prism - optical relay (1: 1 visualization) - monochrome camera.
Researchers note the three main elements of any visualization through a diffuser: an object of interest (illuminated from the outside or glowing independently), a diffuser, and a detector.
As in standard ME systems, this study considers an object whose angular size is located inside the ME field of view and at a distance u behind the diffuser. After interacting with the diffuser, the light propagates to a distance v before reaching the detector.
Conventional ME imaging uses standard cameras, and this method uses a coding detector module consisting of a coding aperture and an optical element depending on the wavelength. The purpose of this element is to uniquely modulate each spectral channel before combining them and transforming them in a monochrome detector.
Thus, instead of simply measuring a low-contrast speckle, whose spectral channels are inextricably mixed, a spectrally multiplexed signal was recorded that was well suited for separation.
Researchers once again emphasize that their method does not require any previously known characteristics or assumptions regarding a diffuser or light source.
After preliminary measurements of the multiplexed speckle, the well-known Tλ value (wavelength-dependent coding pattern) was used to individually reconstruct the speckle in each spectral band.
In their work at the stage of calculations and modeling, scientists applied certain machine learning methods that can help in the implementation of a previously not considered method. First of all, training was used on the features of a sparse matrix to represent speckle.
Training in signs * - allows the system to automatically find the representations necessary to identify signs of the source data.As a result, a base was trained on speckle images from various measurement configurations. This base is quite generalized and does not depend on specific objects and scatterers involved in the generation of the mask Iλx, y. In other words, the system is trained based on the diffuser, which is not used in the experimental configuration, i.e. the system does not have access to it, as the researchers wanted.
To obtain speckle images at each wavelength, the OMP ( orthogonal matching pursuit ) algorithm was used.
In the end, by calculating the autocorrelation of each spectral channel independently and the inversion of autocorrelation at each wavelength, images of the object were obtained. The resulting images at each wavelength are then combined to create a color image of the object.
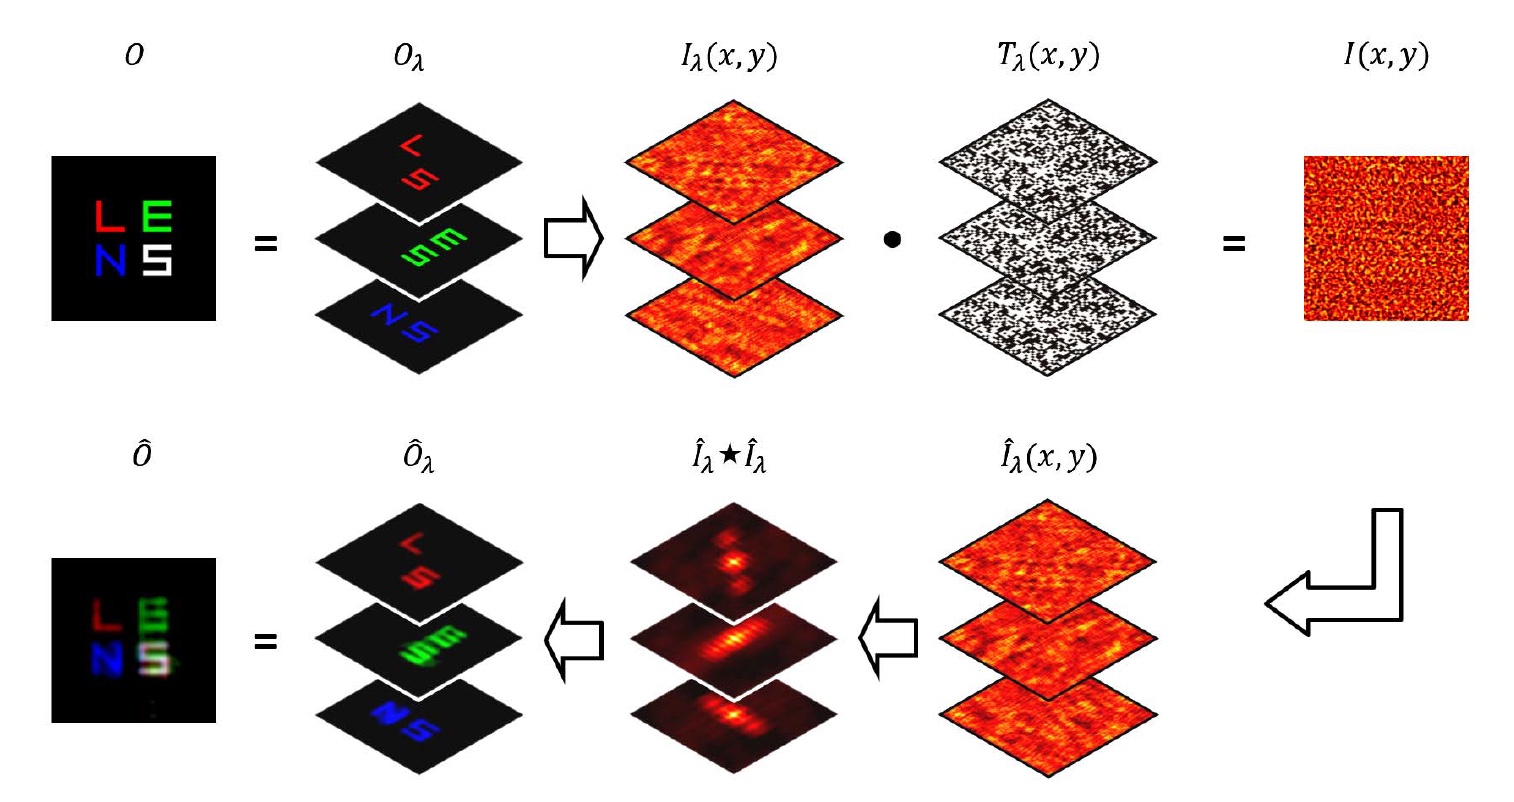
Image # 2: A phased process for compiling an image of an object.
This technique, according to its creators, does not make any assumptions about the correlations between the spectral channels and requires only the assumption that the value of the wavelength is quite random. In addition, this method requires only information about the coding detector, relying on pre-calibration of the coding aperture and a pre-trained data library. Such characteristics make this imaging technique highly versatile and non-invasive.
Simulation results
To begin, consider the simulation results.
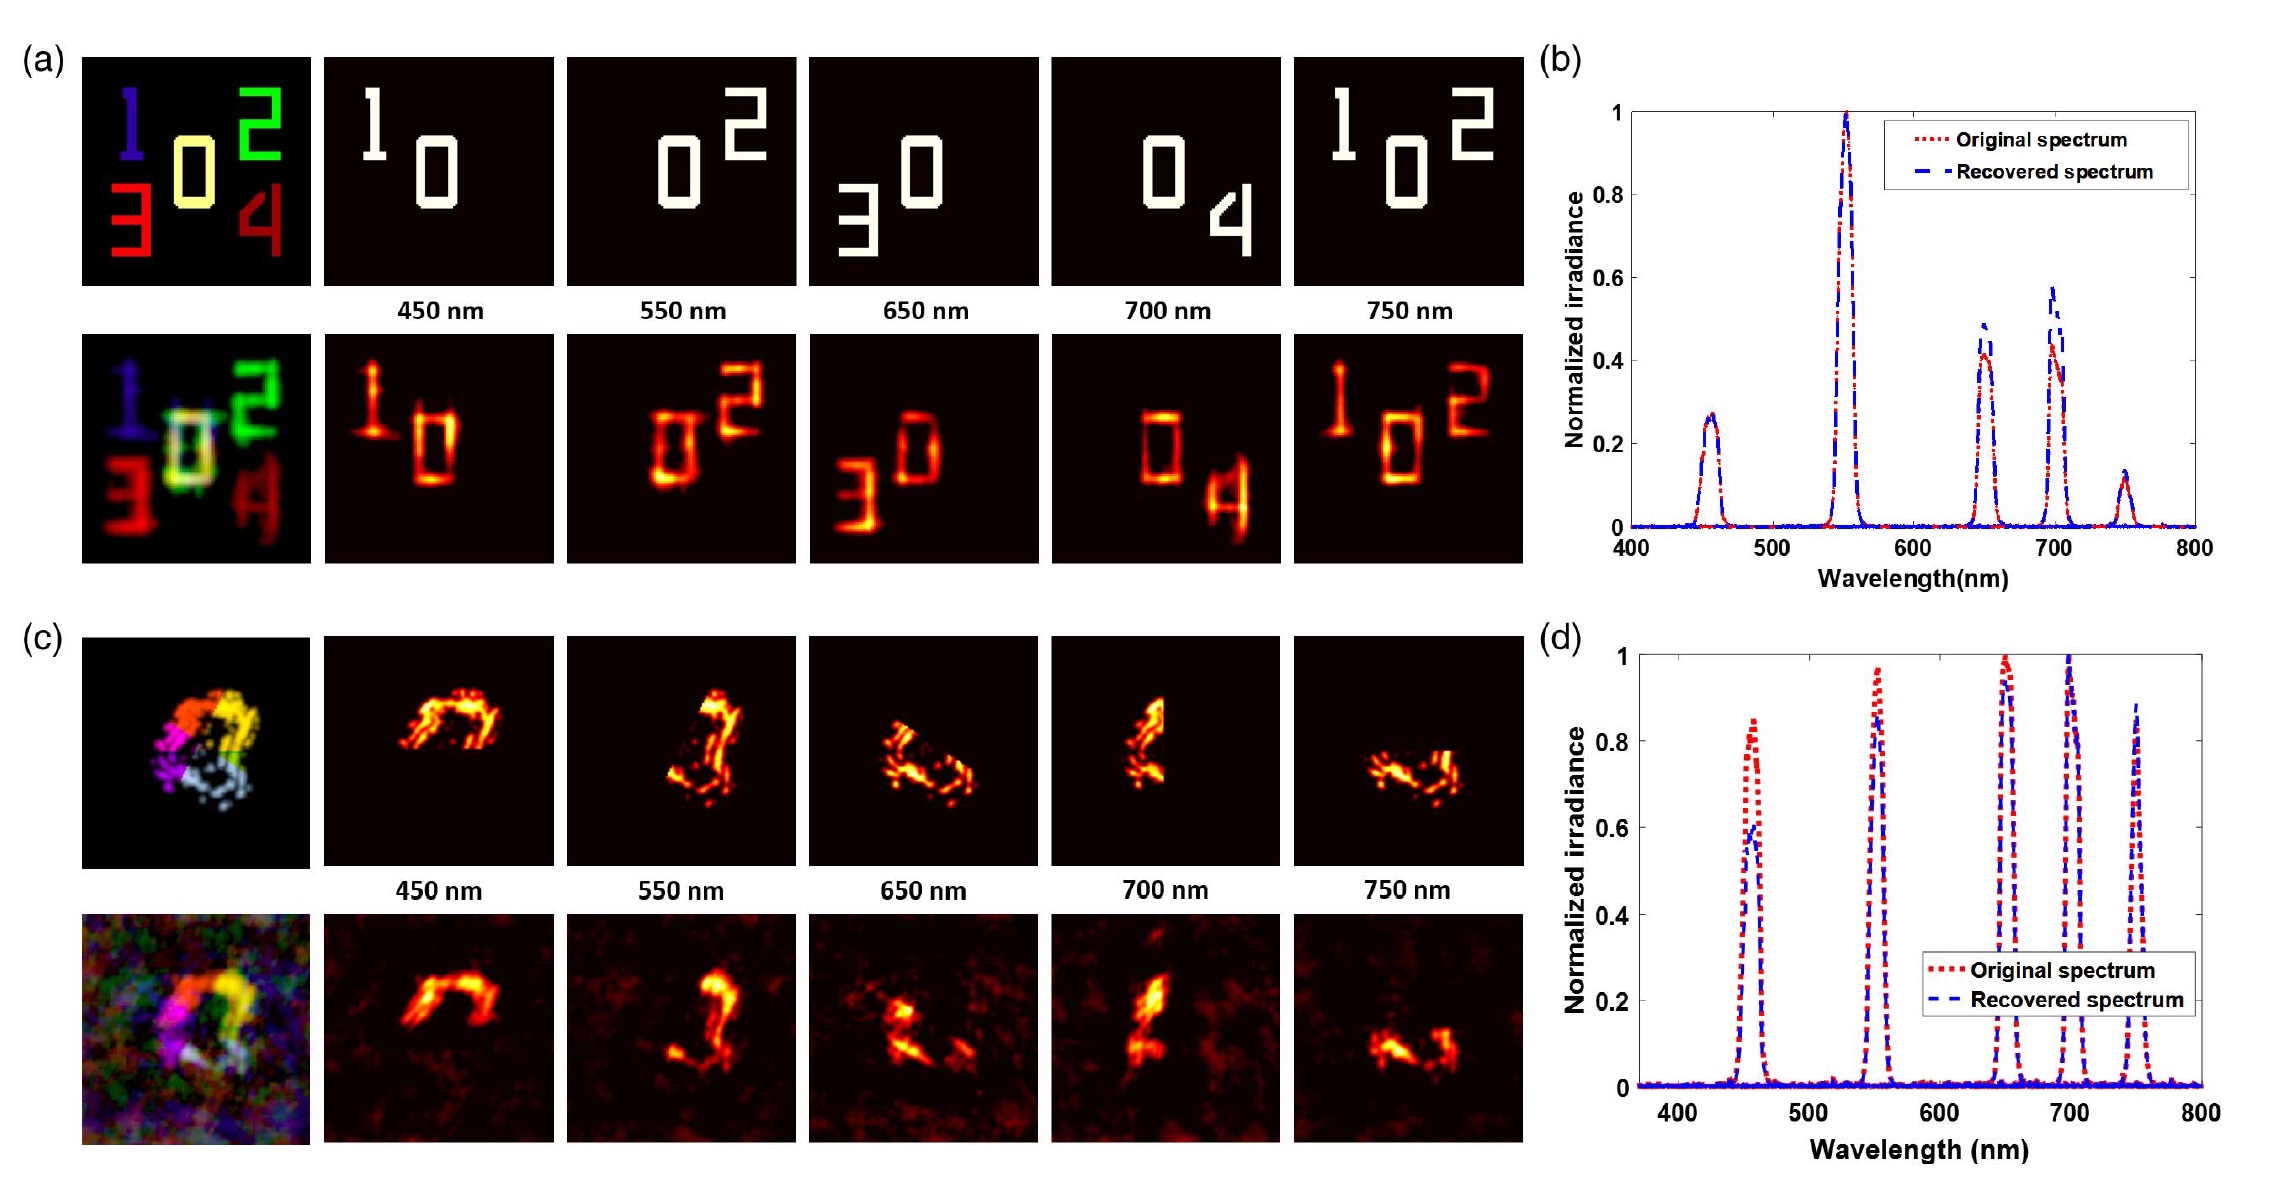
Image No. 3
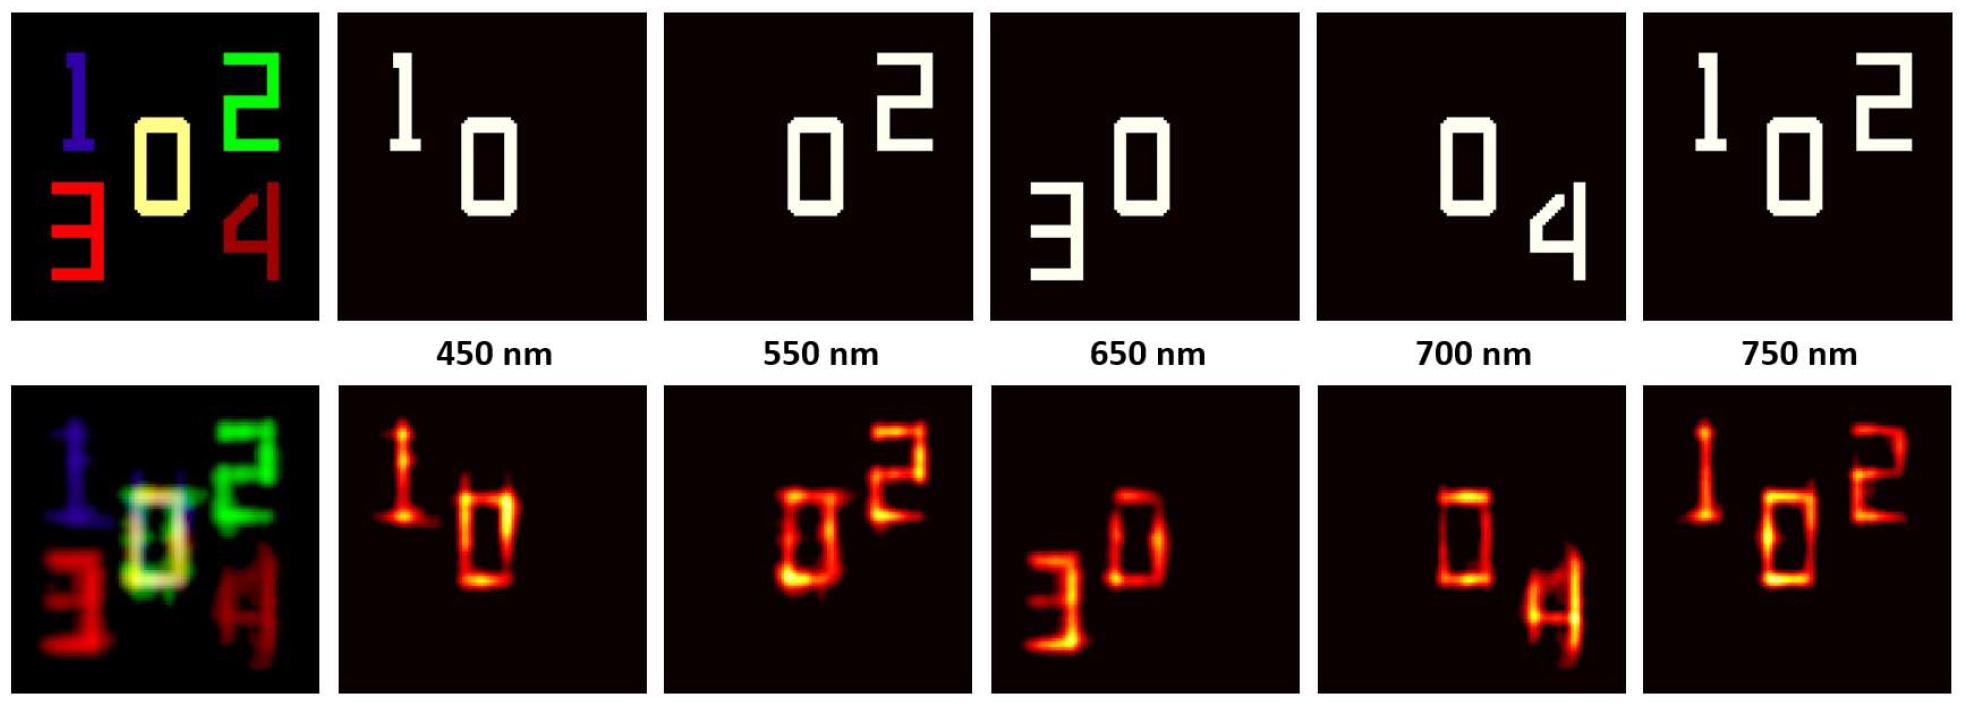
The image above shows examples of a multispectral image of two objects taken through a diffuser. The upper row at 3a contains an object of interest, consisting of several numbers shown both in false color and in a breakdown by the spectral channel. When constructing an object in false color, the intensity profile of each wavelength in the CIE 1931 RGB space is displayed.
The reconstructed object (lower row at 3a ) both in false color and from the point of view of individual spectral channels demonstrates that the technique provides excellent visualization and only insignificant cross interaction between spectral channels, which does not play a special role in the process.
After receiving the reconstructed object, i.e. after visualization, it was necessary to evaluate the degree of accuracy by comparing the spectral intensity (averaged over all bright pixels) of the real object and the reconstructed ( 3b ).
Images 3c show a real object (upper row) and a reconstructed image (lower row) for a cell from a cotton stem, and 3d shows an analysis of the visualization accuracy.
To assess the accuracy of the visualization, it was necessary to calculate the values of the structural similarity coefficient (SSIM) and the peak signal-to-noise ratio (pSNR) of this object for each spectral channel.
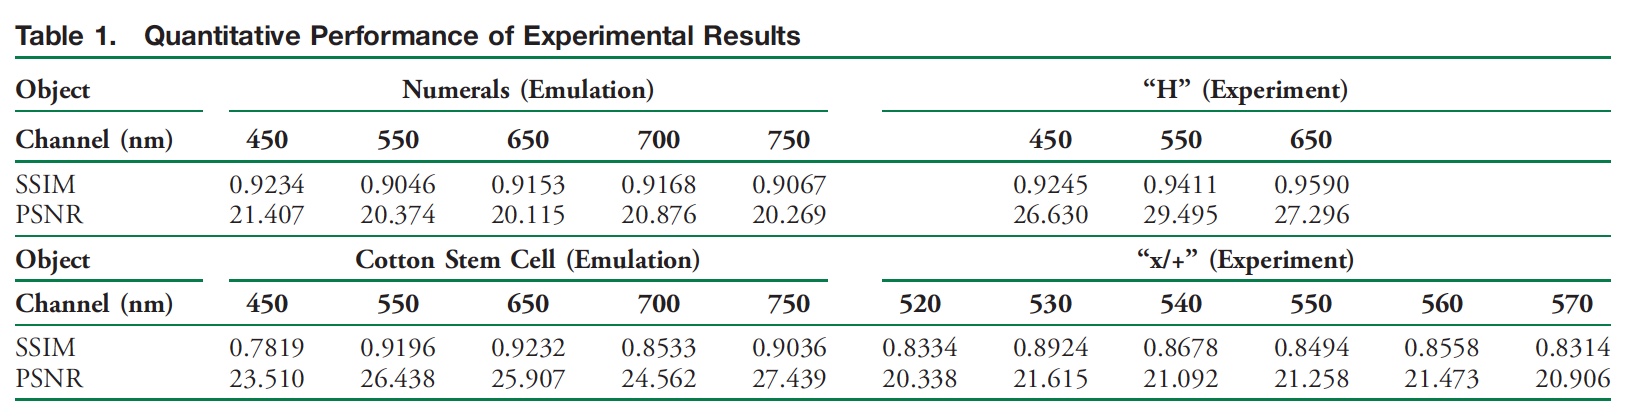
The table above shows that each of the five channels has an SSIM coefficient of 0.8–0.9 and a PSNR of more than 20. From this it follows that despite the low contrast of the speckle signal, the superposition of five spectral bands with a width of 10 nm on the detector allows a fairly accurate reconstruction spatial and spectral properties of the studied object. In other words, the technique works, however, these are just simulation results. For the sake of confidence in their work, scientists conducted a number of practical experiments.
Experiment Results
One of the most significant differences between modeling and real experiments is the environment, i.e. the conditions in which both are carried out. In the first case, there are controlled conditions, in the second, unpredictable conditions, i.e. we'll see how it goes.
Three spectral channels with a width of 8-12 nm were examined with a center of 450, 550 and 650 nm, which in combination with various relative values generate a wide range of colors.
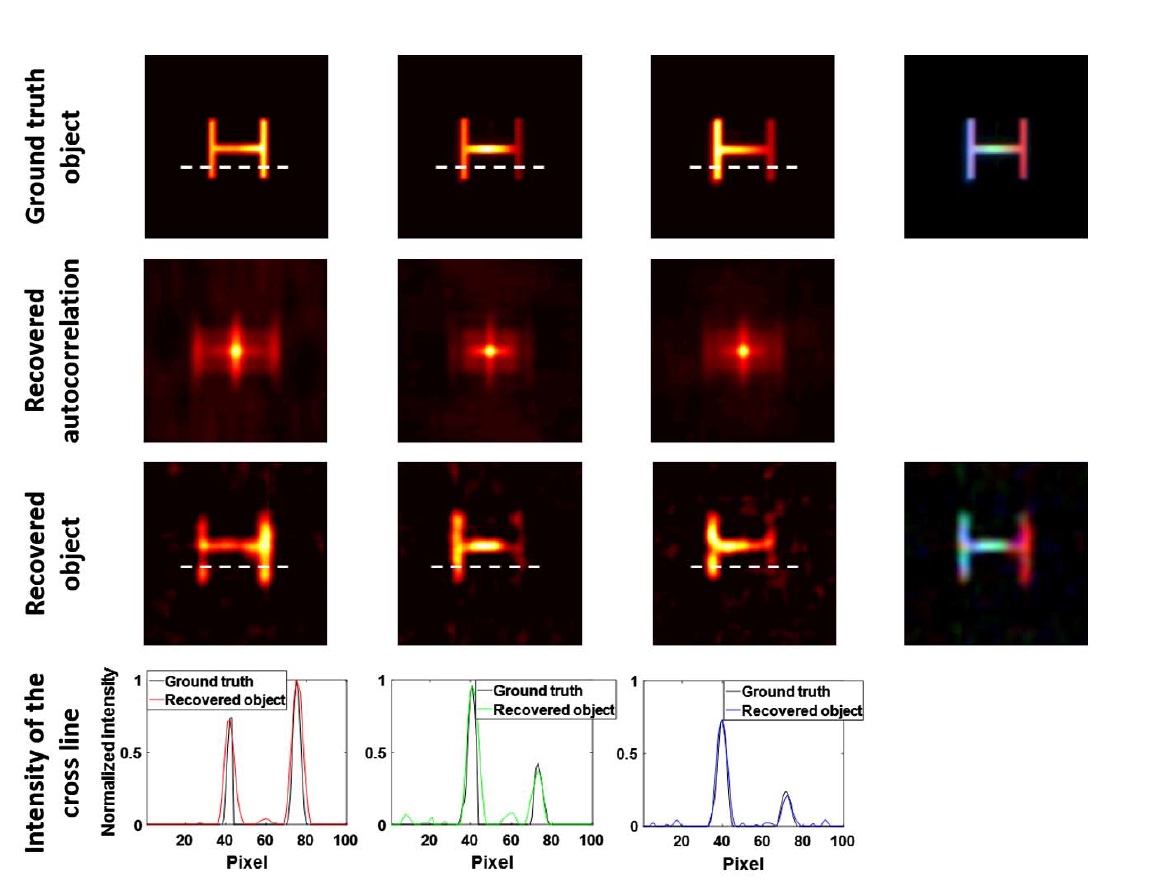
Image No. 4
The image above shows a comparison between the real object (multi-colored letter "H") and the reconstructed one. The exposure time (exposure time, i.e. exposure) was set to 1800 s, which allowed us to obtain SNR in the range of 60-70 dB. Such an SNR indicator, according to scientists, is not extremely important for experience, but serves as an additional confirmation of the operability of their methodology, especially in the case of complex objects. In reality, and not in laboratory conditions, this method can be an order of magnitude faster.
The top row of image No. 4 shows an object at each wavelength (from left to right) and a real full-color object.
In order to obtain an image of a real object as a result of visualization, a machine vision camera with corresponding band-pass filters was used to directly display spectral components and obtain a full-color image by summing the resulting spectral channels.
The second row of the image above shows the autocorrelation patterns of each reconstructed spectral channel forming multiplexed measurements, which are input data for the data processing step.
The third row is a reconstructed object in each spectral channel, as well as a reconstructed full-color object, i.e. end result of visualization.
The full-color image shows that the relative values between the spectral channels are also correct, since the color of the combined reconstructed image corresponds to the real value, and the SSIM coefficient reaches more than 0.92 for each channel.
The bottom row is a confirmation of this statement, showing a comparison of the intensity of the real object and the reconstructed. The data of both coincide in all spectral ranges.
It follows that even the presence of noise and potential modeling errors did not prevent the obtaining of a high-quality image, and the experimental results correlate well with the simulation results.
The above experience was set taking into account the divided spectral channels. Scientists conducted another experiment, but with adjacent channels, and more precisely with a continuous spectral range of 60 nm.
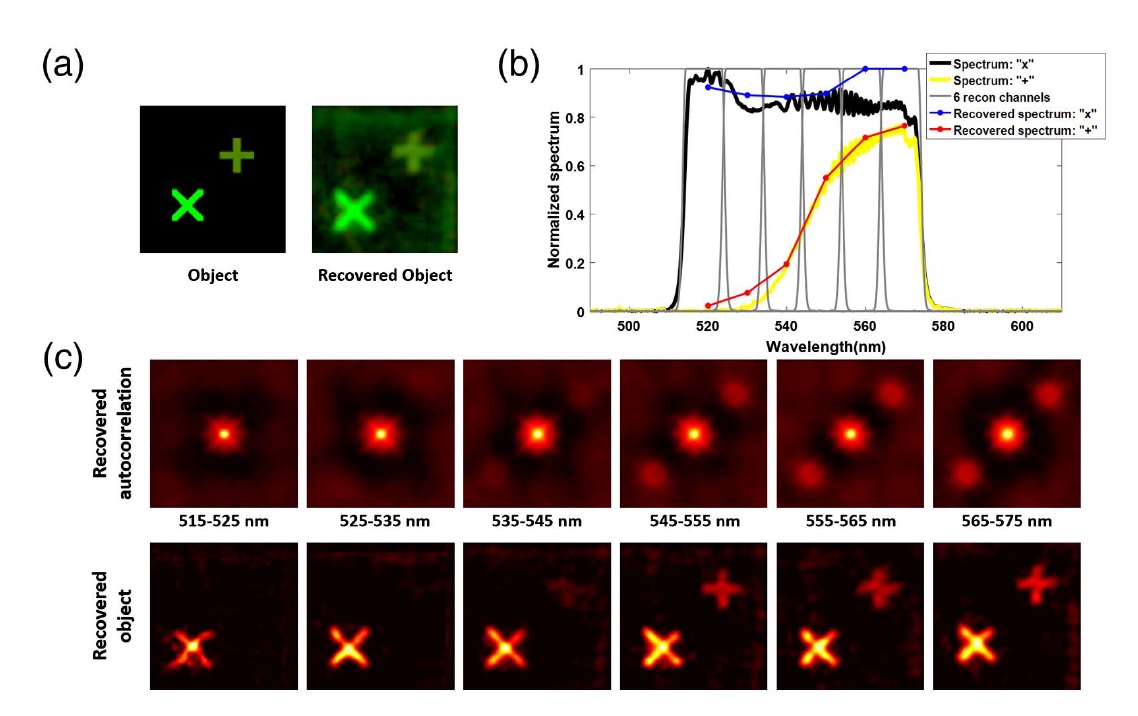
Image No. 5
The letter “X” and the sign “+” ( 5a ) acted as a real object. The spectrum of the letter “X” is relatively uniform and continuous - between 515 and 575 nm, but the “+” has a structured spectrum, mainly located between 535 and 575 nm ( 5b ). For this experiment, the exposure was 120 s to achieve the desired (as before) SNR of 70 dB.
A 60-nm-wide bandpass filter over the entire object and a low-pass filter above the “+” sign were also used. During the reconstruction of 60 nm, the spectrum is divided into 6 adjacent channels with a width of 10 nm ( 5b ).
As we can see from images 5c , the resulting images are in excellent agreement with the real object. This experiment showed that the presence or absence of spectral correlations in the measured speckle does not affect the effectiveness of the imaging technique under study. Scientists themselves believe that not so much the spectral characteristics of an object, but rather the calibration of the system and the details of its coding detector, play a much greater role in the visualization process.
For a more detailed acquaintance with the nuances of the study, I recommend that you look into the report of scientists and additional materials to it.
Epilogue
In this work, scientists described a new method of multispectral imaging through a diffuser. The modulation of the speckle, depending on the wavelength, using a coding aperture, made it possible to perform one multiplexed measurement and calculate the speckle using the OMP algorithm based on machine learning.
Using the multi-colored letter “H” as an example, scientists have shown that focusing on five spectral channels corresponding to violet, green, and three shades of red allows one to obtain an image reconstruction containing all the colors of the original (blue, yellow, etc.).
According to the researchers, their technique may be useful both in medicine and in astronomy. Color carries important information in both directions: in astronomy - the chemical composition of the objects studied, in medicine - the molecular composition of cells and tissues.
At this stage, scientists note only one problem that can cause inaccuracies in visualization, these are modeling errors. Due to the long enough time required to complete the process, environmental changes can occur that will make their own adjustments that were not taken into account at the preparation stage. However, in the future it is planned to find a way to level this problem, which will make the described visualization technique not only accurate, but also stable in any conditions.
Friday off-top:
Light, color, music and a trio of the most famous blue “eccentrics” in the world (Blue Man Group).
Thank you for your attention, remain curious, and have a great weekend, guys! :)
Light, color, music and a trio of the most famous blue “eccentrics” in the world (Blue Man Group).
Thank you for your attention, remain curious, and have a great weekend, guys! :)
Thank you for staying with us. Do you like our articles? Want to see more interesting materials? Support us by placing an order or recommending it to your friends, a 30% discount for Habr users on a unique analogue of entry-level servers that we invented for you: The whole truth about VPS (KVM) E5-2650 v4 (6 Cores) 10GB DDR4 240GB SSD 1Gbps from $ 20 or how to divide the server? (options are available with RAID1 and RAID10, up to 24 cores and up to 40GB DDR4).
Dell R730xd 2 times cheaper? Only we have 2 x Intel TetraDeca-Core Xeon 2x E5-2697v3 2.6GHz 14C 64GB DDR4 4x960GB SSD 1Gbps 100 TV from $ 199 in the Netherlands! Dell R420 - 2x E5-2430 2.2Ghz 6C 128GB DDR3 2x960GB SSD 1Gbps 100TB - from $ 99! Read about How to Build Infrastructure Bldg. class c using Dell R730xd E5-2650 v4 servers costing 9,000 euros for a penny?
All Articles