How we tested several time series databases

Over the past few years, Time-series databases have evolved from a strange thing (highly specialized in either open monitoring systems (and tied to specific solutions) or in Big Data projects) into a “consumer goods”. In the territory of the Russian Federation, special thanks should be given to Yandex and ClickHouse for this. Up to this point, if you needed to save a large amount of time-series data, you had to either accept the need to raise a monstrous Hadoop stack and accompany it, or communicate with protocols specific to each system.
It might seem that in 2019, an article about which TSDB should be used will consist of only one sentence: “just use ClickHouse”. But ... there are nuances.
Indeed, ClickHouse is actively developing, the user base is growing, and support is being very active, but have we become hostages to ClickHouse’s public success, which has overshadowed other, possibly more effective / reliable solutions?
At the beginning of last year, we started processing our own monitoring system, during which the question arose of choosing the appropriate database for storing data. I want to tell about the history of this choice here.
Formulation of the problem
First of all, the necessary preface. Why do we even need our own monitoring system and how was it arranged?
We started providing support services in 2008, and by 2010 it became clear that it was difficult to aggregate data on processes occurring in the client infrastructure by the solutions that existed at that time (we are talking about, God forgive me, Cacti, Zabbix and the nascent Graphite).
Our main requirements were:
- support (at that time - dozens, and in the future - hundreds) of customers within the same system and at the same time the presence of a centralized alert management system;
- flexibility in managing the notification system (escalation of alerts between those on duty, schedule accounting, knowledge base);
- the possibility of deep detailing of graphs (Zabbix at that time was drawing graphs in the form of pictures);
- long-term storage of a large amount of data (a year or more) and the ability to quickly select them.
In this article, we are interested in the last point.
Speaking of storage, the requirements were as follows:
- the system should work quickly;
- it is desirable that the system has an SQL interface;
- the system must be stable and have an active user base and support (once we were faced with the need to support systems such as MemcacheDB, which we stopped developing, or the distributed MooseFS storage, the bugtracker of which was conducted in Chinese: repeating this story for our project did not want);
- Correspondence to the CAP-theorem: Consitency (necessary) - the data must be relevant, we do not want the notification management system to not receive new data and spit alerts about the non-receipt of data for all projects; Partition Tolerance (necessary) - we do not want to get Split Brain systems; Availability (not critical, in the case of an active replica) - we can switch to the backup system ourselves in case of an accident, with a code.
Oddly enough, at that time MySQL was the perfect solution for us. Our data structure was extremely simple: server id, counter id, timestamp and value; fast hot data sampling was provided by a large buffer pool, and historical data sampling was provided by SSD.
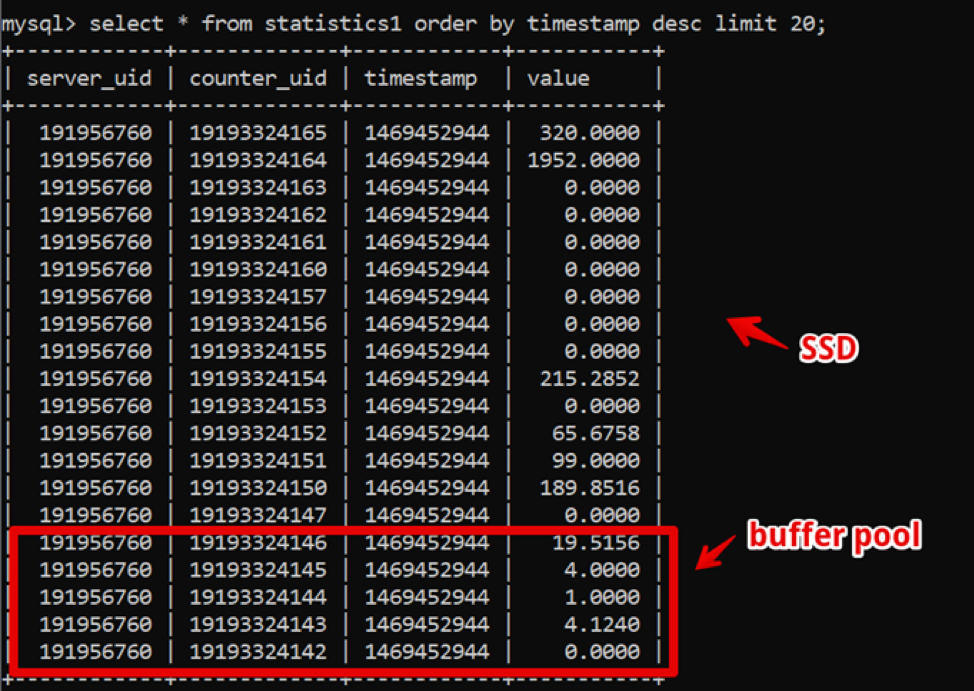
Thus, we achieved a sampling of fresh two-week data, with detailing up to a second 200 ms before the data was completely rendered, and lived in this system for quite some time.
Meanwhile, time passed and the amount of data grew. By 2016, the data volumes reached tens of terabytes, which in terms of leased SSD storage was a significant expense.
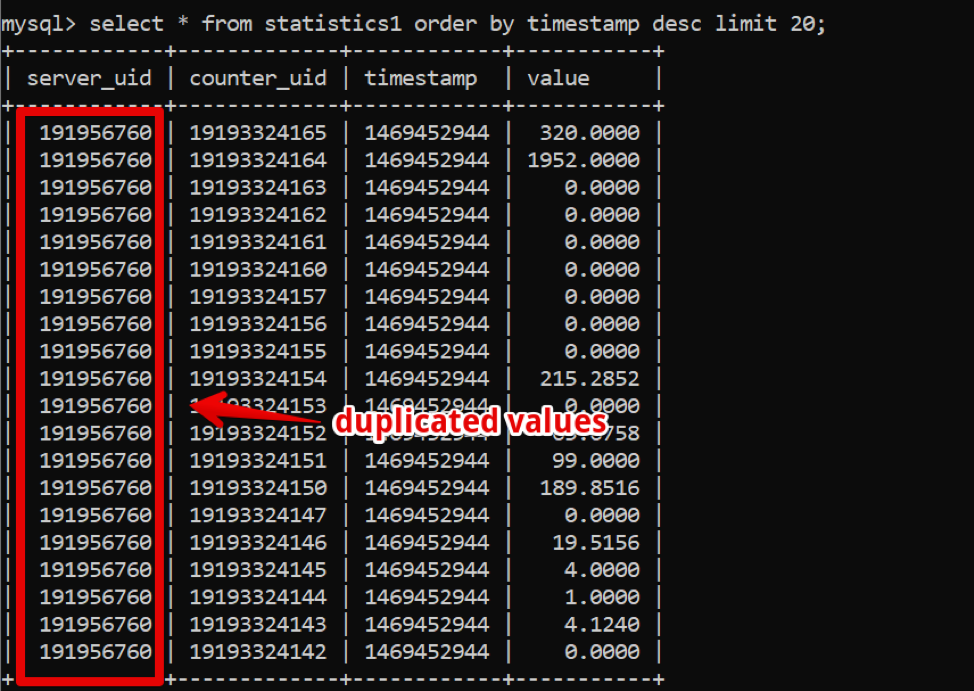
At this point, columnar databases were actively spreading, about which we began to think actively: in columnar databases, data are stored, as you can understand, in columns, and if you look at our data, it is easy to see a large number of duplicates that could be If using a column database, compress with compression.
However, the key system for the company's work continued to work stably, and I did not want to experiment with the transition to something else.
In 2017, at the Percona Live conference in San Jose, probably the first time that the Clickhouse developers announced themselves. At first glance, the system was production-ready (well, Yandex.Metrica is a harsh production), the support was quick and simple, and, most importantly, the operation was simple. Since 2018, we have started the transition process. But by that time, there were a lot of “adult” and time-tested TSDB systems, and we decided to allocate considerable time and compare alternatives in order to make sure that there are no alternative Clickhouse solutions, according to our requirements.
In addition to the storage requirements already indicated, fresh ones appeared:
- the new system should provide at least the same performance as MySQL on the same amount of iron;
- storage of the new system should occupy significantly less space;
- DBMS should still be easy to manage;
- I wanted to minimize the application when changing the DBMS.
What systems we began to consider
Apache Hive / Apache Impala
Old battered Hadoop stack. In essence, this is an SQL interface built on top of storing data in native formats on HDFS.
Pros.
- With stable operation, it is very easy to scale the data.
- There are column solutions for data storage (less space).
- Very fast execution of parallel tasks in the presence of resources.
Minuses.
- This is a Hadoop, and it is difficult to operate. If we are not ready to take a ready-made solution in the cloud (and we are not ready for the cost), the whole stack will have to be assembled and supported by the admins, but I really do not want this.
- Data is aggregated really fast .
But:
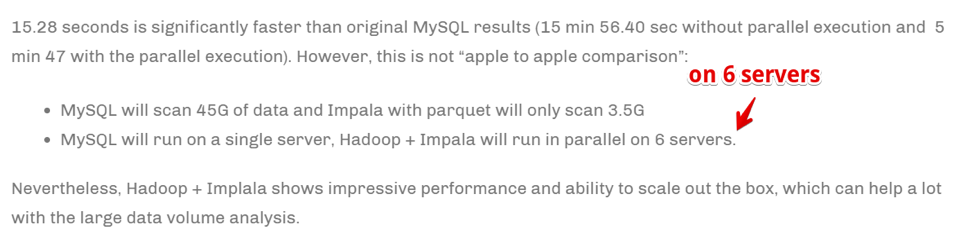
Speed is achieved by scaling the number of computing servers. Simply put, if we are a large company engaged in analytics and business, it is critically important to aggregate information as quickly as possible (even at the cost of using a large number of computing resources) - this may be our choice. But we were not ready to multiply the iron park to speed up the tasks.
Druid / pinot
Already much more about TSDB specifically, but again - Hadoop-stack.
There is a great article comparing the pros and cons of Druid and Pinot compared to ClickHouse .
In a few words: Druid / Pinot look better than Clickhouse in cases where:
- You have a heterogeneous nature of the data (in our case, we only record timeseries of server metrics, and, in fact, this is one table. But there may be other cases: equipment time series, economic time series, etc. - each with its own structure, which must be aggregated and processed).
- Moreover, there is a lot of these data.
- Tables and data with time series appear and disappear (that is, some kind of data set came in, it was analyzed and deleted).
- There is no clear criterion by which data can be partitioned.
In opposite cases, ClickHouse shows itself better, and this is our case.
Clickhouse
- SQL-like.
- Easy to manage.
- People say that it works.
Included in the testing shortlist.
Influxdb
Foreign alternative to ClickHouse. Of the minuses: High Availability is present only in the commercial version, but it must be compared.
Included in the testing shortlist.
Cassandra
On the one hand, we know that it is used for storing metric timeseries by monitoring systems such as, for example, SignalFX or OkMeter. However, there are specifics.
Cassandra is not a column database in the usual sense. It looks more like a lowercase, but each row can have a different number of columns, due to which it is easy to organize a column representation. In this sense, it is clear that with a limit of 2 billion columns, you can store some data in the columns (yes, the same time series). For example, in MySQL there is a limit on 4096 columns and it is easy to stumble upon an error with code 1117 if you try to do the same.
The Cassandra engine is focused on storing large amounts of data in a distributed system without a wizard, and in the aforementioned CAP-theorem, Cassandra is more about AP, that is, about data accessibility and resistance to partitioning. Thus, this tool can be great if you only need to write to this database and rarely read from it. And here it’s logical to use Cassandra as a “cold” storage. That is, as a long-term reliable place to store large amounts of historical data that are rarely required, but can be obtained if necessary. Nevertheless, for the sake of completeness, we test it. But, as I said earlier, there is no desire to actively rewrite the code for the selected DB solution, so we will test it somewhat limited - without adapting the database structure to the specifics of Cassandra.
Prometheus
Well, and out of interest, we decided to test the performance of the Prometheus store - just to understand whether we are faster than current solutions or slower and how much.
Methodology and test results
So, we tested 5 databases in the following 6 configurations: ClickHouse (1 node), ClickHouse (distributed table of 3 nodes), InfluxDB, Mysql 8, Cassandra (3 nodes) and Prometheus. The test plan is as follows:
- fill in the historical data for the week (840 million values per day; 208 thousand metrics);
- generate a recording load (6 load modes were considered, see below);
- in parallel with the recording, we periodically make samples, emulating the requests of a user working with charts. In order not to complicate things too much, we selected data by 10 metrics (just as much of them on the CPU graph) per week.
We load by emulating the behavior of our monitoring agent, which sends values to every metric every 15 seconds. In this case, we are interested in varying:
- total number of metrics into which data is written;
- interval of sending values in one metric;
- batch size.
About the size of the batch. Since almost all of our experimental bases are not recommended to be loaded with single inserts, we will need a relay, which collects incoming metrics and groups them as much as possible and writes to the database with a packet insert.
Also, in order to better understand how to interpret the received data later, imagine that we are not just sending a bunch of metrics, but the metrics are organized into servers — 125 metrics per server. Here, the server is simply a virtual entity - just to understand that, for example, 10,000 metrics correspond to approximately 80 servers.
And so, taking all this into account, our 6 recording load modes of the base:
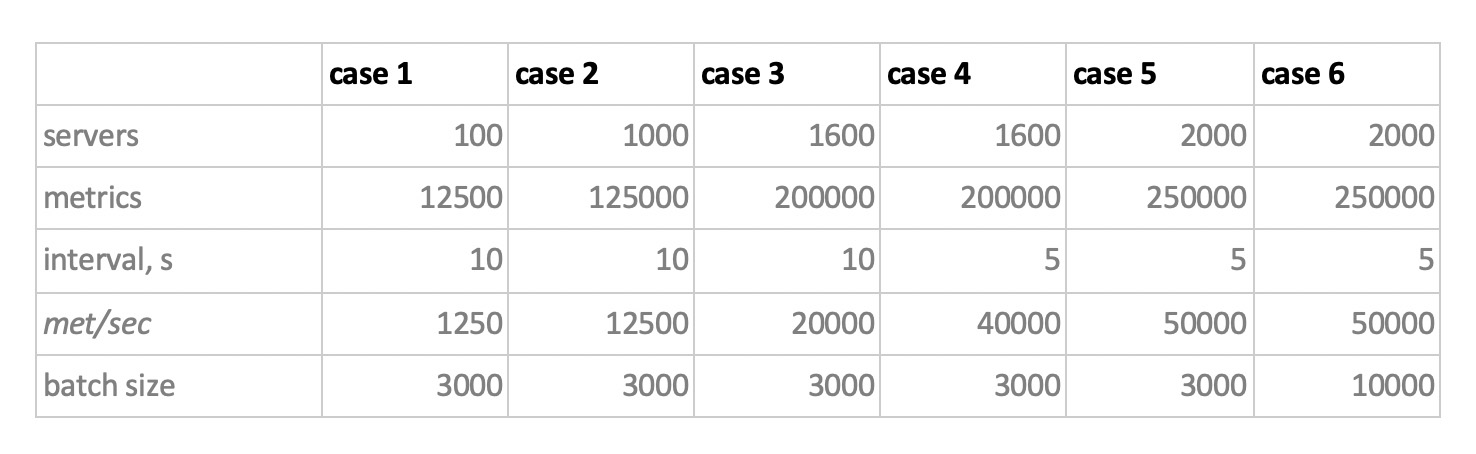
There are two points. Firstly, for cassandra such sizes of batches turned out to be too large, there we used values of 50 or 100. And secondly, since the prometeus works strictly in pull mode, i.e. he walks and collects data from metric sources (and even pushgateway, despite the name, does not fundamentally change the situation), the corresponding loads were implemented using a combination of static configs.
The test results are as follows:
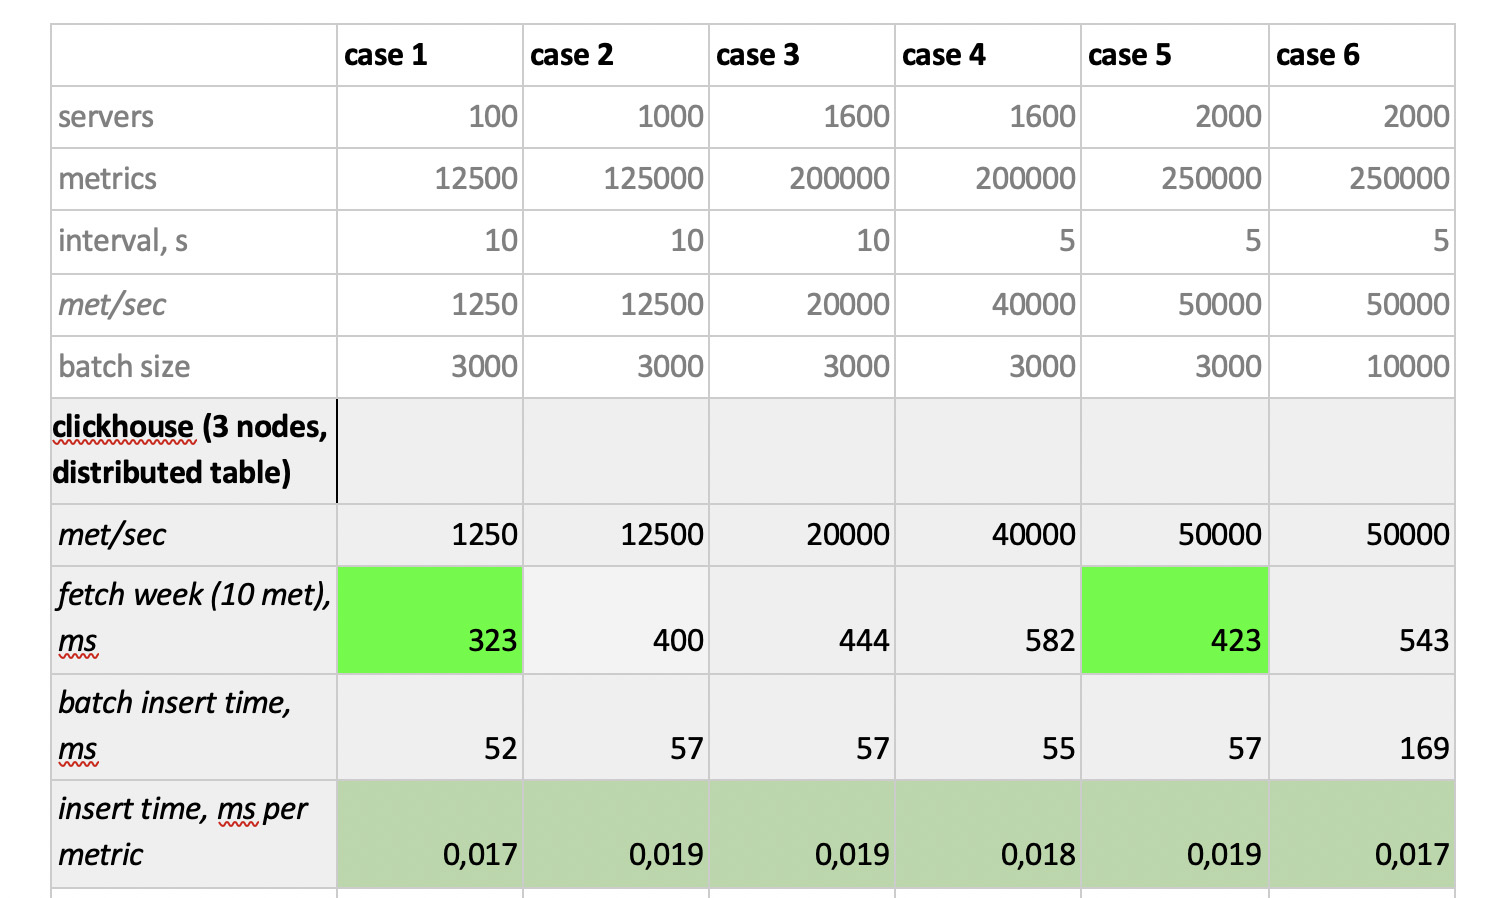
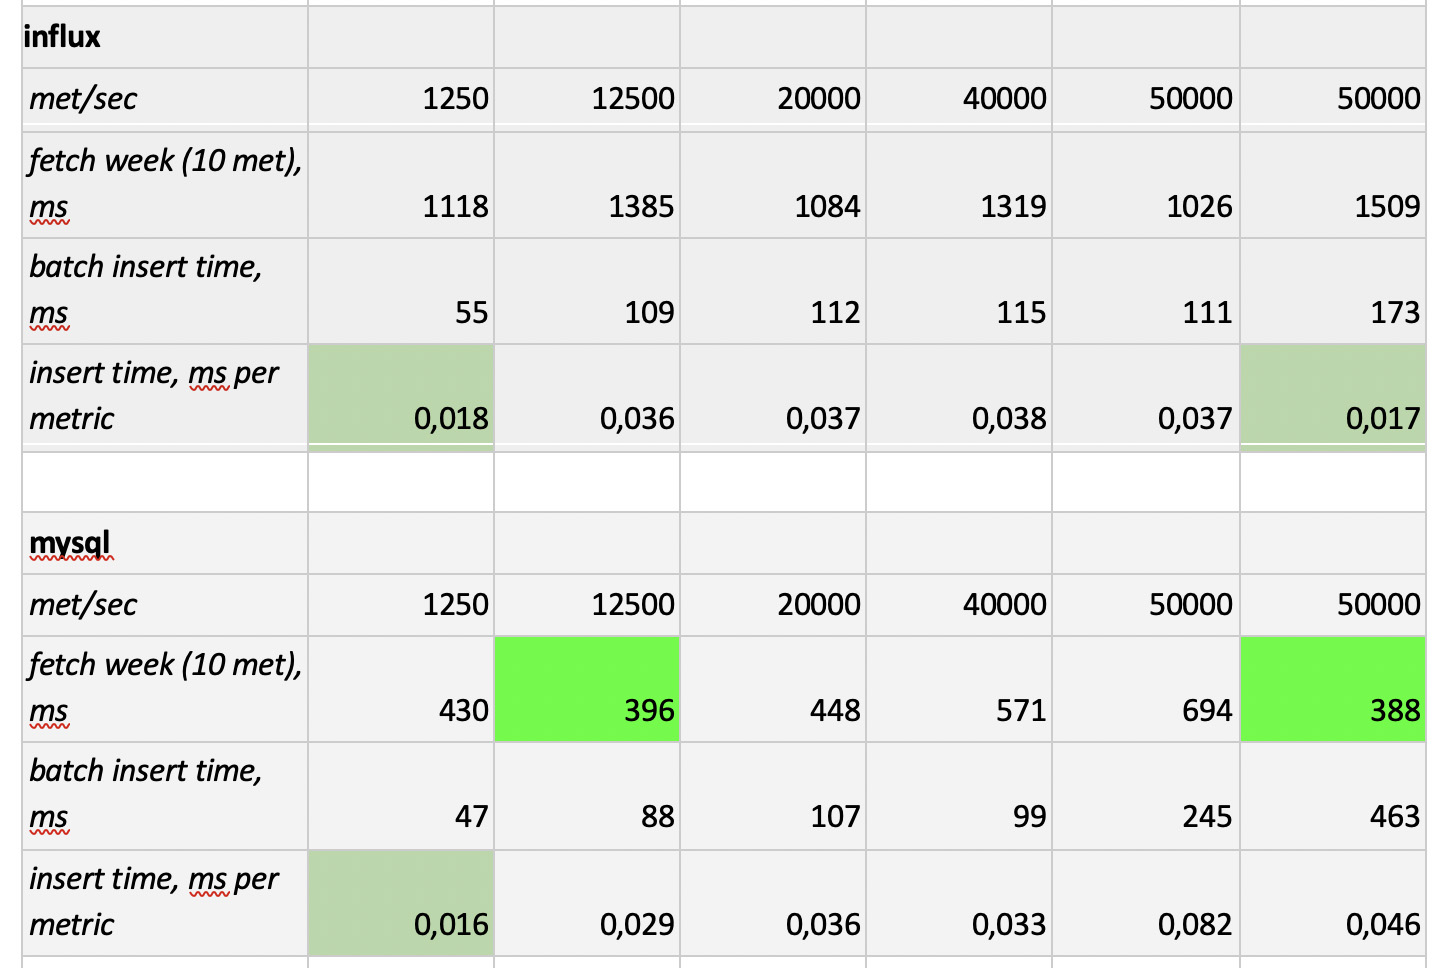
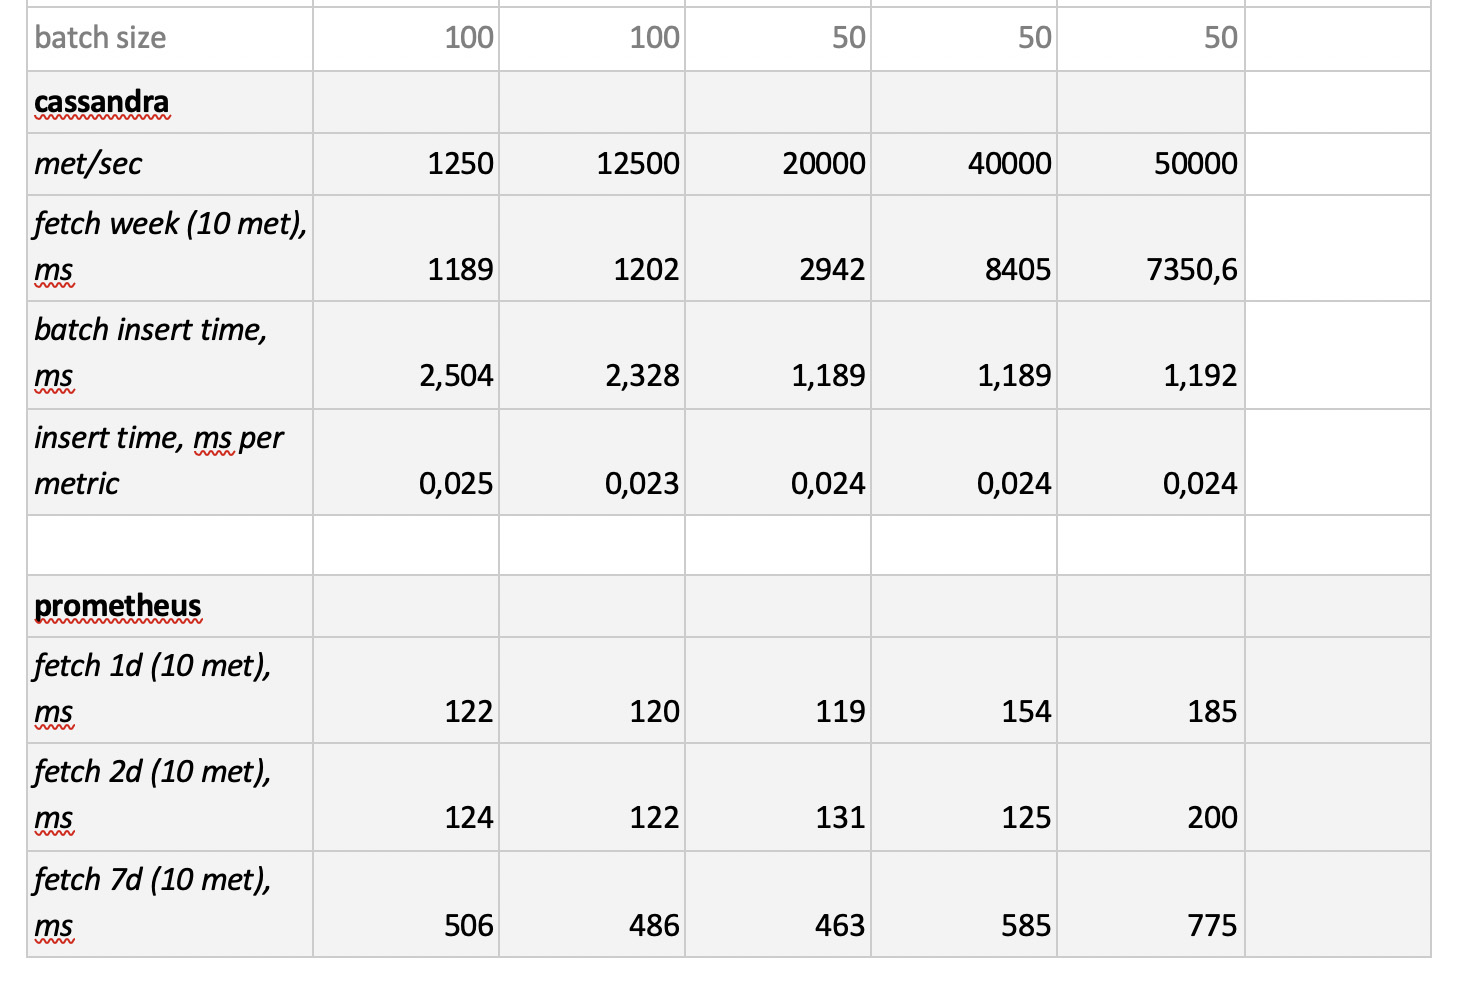
What is worth noting : fantastically fast samples from Prometheus, terribly slow samples from Cassandra, unacceptably slow samples from InfluxDB; ClickHouse won in terms of recording speed, but Prometheus does not participate in the competition, because it does inserts within itself and we do not measure anything.
In the end : ClickHouse and InfluxDB showed themselves best of all, but a cluster from Influx can only be built on the basis of the Enterprise version, which costs money, and ClickHouse does not cost anything and is made in Russia. It is logical that in the USA the choice is probably in favor of inInfluxDB, and in our case it is in favor of ClickHouse.
All Articles