How cards are made
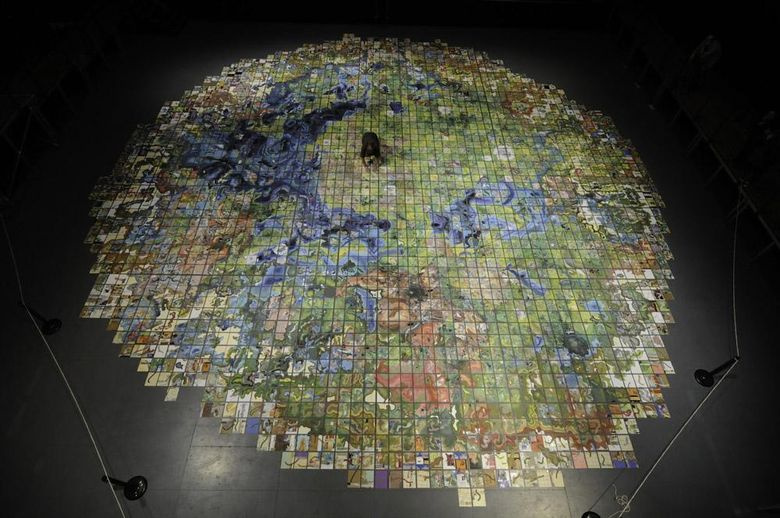
A hand-drawn map of the Massachusetts Museum of Modern Art.
Modern cartographers are much easier than their colleagues from the past, who created a scheme that is far from ideal with very approximate calculations of the location of objects. Until the beginning of the 20th century, cartography changed slowly and, although there were almost no white spots at that time, they could not boast of map accuracy.
With the beginning of the aerial era of the terrain, cartographers received an excellent tool, which made it possible to draw up a detailed plan of any territory. Satellite survey was supposed to complete a thousand years of work to create the perfect tool for orienteering, but cartographers faced new problems.
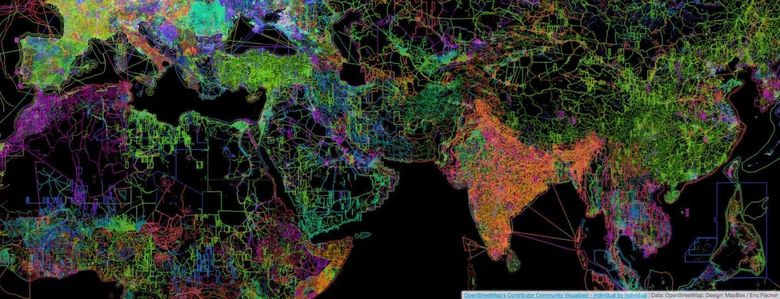
As a tool for solving cartographic problems and errors, the OpenStreetMap (OSM) project appeared, on the basis of the data of which our MAPS.ME service exists. OSM has a huge amount of data: not only the sketched satellite images, but also information that only locals know. Today we will tell you more about how the real world is being digitized and becoming a map.
Photographing the area
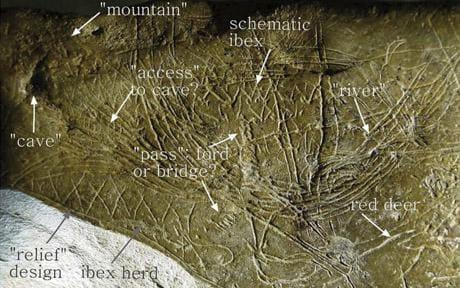
This card is 14,000 years old.
The first maps appeared in the period of primitive history. The bends of the rivers, ridges, ravines, rocky peaks, animal trails - all objects were denoted by simple notches, wavy and straight lines. Subsequent maps are not far from the first schematic drawings.
The invention of the compass, telescope, sextant, other devices of marine navigation, and the subsequent period of the Great Geographical Discoveries, led to the flowering of cartography, but the maps were still not accurate enough. The use of various instruments and mathematical methods could not be a solution to the problem - after all, people drew maps using a description or charts created on location.
A new stage in the development of cartography began with a topographical survey. For the first time, ground-based survey work for the manufacture of topographic maps began to be carried out in the 16th century, and the first aerophoto-topographic surveys of remote areas were carried out in the 1910s. In Russia, both cadastral and notorious “General Staff maps”, the accuracy and coverage of which at that time were unprecedented, were created by topographers with the help of a theodolite .

An example of decoding the middle of the last century
After aerial surveys, a lengthy and complex decryption step is required. Objects in the picture need to identify and recognize, establish their qualitative and quantitative characteristics, as well as register the results. The decryption method is based on the laws of photographic reproduction of optical and geometric properties of objects, as well as on the relationship of their spatial distribution. Simply put, three factors are taken into account: optics, image geometry and spatial distribution.
Contour-combined and stereotopographic methods are used to obtain relief data. The first method directly on the ground with the help of geodetic instruments determine the height of the most important points of the surface and then on the aerial photographs put the position of the contour lines. The stereotopographic method implies a partial overlap of two images with each other in such a way that the same piece of terrain is depicted on each of them. In a stereoscope, this area looks like a three-dimensional image. Further, according to this model, the heights of the terrain points are determined with the help of instruments.
Satellite shooting
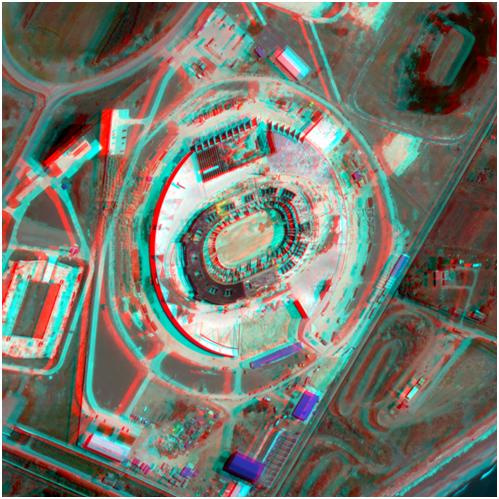
An example of a stereo pair from WorldView-1 satellite
Similarly, creating a stereo image, and work satellites. Information on the relief (and many other data, including radar interferometry — the construction of digital terrain models, the determination of displacements and deformations of the earth’s surface and structures) are provided by radar and optical remote sensing satellites.
Ultra-high-resolution satellites do not photograph everything (endless Siberian forests are not needed at high resolution), but by request for a specific territory. These satellites include, for example, Landsat and Sentinel (Sentinel-1, which is responsible for radar imaging, Sentinel-2, conducting optical imaging of the Earth’s surface and studying vegetation, and Sentinel-3, observing the state of the world’s ocean) are in orbit.
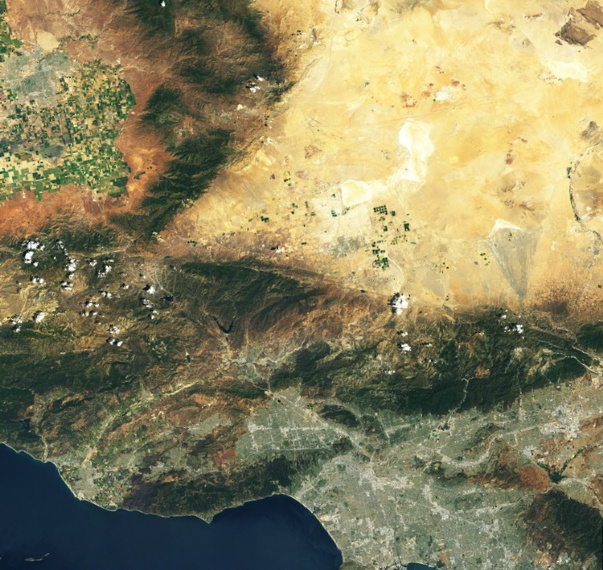
Los Angeles image taken by Landsat 8 satellite
Satellites send data not only in the visible spectrum, but also in the infrared (and several others). The data from the spectral ranges invisible to the human eye make it possible to analyze surface types, monitor crop growth, identify fires and much more.
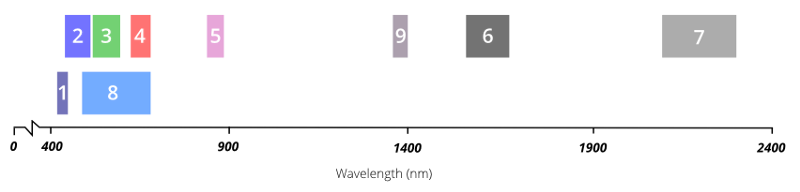

The Los Angeles image includes electromagnetic spectrum bands that correspond (in Landsat 8 terminology) to ranges of 4-3-2. Landsat designates red, green, and blue sensors as 4, 3, and 2, respectively. A full-color image appears when the image from these sensors is combined.
Satellite owners and official distributors - DigitalGlobe, e-Geos, Airbus Defense and Space, and others accept and process data. In our country, the main suppliers of satellite imagery are Russian Space Systems , Sovzond and ScanEx .
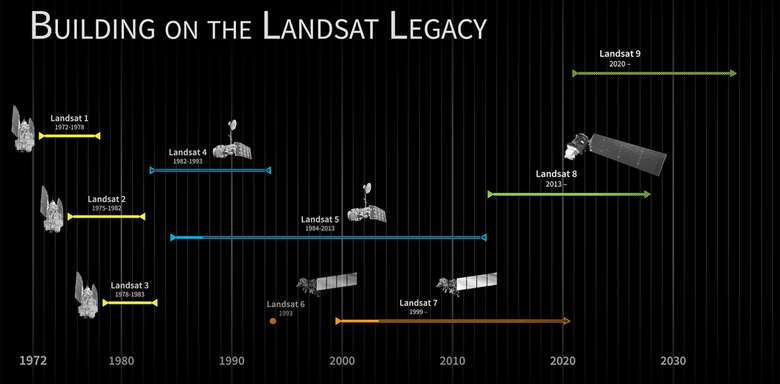
Many services are based on the Global Land Survey (GLS) data sets from US Geological Survey (USGS) and NASA. GLS receives data mainly from the Landsat project, which has been creating satellite images of the entire planet in real time since 1972. With the help of Landsat you can get information about the entire earth's surface, as well as its changes over the past decades. It is this project for all public mapping services that remains the main source of Earth remote sensing data on small scales.
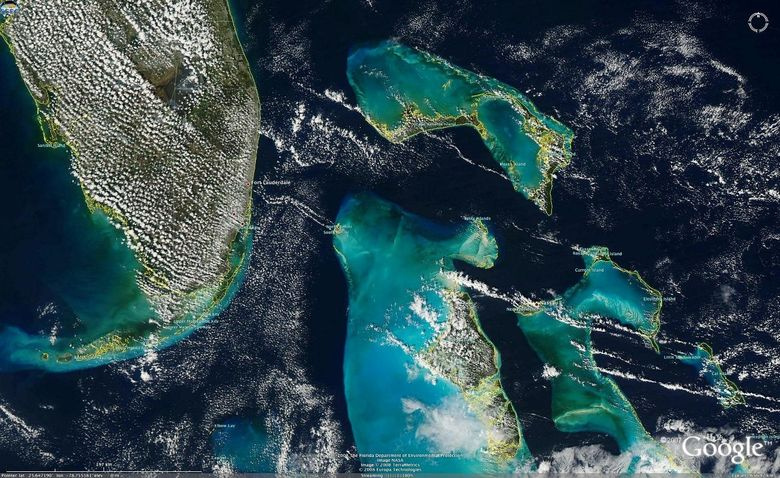
The Bahamas in terms of MODIS
The medium-resolution scanning spectroradiometer MODIS (MODerate-resolution Imaging Spectroradiometer) is located on the Terra and Aqua satellites, which are part of the comprehensive NASA EOS (Earth Observing System) program. The resolution of the resulting images is coarser than the results of most other satellites, but the coverage allows you to get a daily global collection of images almost in real time.
Multispectral data is useful for analyzing the earth's surface, ocean and atmosphere, allowing on-line (literally several hours) to study changes in clouds, snow, ice, water bodies, vegetation, track the dynamics of floods, fires, etc.
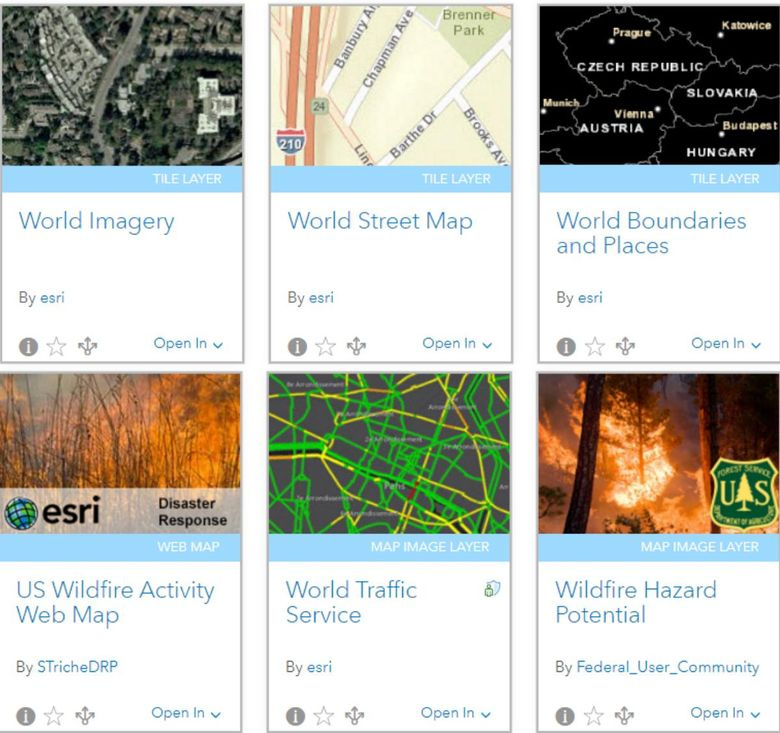
" Living Atlas of the World " - an atlas containing maps and data on a variety of topics: population, business, landscape, climate, transport, etc.
Roscosmos Geoportal is a free (partly) data source. Satellite images are provided by Roscosmos and NASA, map data is OpenStreetMap and Rosreestrom, search tools are GeoNames and OpenStreetMap Nominatim .
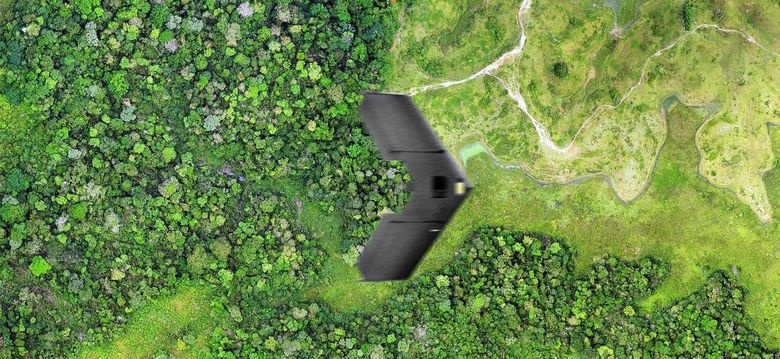
In addition to satellites, there is another promising direction of "vertical" shooting - data acquisition from drones. So the company DroneMapper sends drones (rarely quadrocopters) for shooting farm land - it turns out more economical than using a satellite or a plane.
Satellites provide a huge amount of diverse information and can take pictures of the whole Earth, but companies order data only for the territory they need. Due to the high cost of satellite imagery, companies prefer to detail the territories of large cities. Everything that is considered under-populated terrain is usually taken off in the most general terms. In regions with constant cloudiness, satellites make new and new pictures, achieving a clear image and increasing costs. However, some IT companies can afford to purchase images of entire countries. For example, Bing Maps.
On the basis of satellite images and measurements on the ground, vector maps are created. Processed vector data is sold to companies printing paper maps and / or creating cartographic services. It is expensive to draw maps by satellite imagery, so many companies prefer to buy a ready-made solution based on the Google Maps API or Mapbox SDK and modify it with their own staff of cartographers.
Satellite map problems
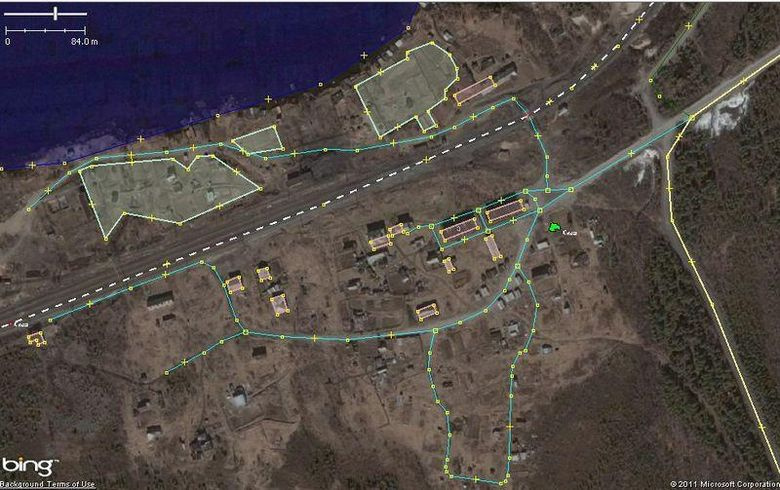
In the simplest case, to draw a modern map, it is enough to take a satellite image or its fragment and redraw all objects in the editor or in some online interactive map creator service. At first glance, in the example above from OSM everything is fine - the roads look like they should look. But this is only at first glance. In fact, these digital data do not correspond to the real world, as they are distorted and shifted relative to the real location of objects.
The satellite photographs at an angle at high speed, photography time is limited, pictures are glued together ... Errors overlap each other, so they began to use photo and video on the ground to create maps, as well as geo-tracking of cars, which is clear evidence of the existence of a certain route.
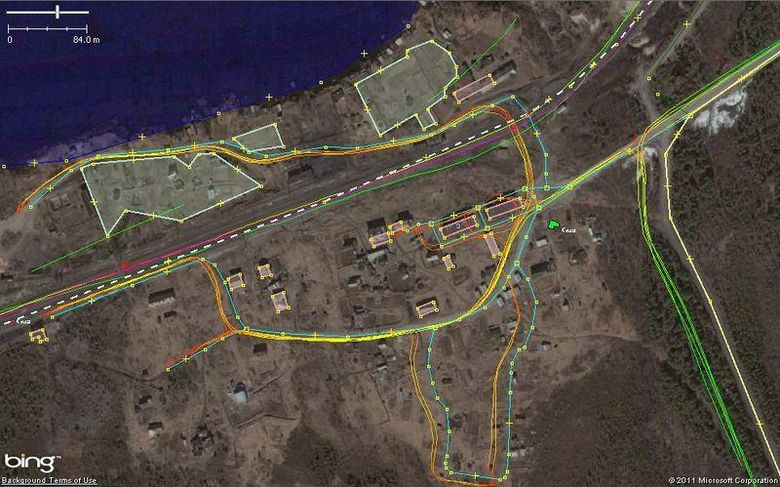
An example of a snapshot on which a problem arose due to poor orthorectification: the tracks formed excellent water on the water, and they moved away on the right side of the mountain
The terrain, shooting conditions and type of camera affect the appearance of distortion in the images. The process of eliminating distortions and transforming the original image into an orthogonal projection, that is, one in which each point of the terrain is strictly vertical, is called orthorectification.
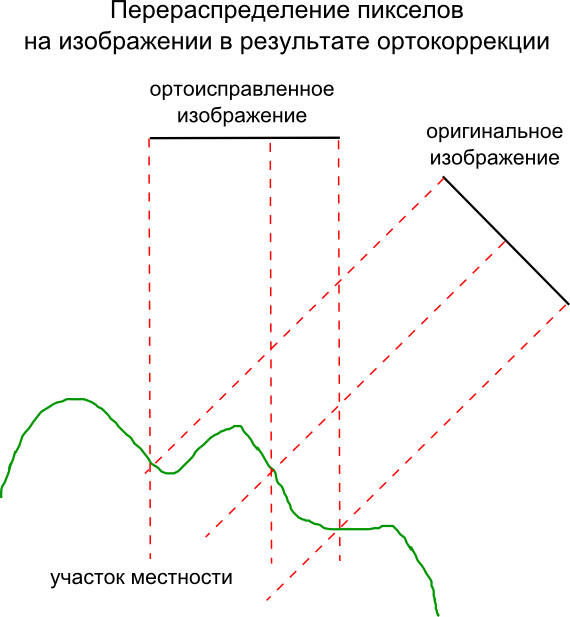
Redistribution of pixels in the image as a result of orthocorrection
Using a satellite that would shoot only above a given point is expensive, so shooting is at an angle that can reach 45 degrees. From a height of hundreds of kilometers, this leads to significant distortions. To create accurate maps, high-quality ortho-rectification is vital.
Cards quickly lose their relevance. Have you opened a new parking lot? Built a bypass road? Has the store moved to a different address? In all these cases, outdated images of the territory become useless. Not to mention the fact that many important details, be it a ford on a river or a path in the forest, are not visible in pictures from space. Therefore, work on maps is a process in which it is impossible to put a final point.
How to make OpenStreetMap maps
OpenStreetMap is a non-profit mapping project in which a community of users from all over the world creates an open, free geographic map. To create maps, they use data from personal GPS trackers, aerial photographs, videos, satellite images, as well as human knowledge. The closest project to which OSM can be compared is Wikipedia. Similarly, in OSM, any user edits the map, and the project data is distributed under a free license.
In OpenStreetMap use as a basis for maps GPS-tracks, recorded by users, and satellite images from the companies Bing, Mapbox, DigitalGlobe. Maps of commercial companies, such as Google and Yandex, cannot be used due to legal restrictions.
Snapshots are attached to the terrain automatically at the receiving stage. Scans can also be linked using anchor points with known coordinates obtained from tracks or associated with points of a geodetic network.
When editing maps, satellite images in OSM always shift as recorded on the ground show the tracks, compensating for most errors. There are lots of applications that allow you to record and share GPS tracks, for example, Geo Tracker , Strava (Android) and GPX Tracker (iOS).
The creator of the map in the satellite image first draws the road using the data tracks. Since the tracks describe the movement in geographic coordinates, it is easy to determine from them exactly where the road passes. Then all other objects are applied. Missing and polygon objects are created by snapshots, and signatures that indicate that the objects belong to or supplement them with reference information are taken from observations or registries.
To create a map filled with various information, they use a geographic information system (GIS) designed to work with geodata - for their analysis, transformation, analysis and printing. With GIS you can create your own map with visualization of any data. In the GIS for maps, you can add data from Rosstat, municipalities, ministries, departments - all the so-called geospatial data.
Where do geodata come from
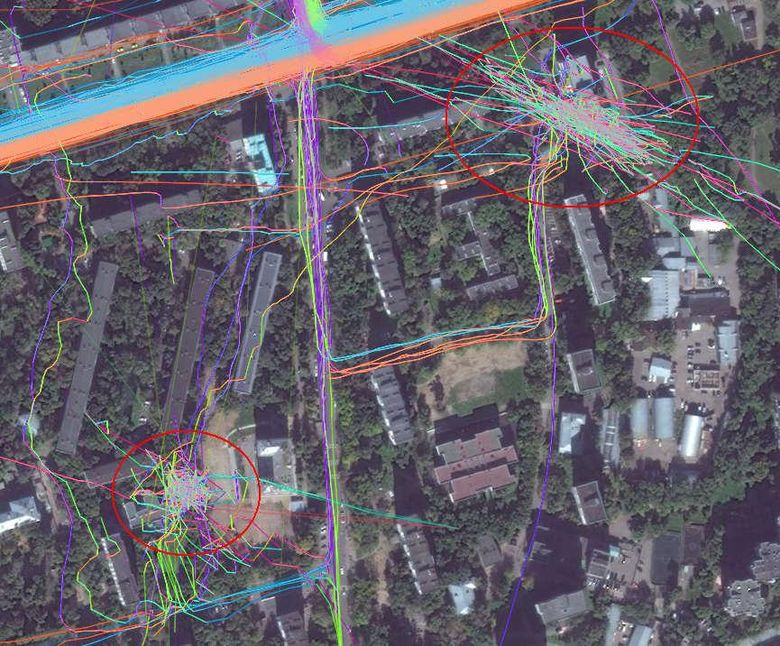
So, satellite images are shifted relative to reality by several tens of meters. To make a truly accurate map, you need to arm yourself with a navigator (GPS receiver) or a regular phone. And then using the receiver or application in the phone to record the maximum number of track points. The recording is carried out along linear objects located on the ground - rivers and canals, paths, bridges, railways and tramways, etc. will do.
One track is never enough for any segment - they themselves are also recorded with a certain level of error. In the future, the satellite substrate is aligned on multiple tracks recorded at different times. Any other information is taken from public sources (or donated by a data provider).
It is difficult to present maps without information about various companies. The collection of local data about organizations linked to GPS positions is done by Yelp, TripAdvisor, Foursquare, 2GIS, and others. The community (including directly local business representatives) independently enters data on OpenStreetMap and Google Maps. Not all large networks want to bother themselves with the addition of information, so they turn to companies ( Brandify , NavAds , Mobilosoft, and others) to help place branches on maps and monitor the relevance of the data.
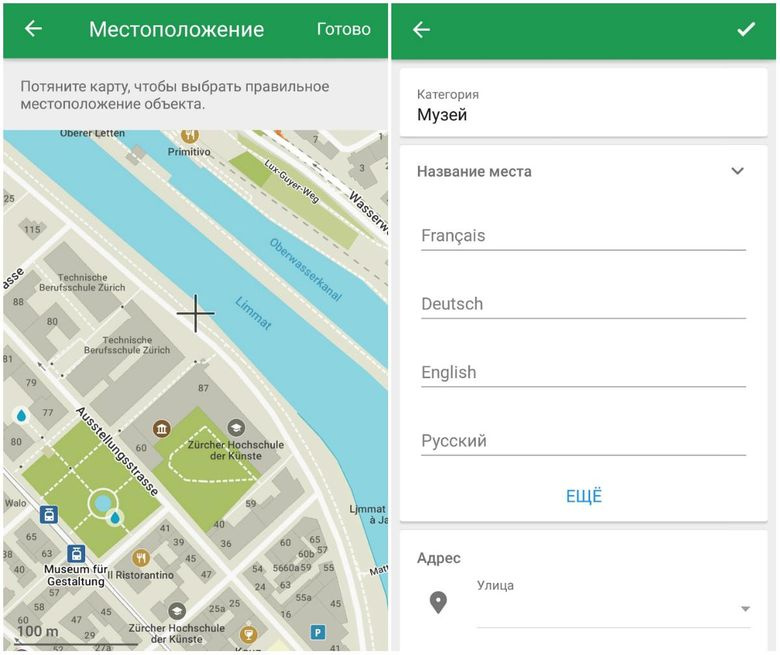
Sometimes information about real-world objects is added to maps through mobile applications — immediately, in the field, a person can accurately update the map data. MAPS.ME has a built-in map editor for this, through which the updated data comes directly to the OpenStreetMap database. The accuracy of the information is verified by other members of the OSM community. In the “opposite direction”, data from OSM comes to MAPS.ME in “raw” form. Before they appear on the screen of the user's smartphone, they are processed and packaged.
Future: neural network cartographers
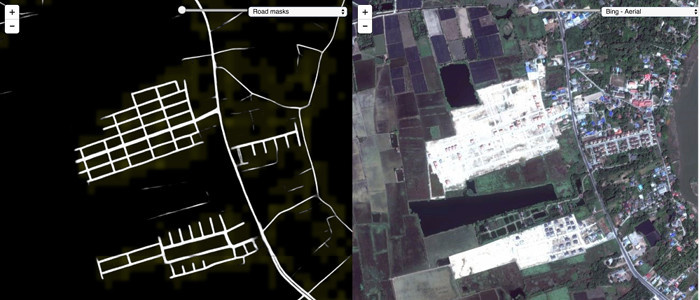
Facebook said that they used machine learning algorithms to find the roads on satellite imagery. But the factual billing has already been done by people who checked the roads and “glued” them with OSM data.
The service for exchanging photos with Mapillary geotags last year added a function that provides semantic segmentation of images of objects. In fact, they were able to divide the images into separate groups of pixels corresponding to one object while determining the type of object in each area. People do this very easily - for example, most of us can identify and find cars, pedestrians, houses in the images. However, computers were hard to navigate in a huge array of data.
Using deep training on the convolutional neural network, Mapillary was able to automatically identify 12 categories of objects that are most often found in the road scene. Their method makes it possible to make progress on other tasks of computer vision. Ignoring coincidences between moving objects (for example, clouds and vehicles), one can significantly improve the chain of processes for converting source data into a two-dimensional or stereoscopic image. Mapillary semantic segmentation provides a rough estimate of the density of vegetation or the presence of sidewalks in some areas of cities.
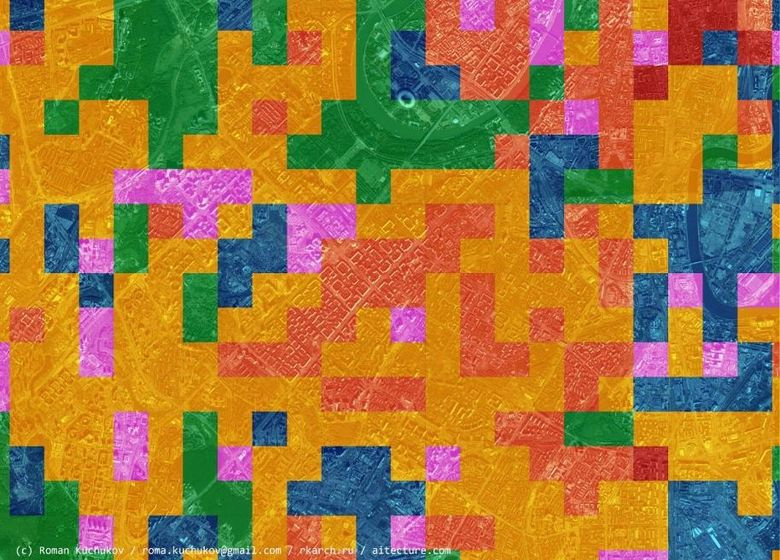
South-West of Moscow divided the neural network into zones depending on the type of development
The CityClass project analyzes the types of urban development using a neural network. To make a map of the functional zoning of the city is long and monotonous, but it is possible to train a computer to distinguish an industrial zone from a residential one, and a historical building from a microdistrict.
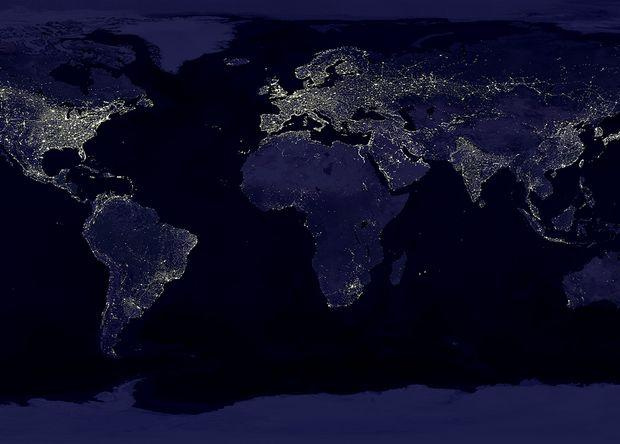
A team of scientists from Stanford has trained the neural network to predict the level of poverty in Africa from day and night satellite imagery. First, the grid finds the roofs of houses and roads, and then compares with the data on the illumination of territories at night.
The community continues to follow the first steps in the field of automatic map creation, and is already using machine vision to draw certain objects. It is difficult to doubt that the future will belong to the cards created not only by people, but also by machines.
All Articles